International Research Journal of Engineering and Technology (IRJET) e ISSN:2395 0056

Volume: 09 Issue: 06 | June 2022 www.irjet.net p ISSN:2395 0072
International Research Journal of Engineering and Technology (IRJET) e ISSN:2395 0056
Volume: 09 Issue: 06 | June 2022 www.irjet.net p ISSN:2395 0072
Raviraj Bhandari1, Reena Pagare2
1,2 MIT School of Engineering, MIT ADT University, MAEER’s Rajbaug Campus, Loni Kalbhor, Pune 412201 ***
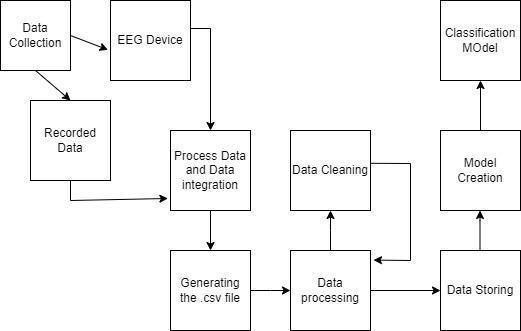
Abstract: Dysfluency is a term used to describe a person's inability to create fluent, smooth speech or typical speech abnormalities. People who start out with typical developmental disfluencies may progress to stuttering as a result of their speech stuttering. To that end, we give a review of contemporary machine learning and deep learning algorithms for using EEG to detect and characterize stuttering in speech.EEG and speech extraction devices like microphones are used. The extracted data from the EEG and microphone will be used in the word and time domains. A separate CSV file will be generated for our dataset, which will be used for classification models This document provides a high level review of the various methods for speech and word extraction. The study also provides a brief summary of the EEG device that can be utilized, as well as how we might combine the two methodologies to develop a classification model for determining the status of consumers.
Key Words: MFCC, FFT, Mel scale Filtering, SVM, Multiscale Support vector machine, Feature vector calculation,CNSandPNS.
Speech disfluency is the disruption in the flow of spoken language that is caused by the speaker, the consumer or patient . It includes shuttering and hesitations people insert to avoid awkward pauses while they find the next words and perhaps ensure there is no opening to allow interruption.
The EEG (electroencephalogram) device is used to collect the data from two sources the Central Nervous (CNS) system in the form of electrical impulses and Peripheral Nervous System (PNS) in the form of voice . The data collected will be displayed on the screen with the time durationat whenitiscaptured.
The data from the microphone and EEG device is merged to formaclassificationmodel.
The data from CNS will be displayed on the screen of an application in the form of a graph of electrical impulses generated in the brain of the subject and this data will be collectedwiththehelpofanEEGheadset.
The data from PNS will alsobe displayed on the screen of the application just adjacent to the data of CNS. The data from PNS will be in the form of a voice recording of the subject which will be collected with the help of a microphone.
1. Multisite Schizophrenia Classification based on BrainnetomeAtlasbyDeepLearning:
Year:2018
Advantage: Combinethebrainnetomeatlas(vivomapthe brain) to extract features, and propose the generalized feature invariant deep neural network framework to ensure the model generation in automatic diagnosis of schizophrenia.
Disadvantage:study was need to predict disease progressionoflongitudinalstudies,
2.Model need to be validated with different racial or population
Dataset: Collected 1275 participants at 8 sites, including 662schizophrenicpatients.
Result:ComparetheresultbetweentheirmethodandSVM classifier,gothigheraccuracyof76.82%
2. Automated Verbal and non verbal Speech analysis of interviews of individuals with schizophrenia and depression
Year:2019
Advantage: 1.Took both verbal and non verbal data on a real time
International Research Journal of Engineering and Technology (IRJET)
e ISSN:2395 0056
Volume: 09 Issue: 06 | June 2022 www.irjet.net p ISSN:2395 0072
2.Uses NSA 16 a semi structured interview containing 16 items that comprehensively assess the negative syndrome ofschizophrenia.
Disadvantage: 1.Result was limited by the accuracy of the automatic speech recognition system.2.almost one fifth to one thirdwordsweremissingandabout50%wordswere notcorrectlyconverted.
Dataset: Took real time interview conversation using NSA (negativesymptomassessment
Result: Findings; the most salient difference between schizophrenia and depression is response time, whereby patientswithschizophreniatooklongertimetorespond.
Got accuracy of 71.4 % and 70.5% for verbal and non verbalrespectively.
3. Schizophrenia Classification with Single Trial MEG duringLanguageProcessing
Year:2014
Advantage Uses different classification methods and compareaccuracy(Bayes,KNN,LDA,SVM)
2.Useswordsandsentencesforclassification
Dataset: Real time data taken from 6 healthy and normal people and 6 schizophrenia patients, to read words and sentences silently while 248 channel MEG signals were recorded.
Result:4typesformachinelearningbasedclassifierswere abletoachievehighcrossvalidationaccuracyinclassifying 470wordsand450sentencetrailsintothecorrectgroup.
For words LDA gives accuracy of 98% and for sentences KNNwith98%.
4.Multi layerSupportVectorMachine
Year:2018
Advantage: Brief about the multi layer support vector machine
2.differencebetweenSVMandMLSVM
5. Improvement of MFCC Feature Extraction Accuracy usingPCAinIndonesiaSpeechRecognition
Year:2018
Advantage: MFCC method with Principal Component Analysis(PCA)toimprovetheaccuracy
Disadvantage: 1.High result feature dimension of the extractionmethod.
2.Accuracywaslimitedtothedatabase.
3.languagewasforIndonesianspeechrecognitionsystem.
Dataset:Took140speechdatathatwererecordedfrom28 speakers.
Result: Explain how PCA could be applied in the speech recognition system by wielding the function of feature Datareducing.AddingPCAtoMFCCconventionalmethods couldincreaseaccuracyfrom80%to89.29%.
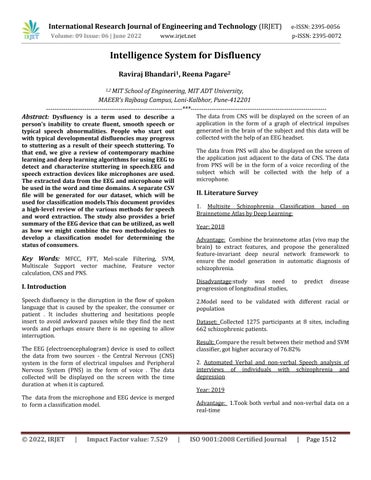
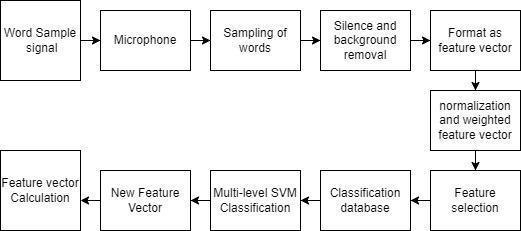
The first portion will involve using the feature vector computation and the MFCC extraction method to extract featuresfromrecordeddataorliveinteractions.
3.1.1 MFCC (Mel frequency cepstral coefficient) is a shorthand for MFC (Mel frequency cepstral coefficient), which is a representation of a sound's short term power spectrum based on the linear cosine transform of a log powerspectrumonanonlinearMelfrequencyscale.
Key terms:
1. Sound Spectrum: it is usually presented as a graphofpowerasafunctionoffrequency,inshort it is a short sample of a sound representing a sound.
2. Power Spectrum: It is a representation of the resultofFouriertransform.
3. Linear cosine transforms: They are calculated using a Fourier transform. We need both short time and fast time Fourier transform at different stagesduringconversion.
4. Mel Scale: Itscalesthefrequencyofa toneto the actualmeasuredfrequency.
A frequency measured in Hertz(f) can be convertedtotheMelscaleusing: Mel(f) = 2595log(1+f/700)
International Research Journal of Engineering and Technology (IRJET) e ISSN:2395 0056
Volume: 09 Issue: 06 | June 2022 www.irjet.net p ISSN:2395 0072
5. Fast Fourier Transform: It converts a signal from its domain (time or space) to a representation in the frequency domain and vice versa.
6. Nyquist Frequency: is called the Nyquist limit, is the highest frequency which is coded at a given sampling rate so that it can fully reconstruct the signal,i.e., f_(Nyquist)=1/2nu
7. Short-time Fourier transform (STFT): itisused to determine sinusoidal frequency and phase content of local sections of a signal as it changes overtime.
*The idea behind performing this is that it helps us for the short interval of audio which assumed tobesteady
Step1: Getyouraudioinatimedomainformat.
Step2: Convert your audio in a periodogram. (Power spectrum is also known as periodogram) with the help of FastFourierTransform.
*It'sdonesoasitwillgiveusaNyquistfrequencybydown samplingouraudiosothatwecanidentifythesound.
Step3: After this we convert our periodogram into a spectrogram.
*They are periodograms at different intervals stacked together
Step4: WewillperformaShortFourierTransform.
*As STFT is segmenting the signal into narrow time intervalsandtakesFouriertransformofeachsegment.
Step5: Now to prevent spectral leakage wewill perform a hammingwindow.
*Spectral Leakage: It's a mismatch between desired tone and chosen frequency resolution, it takes place due finitewindowingofthedata(generallywhenwepassdata toDFT/FFTalgorithm)
*Hamming Window: It’s a taper formed by using a raised cosinewithnon zeroendpoints.
Step6: We will again perform Fast Fourier Transform to convertamplitudeintofrequency.
Step7: Now to convert frequency into Mel Scale *As Mel Scale it perceives frequency of a tone to the actual measuredfrequency.
Step8: Nowperformlogarithmofallfilterbankenergies.
*Filter bank separates or splits the input signal into multiple components; it is used to compress the signal when some particular frequencies are more important thanotherfrequencies.
Step9: PerformIDCTofthelogfilterbankenergies.
*IDCT: Inversediscretecosinetransforms
Step10: KeepIDCTcoefficient2 13,discardtherestofthe coefficient(12 13areconsideredtobethebest)
*librosa: it is a python library for analyzing audio and music. It has a flatter package layout, standardized interfaces and names, backwards compatibility, modular functions,andreadablecode.
3.1.2 EEG headsets, it is a method of tracking the electrical activity of the brain. It measures small voltage fluctuationsthatresultfromioniccurrentsinneurons,i.e., itmeasuresbrainwaves.
The absolute band powers arethebrainwavevalues;the logarithmusedforthePowerSpectralDensity(PSD)ofthe EEGdataforeachchannelis:
1.Delta 1to4Hz
2.Theta 4to8Hz
3.Alpha(7.5 13Hz)
International Research Journal of Engineering and Technology (IRJET) e ISSN:2395 0056
Volume: 09 Issue: 06 | June 2022 www.irjet.net p ISSN:2395 0072
4.Beta 13 30Hz is a frequency range between 13 and 30 Hz.
The EEG PSD values that we obtained from the sensors weretypicallyinthe 1;+1range.
Raw:TherawEEGvaluesdisplayeachsensor'srawdatain microvolts,witharangeof0to1682.
*VerticalMaxisasettingthatcanbechanged.Thesensors are:
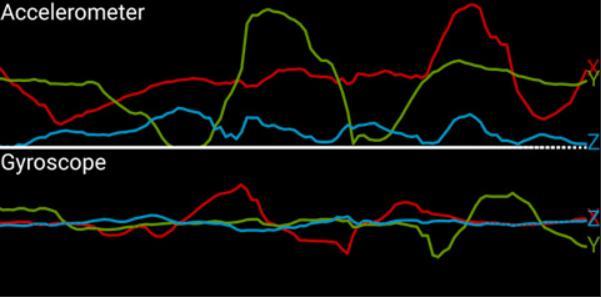
TP9isfortheleftear,andAF7isfortheleftforehead.
AF8 Therightsideofthehead
TP10isthenumberfortherightear.
RightAuxiliary(MU 02/MU 03only)AUXR
*Low values are represented by blue, medium values are represented by green, and high values are represented by red(fig3)
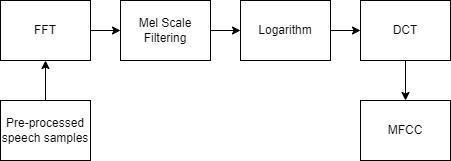
*Accelerometer This is the gravitational effect on the headband,measureding(9.81m/s2).
Some representations are present when the headband is wornonalevelhead:

1.Xwillshowtheup/downtiltofthehead.
2.Y represents the movement of the head to the left and right.
3.Zwilldisplayverticalup/downmotion(jumping). (Fig4)
Figure2showsthesensorsonthemuseandhowtheyare connected.
Hereareafewthingstokeepinmind:
1.Solidovalsmakestrongconnections.
2.Outlineshavepoorrelationshipsandaredifficulttoread.
3.Anemptyspaceindicatesthatthereisnolink.
*The position ofAF7 andAF8onMUSE2is dependent on head size (it can be available on brochure). These may be closertoFP1andFP2onotherskulls(Referbrochureand YouTubetoadjusttheseforbetterperformance).
Discrete: Discrete frequency values are represented by a log scale. These are calculated using a hamming window andaFastFourierTransform(FFT)oftherawdata.
*The FFT window can be customized in settings, and you canchoosewhichsensorstoincludeintheFFTcalculation.
Spectrogram: The spectrogram displays discrete frequencydataplottedovertime.
For full manual and step it's easily available with the EEG productandinthereferencelink[4].
AftercollectingdatafromthemicrophoneandEEG,wewill merge the data in the .csv file so that we can use the data forclassification.
e ISSN:2395 0056
Volume: 09 Issue: 06 | June 2022 www.irjet.net p ISSN:2395 0072
Table1: represents the dataset after collecting data from microphone and EEG data.
Timeinseconds MicrophoneData EEGdata
Time Words Pitch Amplitude
1.2 hmm 5 8 1 ok 4 7
1.1 yes 4 7
The above table represents the dataset format of the data orwhatwe’llbecollecting.
Now the data is being collected in a .csv file we’ll refer to thedatabaseforFeatureClassification.
But here we will be also using a dataset that will be working as a substitute for the MUSE2 headset dataset; it willalsobea.csvfilethatisavailableonKaggle.
Table2: Muse2 EEG dataset.
mean_ 0_a mean_ 1_a mean_ 2_a mean_ 3_a mean_ 4_a 4.62E+ 00 3.03E+ 01 ##### ### 1.56E+ 01 2.63E+ 01
2.88E+ 01 3.31E+ 01 3.20E+ 01 2.58E+ 01 2.28E+ 01 8.90E+ 00 2.94E+ 01 ##### ### 1.67E+ 01 2.37E+ 01
1.49E+ 01 3.16E+ 01 ##### ### 1.98E+ 01 2.43E+ 01
2.83E+ 01 3.13E+ 01 4.52E+ 01 2.73E+ 01 2.45E+ 01
3.10E+ 01 3.09E+ 01 2.96E+ 01 2.85E+ 01 2.40E+ 01
1.08E+ 01 2.10E+ 01 4.47E+ 01 4.87E+ 00 2.81E+ 01
We are investigating SVM (support vector machine) for feature classification since SVM uses supervised learning techniques for classification and regression. An SVM classifier'spurposeistofitahyperplanetoafeaturespace to distinguish two different classes, and it chooses a hyperplane that leaves a maximum margin for both classes.
However, there are situations when noise interferes with the feature. When there is noise, there is a risk of pattern mixing between the classes; to mitigate this, we use MLSVM (multi level support vector), which draws the second hyper planes. The optimal hyper plane may be created to separate the two classes in this iterative phase, and this will continue for all classes until complete classificationhasoccurred.
Fig6: Multi level SVM feature classification block diagram as feature vector
We've gone through how to use an EEG device and microphone to determine a patient's level of mental illness,aswellashowtodevelopaclassificationmodel.
International Research Journal of Engineering and Technology (IRJET) e ISSN:2395 0056
Volume: 09 Issue: 06 | June 2022 www.irjet.net p ISSN:2395 0072
We've only examined one type of classification approach; in future research, we'll focus on implementation and alternativecategorizationmodels.
For future scope we will be comparing different methods to extract data from EEG and different classification methods which can give the best Accuracy for classification.
I’m extremely grateful to Dr. Reena Pagare, Assistant Professor, MIT ADT University, Pune, India, who has been an invaluable source of help and direction during this project.

Raviraj Bhandari,
PursuingIntegratedMtechdegreefromMIT Adt University, in Computer science engineering and specialisation in Intelligencesystemandanalysis.

Dr. Reena Pagare, Associate Professor MIT Art, Design and Technology University, University Lead Manager, Executive Body Member MIT ADTUAlumniAssociation,Chair IEEEPune SectionEngineeringinMedicineandBiology Society.
5. Article: Collecting Brain Signal Data Using The Muse 2 Website: EEG Headset Collecting Brain Signal Data Using The Muse 2 EEG Headset | by Tim de Boer | Building a bedroomBCI|Medium
6. Website: Our EEG Headset Reviews The Best EEG HeadsetIn2021(the unwinder.com)
7. Speech Mel Frequency Cepstral Coefficient Feature Classification using Multi level support Vector Machine; Abhay Kumar, Sidhartha Sankar Rout, Varun Goel; 2017 4th IEEE Uttar Pradesh section international conference; UPCONGLAuniversity,Mathura.
8. Language Identification from Speech Features Using SVM and LDA; J.S. Anjana and S.S. Poorna; 2018 International Conference on Wireless Communications, SignalProcessingandNetworking(WiSPNET);2018IEEE
9. Website: Support Vector Machine; Support Vector Machine(SVM)Algorithm Javatpoint
10. MultilevelWeightedSupportMachineforClassification onHealthcareDatawithmissingValues;Talayehrazzaghi, OlegRoderick,IIyaSafro,NicholasMarko;2016;Multilevel Weighted Support Vector Machine for Classification on HealthcareDatawithMissingValues(plos.org)
Reference
1. EEG classification During Scene Free Viewing for Schizophrenia Detection; IEEE transactions on Neural Systems and Rehabilitation Engineering; 2019; DOI: 10.1109/TNSRE.2019.2913799;PubMedID:31034418
2. Website: MFCC technique for speech recognition MFCC TechniqueforSpeechRecognition AnalyticsVidhya
3. Website: DEWESoft Short time Fourier Transform > FrequencyDomainAnalysis>Math>General>Modules> Setup|DewesoftXManualEN
4. Website: MuseIO available data http://developer.choosemuse.com/tools/available data