International Research Journal of Engineering and Technology (IRJET) e ISSN: 2395 0056

Volume: 09 Issue: 06 | Jun 2022 www.irjet.net p ISSN: 2395 0072

International Research Journal of Engineering and Technology (IRJET) e ISSN: 2395 0056
Volume: 09 Issue: 06 | Jun 2022 www.irjet.net p ISSN: 2395 0072
1
2,3,4,5,6,7
Mechanical
Abstract This research investigates the production of flexible rubber powder tiles using tire waste in addition to polyurethane resin as a binder. The material is an eco friendly solution to a growing problem in the world, rubber tires are mostly discarded or burned to extract their reinforced steel wires instead of being properly recycled. The results of this research can be considered as a way of recovering rubber waste. Various trials of experimental work that were carried out and are explained in details. Different particle size distributions, rubber contents, and tests were examined and then tested. Characterization analysis of tensile, compression, hardness, and aging tests were carried out to evaluate the composites. The results conclude that the amount of rubber used is too large compared to the resin, which increases the percentage of rubber in the formulations, thus using more recycled waste. The benefits of waste rubber composites are that they are an inexpensive, lightweight, and economical solution for waste rubber disposal. Rubber composites led to their use in energy absorption and thermal insulation. The flexible characteristics of the resin and rubber blend allow these composites to be used in a variety of applications. Results clarified that the composite can work very well for various applications, such as soft floors and barriers.
Key Words: Rubber tiles, recycling process, composite material, polyurethane resin, flexible rubber powder, and vulcanized rubber.
Duetotheexpansioninmanufacturingofvehiclesand the significant increase in the numbers of scrap tires in landfills, which consumes lots of space and endanger the nearbyinhabitantsduetotheenvironmentalhazardsofthe tires landfill. This fact initiated the need to get rid of the scrap tires in the most efficient way which led to the recyclingofrubber[1].
Recycling is the process of collecting and processing materials that would otherwise be discarded like garbage andturningthemintonewproducts.Itischallengingtofind waystoproducemoreenergyandreducewasteproduction whileminimizinglimitednaturalresources[2]
***
Everyyear,worldwide,1.6billionnewtiresandaround1 billion used tires are produced. However, the recycling industryonlyprocesses100milliontiresperyear[3].This factexplainsthesizeoftheproblemandclarifiesthatthere has to be a quick and effective step in order to solve this problemforbothenvironmentalandeconomicreasons
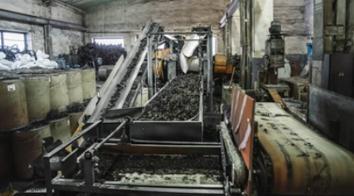
Scraptireshavebeenrecycledfornearlyacentury,but the market has grown significantly over the past two decadesduetotheincreaseinapplicationsthathaveledto theinnovationinmanufacturingcurrentlyshown.Recycling ofwasterubberhasbeendonetosomeextentbytherubber industryalmostfromitsinception,andthefirstcommercial activitiesinrubberrecycling,byreclaiming,begannotlong aftervulcanizationwasdeveloped.Recyclingrubberthrough the production of recycled rubber was of sufficient commercialinterestinthe19thcenturyforthedevelopment of three different types of remedial procedures. Figure 1 showspartoftherubberrecyclingprocess.
AlthoughmosttiresandtirewasteareproducedinChina with about 60% of the total world production [4]. In the United States and Europe, new problems are emerging in developing countries, such as poor management of waste andobsoletetechnologies,weakenvironmentalpolicies,and socialproblems(suchasillegaltireburning)[5].
Various researches were carried out to study the manufacturing of rubber tiles, their composites, and their properties.
International Research Journal of Engineering and Technology (IRJET) e ISSN: 2395 0056
Volume: 09 Issue: 06 | Jun 2022 www.irjet.net p ISSN: 2395 0072
PaulinaKosmela,AdamOlszewski,etal.concludedthat the compressive and tensile performance of composites filledwithwasteoil modifiedgroundtirerubberwasalmost thesameasfortheunfilledfoam.Theyemphasizetheneed forcompatibilizationofthesematerialsbytheenhancement ofinterfacialinteractionsbetweenthepolyurethanematrix and rubber filler phase, which significantly affects the performance properties of prepared materials [6]. Khalil Ahmed, Nudrat Riza, et al. developed natural rubber reinforced with marble sludge by compression [7]. Chan Wen Shan,Maizlinda Izwana Idris, et al. showed that the interactions and the properties of foams of polyurethane with coconut coir fibers and recycled waste tires are presented[8].ShahruddinMahzan,I.Maznan,etal.studied polyurethane foams that contain various fillers of Kenaf fibersandrubberparticlescontainedinrecycledtires[9].
Tirerubberwasalsousedinconstructionworks.Diego Orlando, Daniella Mulinari, et al. analyze the feasibility of using waste rubber tires that are reinforced with polyurethane (PU) foam obtained from castor oil to gain composites [01]. Xin Xiao, Jiayu Wang, et al. innovate a mixture of waste ties rubber thermoplastic polyurethane resin with a higher elastic modulus that using as a water resistantmaterialforhigh speedrailwaystructures[00].
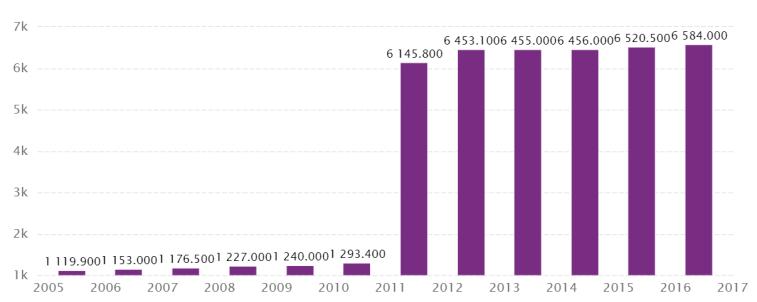
In Egypt, tire data was reported at 6,584.000 units in 2016. This is an increase from the previous number of 6,520.500for2015.IndustrialproductioninEgypt:tiredata is updated every year, with an average of 1,315.000 units fromJune1992to2016,with25observations.Datahitan all timehighof6,584.000unitsin2016andahistoriclowof 1,072.800unitsin2002.IndustrialproductioninEgypt:data ontiresarereportedbytheMinistryofPlanning.Thedatais classified in Egypt by Global Database Table EG. B005: Industrial production: annual [12]. Chart 1 shows tires industrialproductioninEgyptfrom1992to2016.
Italian Egyptiancompany'Egitco'inAlexandriaandafactory named 'Abdulwahhab for tire and rubber recycling’, alongside small workshops where tires are reworked manually[13].
After reviewing most possible solutions to reduce the wasteofrubbertires,andmostoftheapplicationsusedto reducetheimpactofthisproblemontheenvironment.Most of the previous researches in this field used additional percentages of natural rubber, but this resulted in an obvious increase of the cost. Previous researches also showedthatonlyonesizeofrubbergranulesisused,butthis had a negative effect on the mechanical properties. Therefore,thedecisionwastakeninthisresearchtoproduce a mixture of rubber granules of different sizes without addinganypercentageofnaturalrubber.Manyexperiments werecarriedoutbeforestartingtoreachtheequitableand homogeneousratios,theappropriatetemperature,andthe ideal pressing time and force. This is discussed and explainedintheworkmethodologyandshownintheresults
Fourdifferentsizesofrubbergranulesareusedinthis research:mesh30(0.595mm),mesh20(0.841mm),mesh 10 (2 mm), and mesh 5 (4 mm). These meshes were obtainedafterremovingsteelandanymetalliccontentsfrom recycledtires.Thetireswereshreddedusingarotaryshear shredder machine that crushes with two counter rotating barbsathightorqueandlowspeed,itbreaks thesamples into smaller pieces of size around 15 cm2. Square blocks wereenteredintotherollcrusherstosettletheincomplete partsin the firststageand then entereda secondstage to sorttherubbergranuleswell.Then,asa final stage, these finelygroundgranuleswithagoodtexturewereenteredinto anindustrialvibratorthatcontainsthreegridsofdifferent poresinordertosortoutthedifferentsizes.
Traveling along Cairo's ringroad or through one ofits manypoorersuburbs,oneoftenencountersthepronounced smell of burnt rubber: we regularly see piles of rubbish burningonthesidesoftheroads.Egyptcreates80million wastetiresayearandonly10%ofthemarerecycled.Onlya few sophisticated tire recyclers exist in Egypt, including
Previous researches were carried out to investigate recycling or rubber tires using only one size of rubber granulesinthebasemixtureandmanyofthemalsoadded an amount of natural rubber which increases the cost. However;inthisresearch,differentcompositionsconsisting ofamixtureofdifferentsizeswereusedinordertoimprove theextentofthetextureofthetileandtofillthevoidsusing small sizedgrainstopreventtheformationofbubblesthat may cause cracks in the formation of the tile, and this is discussedintheresultslateron
According to the problem statement, the objectives are as follows:
► Reducing the number of waste tires and trying to recyclethemforthebestuse.
International Research Journal of Engineering and Technology (IRJET)
Volume: 09 Issue: 06 | Jun 2022 www.irjet.net p ISSN: 2395 0072
► Improvingthetextureofthetileusingdifferentsizes ofrubberparticleswithaproportionalamountofresin.
►Attempting to reduce the cost of the tile while maintaining its quality and appropriate mechanical properties,throughtheuseofsmallpercentagesofresin,in ordertoencouragethestartofasmallprojectthathelpsthe country’ seconomy.
For the first trial, the first batch of Polyurethane resin wasobtainedfromtheheadquartersoftheGermancompany SONAX in Egypt. Polyurethane resin is a prepolymer that does not require a catalyst to accelerate the process of polymerization and bonding of rubber particles. It can be treatedinambientconditions,whichgivesthecuredspecific gravityof1.13g/cm3 .
Forthesecondandthirdtrials,inordertotrydifferent manufacturersandseehowtheresinaffectstheconsistency ofthemixture,thesecondbatchofPolyurethaneresinwas obtainedfromtheheadquartersoftheAmericancompany DOWinEgypt.Itcanbetreatedinambientconditions,which givesthecuredspecificgravityof1.09g/cm3 Polyurethane resinmanufacturersreferto itasafine texturesolidthatis excellentforuseinvariousrubbermoldingapplications.
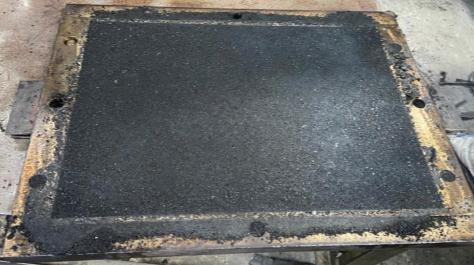
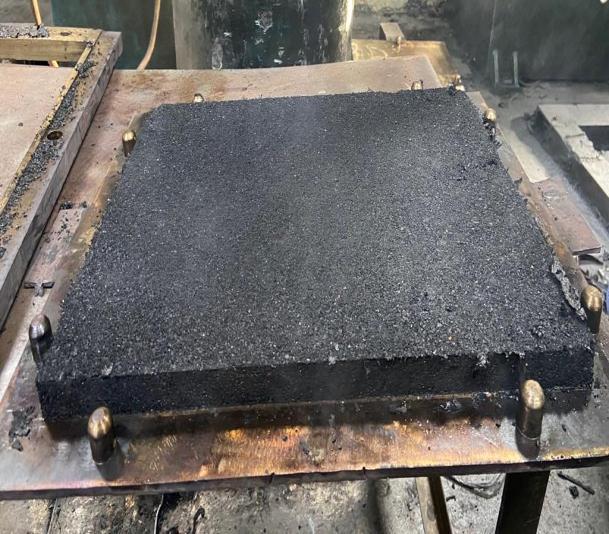
The components were prepared of the mixtures at ambient temperature, emphasizing the use of small quantitiesofPolyurethaneresininordertoreducethecost as much as possible. The components were mixed in a mechanical mixer at a speed of 50 Rev/min (rpm) for 5 minutes to ensure that the rubber granules are saturated withPolyurethane.Thenthemixtureisspreadonthemolds at ambient temperature with an appropriate and regular distributionasshownin Figures 2 a, b.
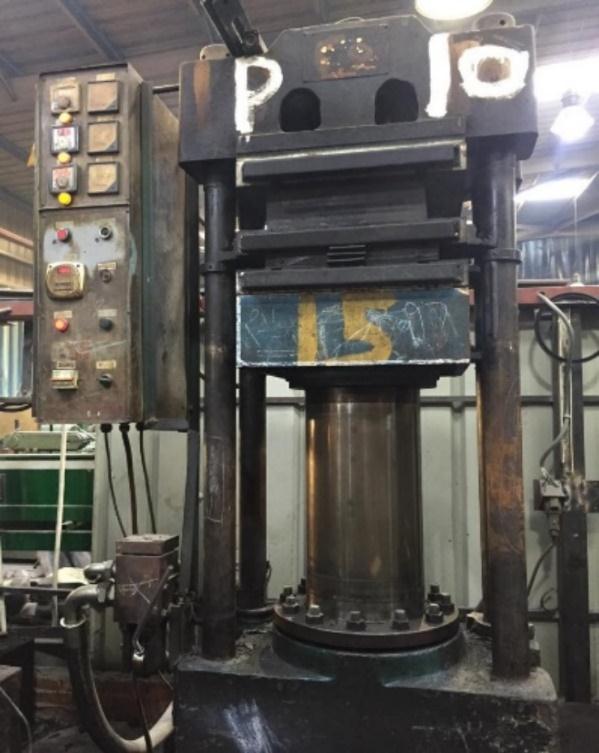
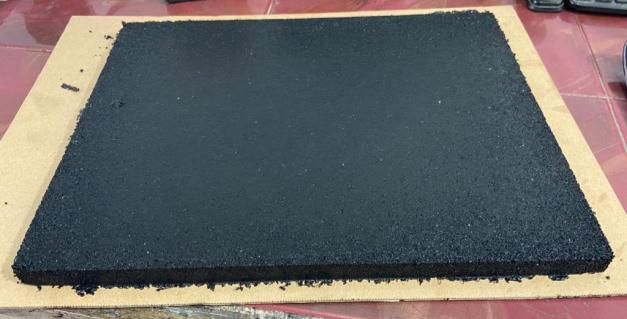
Thepressingprocesswascarriedoutundercontrolled temperatures using a thermostat. The upper plate of the molds was set at a higher rate of temperatures by a difference of about 20 degrees Celsius (°C), in order to compensateforthepercentageofheatlosstransmittedfrom theuppersurfacetothemixture,whiletheappliedpressure was 100 bar in a hydraulic press that shown in Figure 3, accordingtothecompositionofthedifferentmixtures,thisis explained later Figure 4 showsrubbersheet after drying out.
Inall mechanical properties,GALDABINI QUASAR 600 testing machine was used, it has self calibration, zero adjusting, and automatic balancing. After removing the
International Research Journal of Engineering and Technology (IRJET) e ISSN: 2395 0056
Volume: 09 Issue: 06 | Jun 2022 www.irjet.net p ISSN: 2395 0072
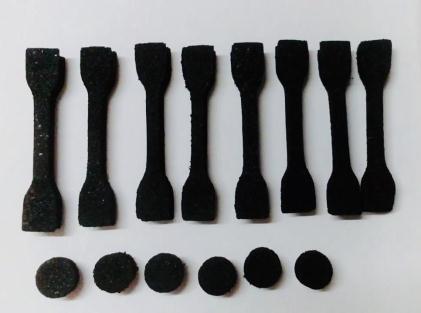
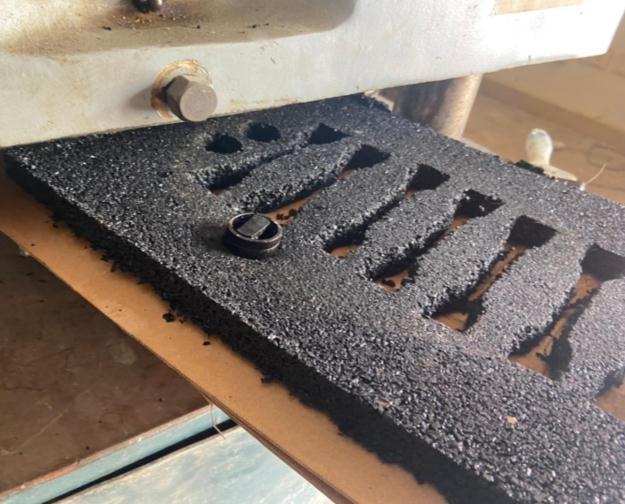
rubber resinsheetfromthehotmold,atensiletestwasdone accordingtoASTMD412[14], Theproduced sheets were cut using a dog bone shaped die to cut out the required dumbbell samples. Figure 5 shows some of the dumbbell samplesduringcutting
AccordingtoASTMD2240[16],adurometershoreAwas usedtoevaluatethehardnessofrubbersamples.
AccordingtoASTMD573[17],ageingwascarriedoutfor threesamplesthatwerekeptfor170hours,whichisinreal time 3 months at 70 degrees Celsius (°C) as an aging deteriorationtestinanAirOven.
All test specimens were conditioned at 23 degrees Celsius (°C), with a humidity of 50 percent (%), and the needed calibrations, as well as balancing of the all used machineswerealwaysdone.
The pressing and testing of rubber samples were conductedforthreeseparateattempts,ineachattemptsome changes were madeinthe ratiosof the factors mentioned earlier,namely:theproportionsofsizesofrubberparticles used,percentageofresin,exposureoftheresintomoisture, temperature,andpressingtime.
A compression test was conducted according to ASTM 575[15]whichwasdoneonsomeconditionssuchascontact load 1N, contact speed 5 mm/min, and test speed 12 mm/min.
Thetestswereconductedonrubbersamples,andthere werefivefactorsaffectingthetextureoftherubbertile,that are: the proportions of sizes of rubber particles used, the percentage of resin, exposure of the resin to moisture, temperature,andpressingtime.
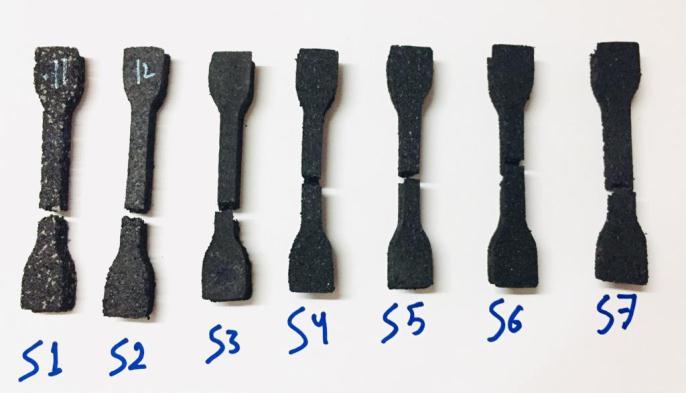
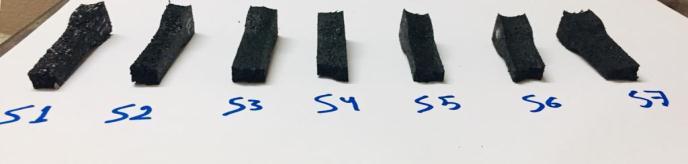
AlltestswereconductedattheNationalResearchCenter inEgypt,documentedwithofficialpapers,andstampedwith thesealoftheaccreditedcenter.GALDABINI QUASAR600 testingmachinewasusedto carryout thetensiletestat a testspeedof50mm/min.Picturesweretakenofallsamples during steps of pressing and testing, and 5 samples were analyzed for each mixture. Figure 6 shows some of the samplesaftercutting.
Inthefirstattempt,themainobjectivewastodetermine the appropriate conditions and ideal factors affecting the pressingprocess,bypressingat200degreesCelsius(°C)for 20 minutes. Also, the ratio of polyurethane resin to the percentageofrubberusedwasidentifiedinvarioussizesof itsgranules,thisisclarifiedintheresultsofthethreesheets in table 1,where2sheetswerecomparedwitheachother byfixingthepercentageofresin,andbetween2sheetsby fixingthepercentagesandsizesofrubberused.
The highest stress in the samples (S1, S2) are approximatelyequalintensilestrength(0.275N/mm2).And asacomparisonbetween(S1,S3),thetensilestrengthin(S1 = 0.2759 N/mm2) is greater than (S3 = 0.1658 N/mm2) which proves that when grain size gets bigger, the tensile strength increases. All of the samples have an elastic behavior, and when they reach the yield strength, the sampleswillbreak.Thesample(S1)hasamaximumvalueof elongation(53.34%=40.5mm)becausethissamplehasa greater percentage of greater size (mesh 10 = 2 mm) and Polyurethaneresin.SothePolyurethaneresindoesnothave aneffectiveinfluenceonthetensilestrengthbutitaffectsthe compressionpropertiesandhardnessasshownintable2. The sample (S2 = 486.8 Kpa) has higher compressive strengththan(S1=246.8Kpa)although(S2)containsless resinthan(S1),thisisduetoexposureofthesesamplesto airandmoisture,andthisexplainstheextentoftheinfluence ofexternal environmental factorsonthepropertiesof the resin.
Figure 6: showssomeofthesamplesaftercutting
International Research Journal of Engineering and Technology (IRJET) e ISSN: 2395 0056
Volume: 09 Issue: 06 | Jun 2022 www.irjet.net p ISSN: 2395 0072
Table 1: Firsttrial(Meanvalues)
Formulation (Samples)
S1
80%mesh 10+20% mesh30+ 7%
Polyurethane resin
Tensile St. (N/mm2) Elongation (%) Compressive St. 25% (Kpa) Hardness (Shore A)
0.2759 53.34 246.2 35 S2 80%mesh 10+20% mesh30+ 3%
Polyurethane resin
Formulation (Samples) Tensile St. (N/mm2)
Elongation (%) Compressive St. 25% (Kpa)
Hardness (Shore A)
S1 100%mesh 5+10% Polyurethane resin 0.2510 28.18 444 41
0.2752 43.595 486.8 45 S3 70%mesh 10+30% mesh30+ 7%
Polyurethane resin
0.1658 29.92 482.6 47
This trial was the start using the new formula of Polyurethane resin VORAMER* MR1101 by Egyptian supplier DOW company, there was a lockage of the informationofthesuitablepressingtemperature,thistrial revealedthatthismaterialdoesnotneedtobecompressed at high temperatures, unlike the formula used in the previousexperiment.
With experience, we concluded that the rubber sheet manufacturing process was carried out under rigorous temperaturecontrolduringpressing,theupperandlower platesofthepress maintainedtemperaturesof150°Cand 130°Crespectively.Sincethelowerplatehasthemoldonit, it has to be set at a higher temperature to guarantee the same130°Conthetopplatesurfaceduetotheheatlossby themoldthickness.Thus,thematerialattheendisbetween twosurfacesatthesame130°C
Preliminary compatibility studies on bindings and rubbers are required. This was achieved by the tests that showed the following; there is no noticeable change or differenceinthehardnessandcompressiontestsresults,but worth noting are the results of the massive change in the tensile tests These notes can be used as guide during the nexttrailwhichisshowninTable2.
S2 70%mesh 10+30% mesh30+ 10% Polyurethane resin 20min pressing time 160°C
S3 70%mesh 10+30% mesh30 10%+ Polyurethane resin
Waiting1hr
0.341 52.47 256.3 47
0.4331 93.74 257 44
Inthethirdtrial,themaingoalwastoreachsatisfactory andcompetitiveresultsbybringingsamplesfromdifferent companiesandconductingtestsonthem. Figure 6 shows7 samplesafterthetensiletestandthefracture.Resultswere verysatisfactoryasshownin table 3
International Research Journal of Engineering and Technology (IRJET) e ISSN: 2395 0056
Volume: 09 Issue: 06 | Jun 2022 www.irjet.net p ISSN: 2395 0072
Formulation (Samples)
S1 German companysample frommarket
Tensile St. (N/mm2) Tensile after aging
Elongati on (%) Elongati on after aging
Compressi ve St. 25% (Kpa) Hardness (Shore A)
Chart 2 shows the results of the stress strain curve before aging test. This show the highest value of tensile strength in sample (S6=2.01MPa) followed by (S5=1.998MPa), and (S4=1.917MPa), this indicates that theseformationsusethelargestamountofrubbergranules oflargesize,asthegrainsizeincreases,thetensilestrength increases
0.8978 0.826 89.47 71.638 839 56
0.9026 0.6851 87.14 64.303 598 63 S2 Hoppec companyfor rubber industriesfrom market
S3
70%mesh10+ 30%mesh30+ 7%
Polyurethane resin 15minpressing time
1.897 1.779 130.435 127.025 1245 67 S4 70%mesh10+ 30%mesh30+ 7% Polyurethane resin 10minpressing time
1.917 1.845 125.4 114.575 1200 65 S5 70%mesh10+ 30%mesh30+ 10% Polyurethane resin 15minpressing time
S6 80%mesh10+ 20%mesh30+ 7% Polyurethane resin 10minpressing time
S7 60%mesh10+ 20%mesh5+ 20%mesh30+ 7% polyurethane resin 10minpressing time
1.998 2.065 131.775 128.85 1174.5 62
The tests of accelerated aging were developed with modified testingconditions insucha waythataffected by temperature and moisture over time. Chart 3 shows the results of the stress strain curve after aging test. These resultsshowthedifferencebetweenvaluesbeforeandafter the aging test, we concluded that after using 3 months of real time,thevaluesofmechanicalpropertiesdecreasedas in(S6),whichwas2.01MPa,andbecame1.607MPaandthis is the largest deviation of all samples. The test results indicatethatthereisnomassivefailuredespiteexposureto various environmental factors which support the idea of usingmultipleapplications.
2.01 1.607 126.263 118.3 1311.5 64
1.605 1.552 118.475 108.965 1184.5 65
STRESS (MPa) STRAIN (%)
0 0.5 1 1.5 2 2.5 0 50 100 150
S1 S2 S3 S4 S5 S6 S7
In Chart 4,themaximumelongationisin(S5),whichis 131.775 %, this means that the length of the sample has increasedbymorethantwiceitsoriginallengthby31.775 %. The composition of the sample is moderate and the proportion of small sized granules used here is large compared to the rest of the mixtures, which is 30% it
International Research Journal of Engineering and Technology (IRJET) e ISSN: 2395 0056
Volume: 09 Issue: 06 | Jun 2022 www.irjet.net p ISSN: 2395 0072
containsapercentagethatisnotthelargestintermsofthe sizeoftherubbergranules.Thiscouldhelptoimprovethe connectionbetweentherubberandthepolyurethaneresin due to its small size. resulting in a combination with improved elongation characteristics S5, S3, and S6 formulationsarestifferingeneralthanothersbecausethey have bigger granulomere, and regardless of the resin concentration,thepresenceoflargertirerubbergrainshasa greater effect on the stiffness of the material than polyurethaneresin.
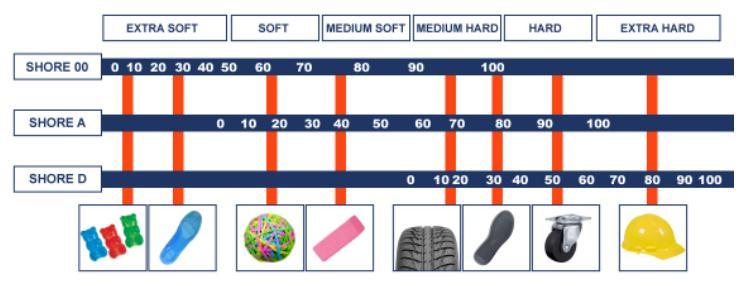
Higher numbers on the scale indicate more indentation resistanceandthushardermaterials.Asaresult,thehigher thematerialhardness,thelesstheconedeformsthesample. Lowernumbersonthedurometerscale,ontheotherhand, imply less resistance to indentation and softer materials; hence,themoretheconedeformsthesample,thelowerthe material's hardness [16]. The higher the durometer, the harderthematerial.Asshownin chart 6,mostofthevalues are between 60 70, this explains that the material is of mediumhardness,asshownin Figure 7
Before aging 87.14 89.47 130.44 125.4 131.78126.26118.48 After aging 127.03114.58128.85 118.3 108.97
CHART Before aging After aging
Chart 5 showstheresultsofthecompressioncurve.This showthehighestvalueofcompressioninthesample(S6= 1311.5Kpa),followedby(S3=1245Kpa)and(S4=1200 Kpa).Thisindicatesthattheseformationsareaffectedby2 factors to increase the values mentioned before, the percentageofpolyurethaneandthentheamountoflargest meshsizes.
AhardnesstestwasconductedusingadurometerShore A. A durometer type A (F = 0.55 + 0.075 HA) is used, a hardenedsteelrodwithabeveledconeatthetipservesas thedurometerinstrument.Agaugewithascaleof1to100is activated by a spring loaded steel rod. Under the beveled cone,thetestsampleispositionedstraight.Theinstrument is then pressed against the material until the elastomer sample is leveled with the flat metal plate at the bottom.
ThisanalysiswascarriedoutaccordingtotheEgyptian pricesinJune2022.
Fixed cost: Fixed cost =(1xhydraulicpress)+(1xrubbermixer)+(2x mainconveyor). (1) Total Fixed cost =(1x100,000)+(1x10,000)+(150,000)+ (3x1,000)=(261,000LE)
Variable cost: A Employee’s cost: (3worker’sx3000)+(1Maintenanceworkerx3500)+(2 engineers x 5000) + (10000 renting cost) = 32500 L.E/month. (2) B Power consumption of the facility in one month: Totalpowerconsumption/month:
International Research Journal of Engineering and Technology (IRJET) e ISSN: 2395 0056
Volume: 09 Issue: 06 | Jun 2022 www.irjet.net p ISSN: 2395 0072
Electricitycost:0,424KW/monthx1.55LE.KW.hr.=(2,850 LE). (3)
C Powder Material using for production line in one month:
Per month, 500 LE/day (meshes) x 6 days x 4 weeks = (12,000LE/month) (4)
D Polyurethane binder and Resin:
PU (Polyurethane)
Perdaywilluse(2.8kgx8hr.x60min)/30min= 44.8KG(9gallonsperday) (5) 9gallons’ x6 days’ x4 weeksx450 LE=(97,200 LE/month).
Resin
Perdaywilluse(0.4kgx8hr.x60min)/30min= 6.4KG(3.2gallonperday) (6) 3.2gallons’x6daysx4weeksx250LE=(19,200 LE/month).
Profit:
Profit = Total revenue per month after taxes Total V.C/Month (11)
Profit=162LE/piecex3,072sheet 424,750LE/month.
Profit=497,664 424,750=72,914LE/Month.
Facility payback period = Fixed Cost/benefits = 261,000/72,914=3.5months (12)
Breakevenpoint=Fixedcost/(revenueperunit variable costperunit). (13)
Breakeven point = 261,000 / (400 {191+46}) = 1,601 quantity.
Chart 7 showstheunitsalesbreakevenanalysis.
Total variable cost:
V.C=32,500+2,850+12,000+97,200+19,200=163,750 LE/month. (7)
Total cost:
T.Cost=TotalFixedCost+TotalVariableCost (8) T.Cost=261,000LE+163,750LE=424,750LE
Variable Unit Cost per piece:
MeshesMaterial:(3kgx2600)/1000=7.8LE.
7%PUwhichis0.350kg:(0.350x450)/5=31.5LE.
50gramsofresinpermoldcavity:(0.050x250)/2=6.25LE
Electricityusedduringproductionperpiece:9.5Kw/hr. x 1.55LE=15LE
(Rentingcost/totalworkinghour):(10,000/8hours’x26 days)=50LE/hr.
Totalcostperpiece=7.8+31.5+6.25+15+15+17+24+24+50 =191LE/hr. (9)
Accordingtopriceofpieceis400LEtherefore,400LE 191 LE=209LE
Chart 7: Unitsalesbreakevenanalysis
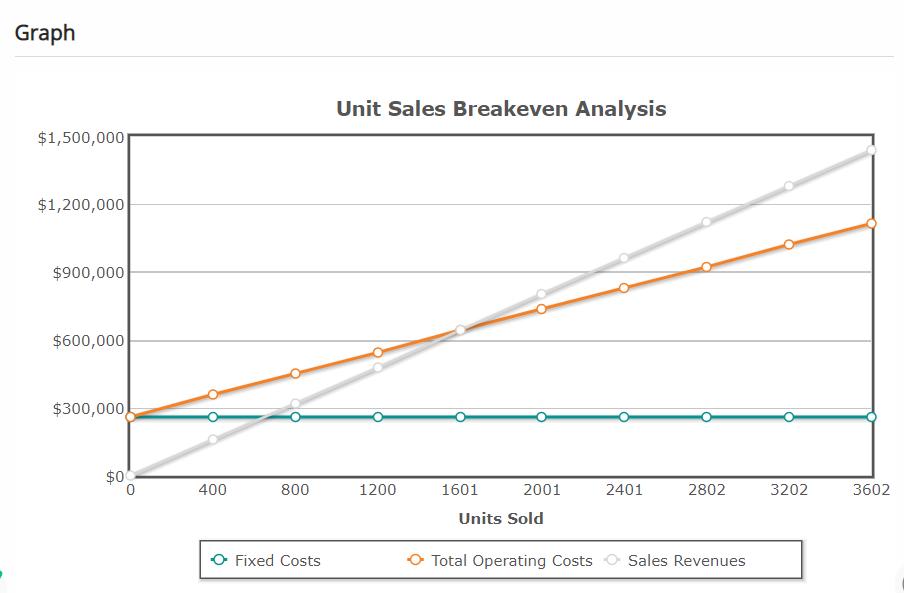
Total revenue per unit after taxes = 209x(100% 22.5%) =162LE. (10) Benefits
Tosumup,theresultsachievedthemaintargetofthis research which is the amount of rubber used is too large comparedtotheresin.Thatdecreasesthenumberofwaste tires that led to solve the global environmental problem. Different particle size distributions, rubber contents, and tests were used by doing three trials to enhance the mechanicalpropertiesoftherubbertilewerecarriedout In thefirstandsecondtrials,themaingoalwastodetermine the optimum influencing factors for pressing in terms of temperatureandtime.Inthethirdtrial,resultsofthetensile strength were really good and this supports ability of the material to resist tearing due to tension. Compressive strength can also withstandloadstending to reduce size. Hardness values are enough to fare when it comes to
© 2022, IRJET | Impact Factor value: 7.529 | ISO 9001:2008 Certified Journal | Page1313
International Research Journal of Engineering and Technology (IRJET) e ISSN: 2395 0056
Volume: 09 Issue: 06 | Jun 2022 www.irjet.net p ISSN: 2395 0072
indentation.Agingtestshaveakeyroleindeterminingthe life time under the influence of various environmental factors.Allthesegoodmechanicalpropertiesvalueshelpthe producttobeabletobeusedindifferentapplications
[0] B.S.Thomas,R.C.Gupta,V.JohnPanicker,Experimental andmodelingstudiesonhighstrengthconcretecontaining wastetirerubber,Sustain.CitiesSoc.19(2015).
[2] M. Sienkiewicz, J. Kucinska Lipka, H. Janik, A. Balas, ProgressinusedtiresmanagementintheEuropeanUnion:a review,WasteManag.32(10)(2012)
3] ] Goldstein Research, Global Tire Recycling Market Analysis2025:Opportunity,Demand,GrowthAndForecast 2017 2025,2021edition,(2021).
[4] N.Antoniou,G.Stavropoulos,A.Zabaniotou,Activation ofendoflifetirespyrolyticcharforenhancingtheviability of pyrolysis a critical review, analysis, and recommendationsforahybriddualsystem,Renew.Sustain. Energy Rev. 39 (2014) 1053 1073, https://doi.org/10.1016/j.rser.2014.07.143.
[5] P.J.H.vanBeukering,M.A.Janssen,Tradeandrecycling of used tires in Western and Eastern Europe, Resource. Conserve. Recycled. 33 (4) (2001) 235 265, https://doi.org/10.1016/S0921 3449(01)00082 9.
[6] Paulina Kosmela, Adam Olszewski, Aleksander Hejna, and Łukasz Zedler, Development of technology for the manufacturingoffoamedpolyurethane rubbercomposites for the use as damping materials, January (2021) Materials14(3):499DOI:10.3390/ma14030499
[7] K. Ahmed, S. Nizami, and N.Z. Riza, Reinforcement of natural rubber hybrid composites based marble sludge/Silicaandsludge/ricehuskderivedsilica,J.Adv.Res. 5 (2) (2014) 165 173, https://doi.org/10.1016/j.jare.2013.01.008.
[4] Chan Wen Shan,Maizlinda Izwana Idris, and Mohd Imran Ghazali, Improved Vibration Characteristics of Flexible Polyurethane Foam via Composite Formation,7(1):1031 1042. (2013), DOI:10.15282/ijame.7.2012.19.0084
[9] Shahruddin Mahzan, I. Maznan, Mohd Imran Ghazali, and S Kanna Subramaniyan, Mechanical Behavior of Polyurethane Composite Foams from Kenaf Fiber and Recycled Tire Rubber Particles. 315:861 866 (2013), DOI:10.4028/www.scientific.net/AMM.315.861
[01] DiegoOrlando,DaniellaMulinari,NycolleG.S.Silva,and Lucas I.C.O. Cortat, Evaluation of rubber powder waste as
reinforcementofthepolyurethanederivedfromcastoroil, 116:131 139(2020),DOI:10.1016/j.wasman.2020.07.032.
[00] Xin Xiao, Jiayu Wang, DegouCai, LiangweiLou, and FeipengXiao, A novel application of thermoplastic polyurethane/waste rubber powder blend for waterproof seallayerinhigh speedrailway,Volume27,March(2021), 100503,https://doi.org/10.1016/j.trgeo.2020.100503
[02] Egyptindustrialproduction:tires,(2016).
[13] Eduard Cousin, Rubber a hot commodity for Egypt start upRetires,(2016).
[14] D412,StandardTestMethodsforVulcanizedRubber and Thermoplastic Elastomers Tension, ASTM International,WestConshohocken,PA19428 2959,United States,(2009).
[15] D575,StandardTestMethodsforRubberPropertiesin Compression,ASTMInternational,WestConshohocken,PA 19428 2959,UnitedStates,(2001).
[16] D2240,StandardTestMethodforRubberProperties Durometer Hardness, ASTM International, West Conshohocken,PA19428 2959,UnitedStates.
[17] D 573, Standard Test Methods for Rubber Deterioration in an Air Oven, ASTM International, West Conshohocken,PA19428 2959,UnitedStates,(2004).