International Research Journal of Engineering and Technology (IRJET) e-ISSN: 2395-0056 Volume: 09 Issue: 06 | June 2022 www.irjet.net p-ISSN: 2395-0072

International Research Journal of Engineering and Technology (IRJET) e-ISSN: 2395-0056 Volume: 09 Issue: 06 | June 2022 www.irjet.net p-ISSN: 2395-0072
S.Keerthana1, K.Sathishkumar2, K.sedhu3, N.Soundirarajan4, R.Vignesh5
Department of Electronics and Communication Engineering, V.S.B. Engineering College, Karur, India
Abstract— This paper focuses on oil reheating analysis using multispectral images. The quality of food consumed has a considerable influence on the health of a society. A machine learning method and a multispectral image are used to forecast the reheating of oil state. Then, a new strategy for creating a spectral clustering based classifier to determine the impact of warming and reusing coconut oil is provided. Varied clusters were discovered for different quantities of reheated oil classes on training samples, and classification was accomplished with an accuracy of 0.983. In addition, the input images for the recommended algorithms are made with an in house application.
Keywords Oil Reheating, Multispectral Picture, Oil Condition, Input Photos
Coconut (Cocos nucifera) is a versatile palm tree with multipleapplications.Thefibrousone seededdrupeisused to make coconut water, coconut milk, dried coconut, and coconutoil.Coconutoilhasbeenused inavarietyofways, including as a cooking or frying oil, as a component in a range of foods, in the creation of skincare products,andin the manufacture of pharmaceuticals. Due to its reduced manufacturing cost, palm oil, which has similar physical properties to coconut oil, is widely used to adulterate coconut oil [1]. Furthermore, foodservice establishments and families routinely reuse frying oil to save money. As a result, the chemical and thermophysical properties of edible oils are changed during reuse, jeopardizing their safety and rendering fried foods unfit for consumption. A multispectral imaging system was created using nine spectral bands with peak wavelengths ranging from 405 nm to 950 nm. A method was created using Principal ComponentAnalysis(PCA)andBhattacharyyaDistance.
This paper is further arranged as follows. Section II gives the multispectral imaging spectrum. Section III explains about the deep learning. Section IV explain the related works. Section V represents the proposed methodology. Experimental results are given in Section VI andSectionVIIconcludesthepaper.
The bulk of multispectral imaging research reported in the literature rely on the reflective properties of opaque materials.Thisstrategy,however,isonlylooselyrelevantto most liquids since only a tiny proportion of light is reflected. To examine the transmittance spectrum of liquids, a low cost multispectral imaging device was developed [2]. This imaging system can capture monochromemultispectralimagesfromultraviolet(UV)to near infrared(NIR)withanoverallresolutionof9spectral bands (NIR). The LEDs that were used in this project are thoroughlydetailed.Theimagingsystemusedinthiswork has a number of key components. A 10 bit CMOS monochrome camera (FLIR Blackfly S Mono,1.3 MP, USB3 Vision camera, Resolution 12801024) was put on top of the portable dark chamber to capture the transmittance spectrumofasample.
This camera can capture images in the 350 to 1080 nanometerspectralrange.Alaptopwasusedtocapturethe image and send commands to both the discovery board (STM32F0DISCOVERY) and the monochrome camera (MSI GE626QD). In the portable dark room, an LED switching circuit made up of nine off the shelf LEDs was fitted. An integrating hemisphere made of aluminum with a 130mm innerdiameterwasusedtoofferbetterilluminationforthe sample.AlocallymanufacturedACregulated12VDCpower supplyunitwasusedtogivestablepowerinputtotheLED driverICs(MAX16839ASA+).InfrontoftheLEDswitching circuit,thecamerawaspositioned.
Thecamera wascalibratedproperlytogeneratea well focused image, and the aperture was adjusted to avoid saturated pixels in the image. Two USB connections were used to link the camera and the discovery board to the laptop computer. In a cylindrical container, the liquid sample was kept. PVC tubing was used for the container's walls,while2mmplainglasswasusedforthebase.
Deep learning, sometimes called deep structured learningorhierarchicallearning,whichisatypeofmachine learning that learns from data rather than task specific algorithms. The three types of learning are unsupervised, semi supervised, and supervised. In recent years, academics have been particularly interested in employing
International Research Journal of Engineering and Technology (IRJET) e-ISSN: 2395-0056
Volume: 09 Issue: 06 | June 2022 www.irjet.net p-ISSN: 2395-0072
image processing as well ascomputer vision techniques thatdetectfireinphotos.Iftheyareaccurateenough,such systems may even surpass ordinary fire detection technologies.
One of the most promising techniques in this sector is convolutional neural networks (CNNs). Previous fire detectionresearchemployingCNNs,ontheotherhand,has only focused at balanced datasets, which might give erroneous information about real world performance in locations where fire is infrequent. In fact, as this study shows, a typical CNN performs poorly when evaluated on the more realistically balanced benchmark dataset providedinthisstudy.Asaresult,forimagefiredetection, werecommendutilizingevendeeperConvolutionalNeural Networks,withfinetuningbasedonafullyconnectedlayer. VGG16andResnet50,twopre trainedstate of the artDeep CNNs, are used in our fire detection system. On an imbalanced dataset that we built to imitate real world situations, the Deep CNNs are put to the test. It includes shots that are extremely difficult to describe, as well as images that are purposely unbalanced, with many more non fireimagesthanfireimages.
Addingcompletelyconnectedlayersforfinetuning enhances accuracy while dramatically increasing training time, according to our findings. It may be used to train artificial intelligence to anticipate outcomes consist of a collection of inputs. To train the AI, both supervised and unsupervisedlearningmethodologiescanbeapplied.We'll investigate deep learning by building a fictitious airline ticket price estimator service. Because models may adjust autonomously as they are exposed to fresh data, the iterative feature of machine learning is critical. Convolutionalneuralnetworks(CNNs,orConvNets) atype of deep neural network used to analyze images. Individual corticalneuronsthatonlyrespondtostimulithatfallinside the receptive field, which is a small portion of the visual field.
A strategy for distinguishing and quantifying refined, bleached, and deodorized (RBD) pure coconut oil (PCO) from 26 its adulterant RBD fried coconut oil was devised usingattenuatedtotalreflection Fouriertransforminfrared (ATR FTIR) spectroscopy and 24 multivariate regression modeling(FCO).Thisstudy[1]willaidtheoilindustryand regulatory agencies since it gives essential information 37 for building standard methodologies for detecting oil adulteration.
A multispectral imaging method for determining the proportion of tartrazine colored rice flour in turmeric powder, a typical adulterant. Nine spectral bands having peakwavelengthsrangingbetween405nmto950nmwere used to develop a multispectral imaging system. Principal Component Analysis (PCA) and Bhattacharyya Distance
were used to develop a technique. A second order polynomial was used to model the link between the BhattacharyyaDistanceandtheextentofadulteration.[2]
To measure smoke point, oxidative stability, free fatty acids, polar compounds, fatty acid profiles, and UV coefficients, extra virgin olive oil (EVOO) and other common cooking oils were heated to 240°F and then subjected to 180°F for 6 hours, with samples collected at different intervals. In contrast to oils like canola oil, which produce significant amounts of by products, EVOO produced very few polar molecules and oxidative by products.[3]
The concentration of sarcoplasmatic and myofibrillar proteinsinboilingporkwasexaminedusinghyperspectral imaging techniques. To enhance partial least squares regression (PLSR) models, a number of spectral pre processingapproacheswereused.ThebestPLSRmodelfor predicting sarcoplasmatic protein amounts was constructed using seven optimum wavelengths 19 in the 400 2000 nm range without any spectral pre processing. [4]
In their [5] study, researchers used chemometrics and hyperspectralmicroscopeimage(HMI)technologytotryto replicate a human panel test for determining matcha sensory quality. The HMI system's hypercubes displayed geographic and spectral information on sample quality. Models were created using spectral data and sensory ratings from a human panel. The characteristic spectra from all of the pixels in the optimized regions of interest were then averaged. Using competitive adaptive reweighted sampling, the key spectral variables were then chosen and used to build artificial neural network models (specifically,CARS ANNmodels).
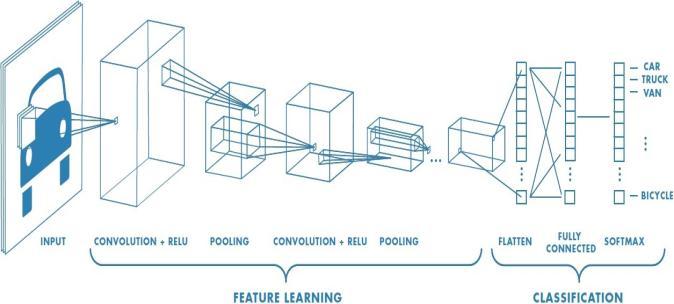
We present two analytical approaches for oil reheating inthesuggestedstudy,whichaddstomultispectralimaging underthefoodimageanalysisresearch.It'sfordetermining the reheat level and reheat system status. It's for two reasons: one, to calculate the reheat level count class, and second, to identify major oil chemical property changes. Machinelearningtechniqueisappliedforcategorizationof food quality condition. A novel application for MISs was provided to estimate reheat cycle count class and discriminationofsubstantialvariationsinthechemicaland thermophysical parameters during repetitive heating for frying oil. For high accuracy prediction, a convolution neural network scheme based method is used. The block diagramoftheproposedmethodisgiveninFig.1.
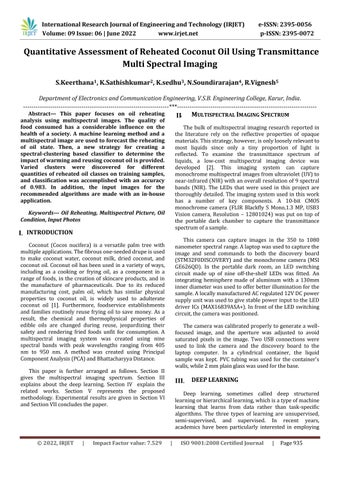
The structure of CNN is given in Fig.2. It is a well-
known machine learning approach. One of the reasons for itspopularityisthatitusesautomatedhierarchicalfeature representationtorecognizeobjectsandpatternsinimages. CNNs make advantage of spatial links to reduce the parametersofaproblem.Thismakesthemamorepractical classifier, especially in image processing, where there are several parameters(pixels),rotation,translation,andscale toconsider.Inactuality,CNNsavoidthedrawbacksofFeel Forward Neural Networks and Multi Layer Perceptons by usinganalternativetomatrixmultiplication.Weapplythis powerfulmethodinthisstudybecauseofthenatureofOCT ImageClassificationusingDeepLearning.
architecture is a certain arrangement of the aforementionedlayers.
Preprocessingistheprocessofconvertingrawdatainto a format that is more appropriate for future analysis and user comprehension. When it comes to EEG data, preprocessingentailsreducingnoisefromthedatainorder togetclosertothegenuinebrainsignals.
CancerNetwillbethenameofthenetworkwe’llcreate, which will be a CNN (Convolutional Neural Network). The following operations are carried out by this network: 3 CONVfiltersshouldbeused.Thesefiltersshouldbestacked on top of each other. Max pooling should be done. Use separable convolution by depth (more efficient, takes up less memory) It has input layers, convolution layers, ReLu layer, and maxpooling layers for extracting features from buildmodelphotos.ExtractionoffeaturesThemodelmust firstbetrainedbeforeitcanbebuilt.
We can split the model using a test set of 30% of the original data set because this function is implemented. D (seethecodeaboveX_trainshape)istheinputthatsimply specifies the size of the input. Instead, the main work is doneinthedenselayer,whichtakestheinputandperforms a linear transformation to produce an output of size one. Thesigmoidactivationfunctionisthelineartransformation wewishtouse,resultingina rangeof0to1intheoutput. The module Accuracy and sensitivity of the studied in this system incorporates loss per iteration, training loss, and validatingloss.
BeforegettingintoAlexNet,it'svitaltounderstand what a convolutional neural network is. Convolutional neural networks have hidden layers that include convolutional layers, pooling layers,fullyconnectedlayers, and normalizing layers. Convolution is the technique of addingafiltertoanimageorsignaltochangeit.So,whatis pooling, exactly? It's a sample based discretization approach. The main purpose is to reduce the dimensionality of the input. As a consequence, hypotheses about the properties of the binned sub regions may be established. This is explained in further detail in Understanding Neural Networks. CNN Architecture is a multi layer stack that converts input volume to output volume using a differentiable function. (For example, keepingtrackofclassgrades)Toputitanotherway,aCNN
This dataset contains pictures from a transmittance multispectralimagingsystembuiltin housethatwereused inastudytoassessthequalityofcoconutoil.
The multispectral picture generated from the imaging equipmentwascroppedintoa30x30window.Theclipped picturewasreshapedintoa900x10matrix.Apixelinthe croppedpicturecorrespondstoeachrowinthematrix.The first nine columns of the matrix indicate the imaging system’sninespectralbands.Thelabeloftheincludedclass is represented in the tenth column. Each entry’s value can beanythingbetween0and255.
Thisdatasetcontainsphotosofcoconutoilthathasbeen taintedwithpalmoil.Thereareninestagesofadulteration
Volume: 09 Issue: 06 | June 2022 www.irjet.net p-ISSN: 2395-0072
in the dataset. Class 1 refers to a level of 0% adulteration. Eachclassincreasestheamountofadulterationby5%until class9 indicates a 40% level of adulteration. There are 15 duplicates in each class. As a result, the dataset has a total of1599900=121500rows.

Thisdatasetcontainsphotosofcoconutoilthathasbeen tainted by warmed and reused coconut oil. There are nine stagesofadulterationinthedataset.Class1referstoalevel of 0% adulteration. Each class increases the amount of adulteration by 5% until class9 indicates a 40% level of adulteration. There are 15 duplicates in each class. As a result,thedatasethasatotalof1599900=121500rows.

Thisdataset containsphotos ofthecoconut oilafter it has been warmed and reused multiple times (days). The datasetisdividedintosixgroups,eachcorrespondingtoa different number of days reheated, ranging from 0 to 5. There are nine duplicates in each class. As a result, the datasethas966900=48600rows.
Fig. 4. InputImage
This multispectral imaging system was created using 9 wavelengthsintheelectromagneticspectrum,rangingfrom ultraviolet (UV) to near infrared (NIR). The multispectral imagingsystem isgiveninFig.3.Thesystemismade upof five parts, as illustrated in the diagram. A monochrome camera(FLIRBlackflySMono,1.3MP,USB3Visioncamera, resolution 1280 x 1024, ADC 10 bit), a monochrome camera(FLIRBlackflySMono,1.3MP,USB3Visioncamera, resolution 1280x1024,ADC 10bit),adiscoveryboard (STM32F0). The LED driver ICs (MAX16839ASA+) were usedtocontroltheemissionintensitiesofalltheLEDstoa near constantlevel.Thesimulationresultsoftheproposed systemisgiveninFig4toFig7.
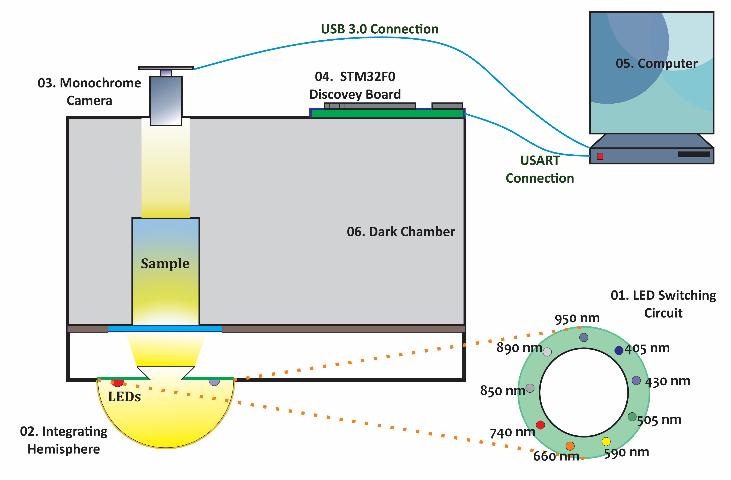

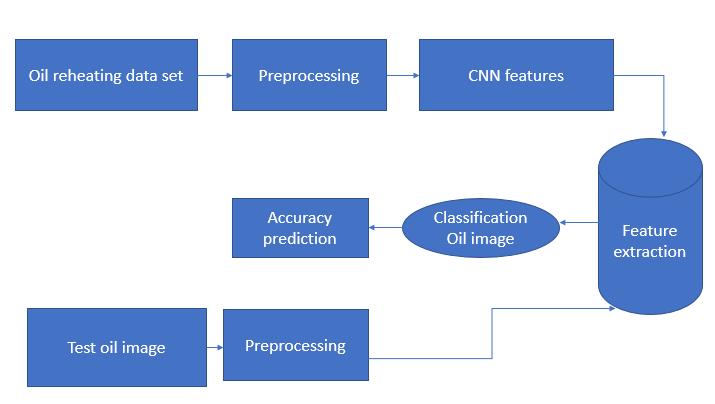
Fig. 5. Convolutionlayer
Fig. 6. FivetimesReheated
International Research Journal of Engineering and Technology (IRJET) e-ISSN: 2395-0056
Volume: 09 Issue: 06 | June 2022 www.irjet.net p-ISSN: 2395-0072
life of bakery products through hyperspectral imaging,” IEEEAccess,vol.8,pp.176986 176996,2020.
[5]H.Weerasooriya,H.Lakmal,D.Ranasinghe,W.Bandara, H. Herath, G. Godaliyadda, M. Ekanayake, and T. Madujith, “Transmittancemultispectralimagingforedibleoilquality assessment,” in 3D Image Acquisition and Display: Technology,PerceptionandApplications.OpticalSocietyof America,2020,pp.JW5C 8.
[6] C.N. Nguyen, Q.T. Phan, N.T. Tran, M. Fukuzawa, P.L. Nguyen, and C.N. Nguyen, “Precise sweetness grading of mangoes (mangifera indical.) based on random forest technique with low cost multispectral sensors,” IEEE Access,vol.8,pp.212371 212382,2020.
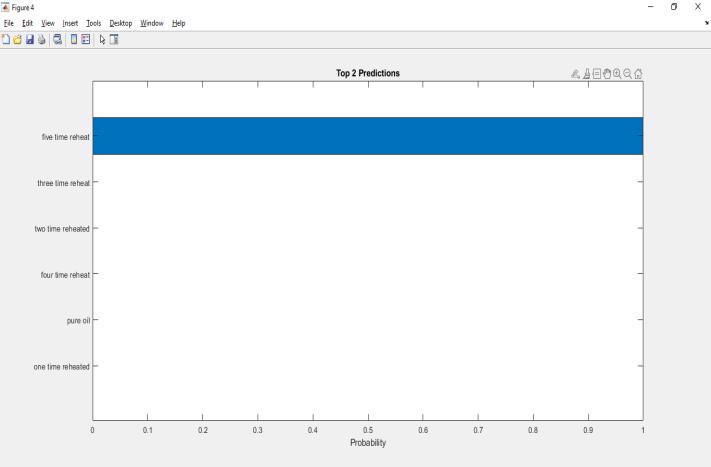
Fig. 7. Simulationresultoftheproposedmethod
This paper gives two novel multi stage signal processing approaches for evaluating the level of palm oil adulterationinactualcoconutoil,aswellasamethodology fordetectingthenumberoftimesacoconutoilsamplehas been cooked. The algorithms were developed for multispectral images taken from an in house constructed transmittance based multispectral imaging equipment. Although the classification approach showed high accuracies, the adulteration level estimation method had outstanding curve fitting (R2 = 0.9876). (mode accuracy 0.90).Inaddition,theproposedproceduresweretestedon distinct samples with varying degrees of adulteration and reheating times. Even though evidenced the low mean square error0.0029 for adulteration level determination, 0.7616 error metric for six class classification, and 0.983 errormetricforqualitativeclassificationoffrequentlyused oil, the proposed solution could be easily modified or extendedtohandleanewclassofadulterantsandahigher numberofheatingcycles
[1] A.Palananda and W.Kimpan,“Turbidityofcoconutoil determination using the mamoh method in image processing,”IEEEAccess,vol.9,pp.41494 41505,2021.
[2] J. Chen,F.Liu,Z.Li,L. Tan,M.Zhang,andD.Xu, “Solid phaseextractionbasedmicrofluidicchipcoupledwithmass spectrometry for rapid determination of aflatoxins in peanut oil,” Microchemical Journal, vol. 167, p. 106298, 2021.
[3] D. Khamsopha, S. Woranitta, and S. Teerachaichayut, “Utilizing near infrared hyperspectral imaging for quantitatively predicting adulteration in tapioca starch,” FoodControl,vol.123,p.107781,2021.
[4] Z. Saleem, M. H. Khan, M. Ahmad, A. Sohaib, H. Ayaz, andM.Mazzara,“Predictionofmicrobialspoilageandshelf
[7] Á. Hernáez, M. T. Soria Florido, H. Schröder, E. Ros, X. Pintó, R. Estruch, J. Salas Salvadó, D. Corella, F. Arós, L. Serra Majem et al., “Role of hdl function and ldl atherogenicity on cardiovascular risk: a comprehensive examination,”PLoSOne,vol.14,no.6,p.e0218533,2019.
[8]G.Prabhath,W.Bandara,D.Dissanayake,H.Hearath,G. Godaliyadda, M. Ekanayake, S. Demini, and T. Madhujith, “Multispectral imaging for detection of adulterants in turmericpowder,”inHyperspectralImagingandSounding of the Environment. Optical Society of America, 2019, pp. HTu3B 3.
[9]C.Guillaume,F.DeAlzaa,andL.Ravetti,“Evaluation of chemicalandphysicalchangesindifferentcommercialoils during heating,” Acta Scientific Nutritional Health, vol. 2, no.6,pp.2 11,2018.
[10] M. Li, M. Huang, Q. Zhu, M. Zhang, Y. Guo, and J. Qin, “Pickledanddriedmustard foreignmatterdetectionusing multispectral imaging system based on single shot method,” Journal of Food Engineering, vol. 285, p.110106, 2020.
[11] K. Lim, K. Pan, Z. Yu, and R. H. Xiao, “Pattern recognition based on machine learning identifies oil adulteration and edible oil mixtures,” Nature communications,vol.11,no.1,pp.1 10,2020
[12] S. Popa, M. S. Milea, S. Boran, S. V. Nit,u, G. E. Mos, oarca, C. Vancea, and ˘ R. I. Lazau, “Rapid adulteration detection of cold pressed oils with their ˘ refined versions by uv vis spectroscopy,” Scientific reports, vol. 10, no. 1, pp.1 9,2020.
[13]T.Prioleau,E.Moore,andM.Ghovanloo,“Unobtrusive and wearable systems for automatic dietary monitoring,” IEEE Transactions on Biomedical Engineering, vol. 64, no. 9,pp.2075 2089,2017.
[14] R. Jamwal, S. Kumari, A. S. Dhaulaniya, B. Balan, S. Kelly, A. Cannavan, D. K. Singh et al., “Utilizing atr ftir spectroscopy combined with multivariate chemometric
International Research Journal of Engineering and Technology (IRJET) e-ISSN: 2395-0056
Volume: 09 Issue: 06 | June 2022 www.irjet.net p-ISSN: 2395-0072
modelling for the swift detection of mustard oil adulteration in virgin coconut oil,” Vibrational Spectroscopy,vol.109,p.103066,2020.
[15]V.B.RajuandE.Sazonov,“Detectionofoil containing dressingonsaladleavesusingmultispectralimaging,”IEEE Access,vol.8,pp.86196 86206,2020.