International Research Journal of Engineering and Technology (IRJET) e ISSN: 2395 0056
Volume: 09 Issue: 06 | Jun 2022 www.irjet.net p ISSN: 2395 0072
International Research Journal of Engineering and Technology (IRJET) e ISSN: 2395 0056
Volume: 09 Issue: 06 | Jun 2022 www.irjet.net p ISSN: 2395 0072
1Department of Computer Science and Engineering, Bangladesh Army University of Engineering & Technology (BAUET), Natore 6431, Bangladesh 2Department of Information and Communication Engineering, University of Rajshahi, Rajshahi 6205, Bangladesh ***
Abstract Stock trading is the vital activities which is nonlinear in the real world and analysis on the stock market the crucial aspects of the financial world. Prediction of the financial values of the stock market based on the stock market data is an act that tries to evaluate the future financial value. The stock market is one of the large business platforms where people invest based on some prediction. To avoid investment risk people search for the best algorithms and tools which will increase their profits. The traditional basic methods and technical research may not confirm the effectiveness of the prophecy. This can be done by machine learning algorithms. Therefore, the paper explains the prediction of a stock market using machine learning approaches and shows a comparison among the approaches. In this paper, we identify an efficient approach for predicting future stock market performances. The successful prediction of the stock market will have a very positive consequence on the stock market institutions and the investors also. The paper focuses on applying machine learning algorithms like Linear Regression, Random Forest, Decision Tree, K Nearest Neighbor (KNN), Logistic Regression, Linear Discriminant Analysis, XG Boost Classifier, Gaussian Naive Bayes on three types of datasets including Combine news, Reddit News, 8 years value of the stock market. We evaluate the algorithms by finding performance metrics like accuracy, recall, precision and fscore. The results suggest that the performance of Linear Discriminant Analysis (LDA) can be predicted better than the other machine learning techniques.
Key Words: K NearestNeighbour;LinearRegression;Linear Discriminant Analysis; Machine Learning; Stock Market; RandomForest;XGBoostClassifier.
Thestockmarkethasavitalimportanceintherapidgrowing economic country. The stock market includes various customersanddealersofinventory.Thecountrygrowthare highlyrelatedwiththestockmarkethence,thereisalinear relation between them [1]. The fundamental approach analyzesstocksthatinvestorsperformbeforeinvestingina stockwheretheinvestorslookattheintrinsicvalueofstocks and performance of the industry, economy, etc. to decide whethertoinvestornot.Ratherthanthetechnicalanalysis evaluate stocks by studying the statistics generated by
market activity like past prices. Stock market prediction method figuring out the destiny scope of marketplace. A systemiscriticaltobebuiltwhichcouldworkwiththemost accuracyanditshouldtakeintoaccountallcrucialelements thatwouldaffecttheresult.Sometimesthemarketplacedoes nicelyeveniftheeconomicsystemisfailingduetothefact therearenumerousmotivesfortheincomeorlackofashare [2]. Predicting the overall performance of an inventory marketplaceisdifficultbecauseittakesintoconsideration numerous elements. The aim is to discover the feelings of investors.Itisusuallyhardasthereoughttobearigorous evaluationofcountrywideandglobalevents.Itmaybevery crucialforaninvestortorecognizethemodern dayrateand get a near estimation of the destiny rate. Therefore need more committed output of the prediction algorithms can changethemindsetofthepeopleforthebusiness.Currently, thebetteranalysisofmachinelearninginbusinessfieldshas inspiredmanytraderstoimplementmachinelearningbased forhighlypredictedoutput.Variousresearcheshavealready beenfinishedtopredictthe stockmarket.Therearesome mechanisms for stock price prediction that comes under technical analysis such as Statistical method, Pattern Recognition, Machine learning, Sentiment analysis. In this research,weusemachinelearningalgorithmswhichisthe subfieldofAIthat'sextensivelydescribedthefunctionalityof amachinetoemulateintelligenthumanbehaviour.Machine learningalgorithmsareeithersupervisedorunsupervised. In Supervised Machine learning, labelled input data is trained and the algorithm is applied. Classification and regression are forms of supervised machine learning. UnsupervisedMachinelearninghasunlabelleddatathathas a lower managed environment that analyses pattern, correlation,orcluster.
The dataset is an important part of machine learning methods. In this research, various machine learning approachesareemployedonadatasetobtainedfromKaggle. The paper aims to implement various machine learning algorithmsonthestockmarketdataandfindingsthebest approachforthedataset.Therestofthepaperconsists of the following: First discusses the related works. Then discussesallthepredictionmethodsandfinallydiscussesthe experimental results with a conclusion where the last sectioninvolvesthereferences.
2022, IRJET | Impact Factor value: 7.529 | ISO 9001:2008 Certified Journal

International Research Journal of Engineering and Technology (IRJET) e ISSN: 2395 0056
Volume: 09 Issue: 06 | Jun 2022 www.irjet.net p ISSN: 2395 0072
The stock market prediction seems a complex problem becausemanyfactorshaveyettobeaddressedanditdoesn’t seemstatisticalatfirst.Butbyproperuseofmachinelearning algorithms,onecanrelatepreviousdatatothecurrentdata andtrainthemachinetolearnfromitandmakeappropriate assumptions[6].Thedatasetbeingutilizedforanalysiswas picked up from Kaggle. It consisted of various sections namely“Date,Open,High,Low,Close,VolumeandAdjclose”. AllthedatawasavailableinafileofCSVformatwhichwas firstreadandtransformedintoadataframeusingthePandas libraryinPython.Datapreprocessinginvolvesdatacollecting andremovalofnoisyandirrelevantsomethingfromdatais theapproachofdatacleaning.Inthispaper,weareapplying machinelearningtechniquestothedatatomeasureoverall accuracy, sensitivity and false positive rate. Although machinelearningassuchhasmanymodelsthispaperfocuses on linear regression, linear discriminant analysis, KNN, support vector machine, random forest and XG Boost for simulation and analysis. All these approaches have been describedinthissection.
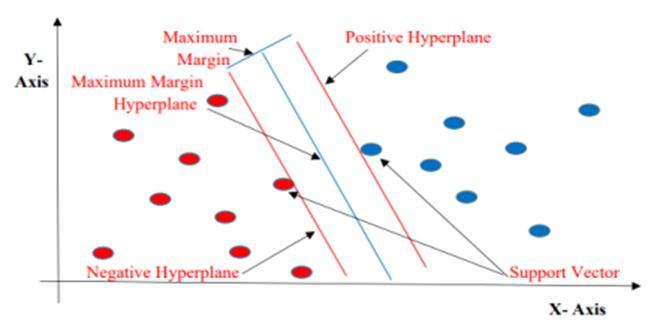
The Support Vector Machine is a discriminative classifier that separate the hyperplane. The SVM is a very famous supervisedmachinelearningtechniquehavingapredefined goalvariablethatmaybeusedasaclassifierinadditiontoa predictor. The outputs of the algorithm is optimal hyperplane for the labeled training data. In the two dimensionalspace,thishyperplaneisalinedividingaplane intotwopartswhereineachclasslayoneithersideSupport VectorMachineisconsideredtobeoneofthemostsuitable algorithmsavailableforthetimeseriesprediction.Boththe regressionandclassificationapproachusesthesupervised algorithm.TheSVMinvolvestheplottingofdataasapointin the space of n dimensions. These dimensions are the attributesthatareplottedonparticularcoordinates[4].
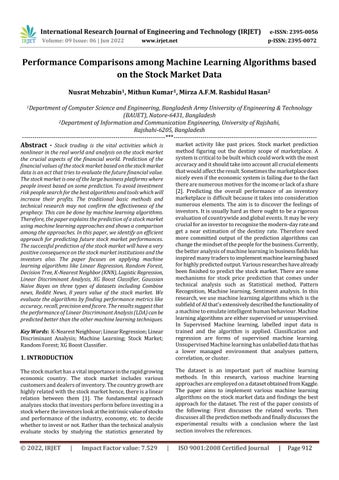
Many hyperplanes could classify the information. One affordablepreferenceisbecausethefinehyperplaneisthe onlyonethatrepresentsthemostimportantseparation,or margin,amongthe2classes.Soweselectthehyperplaneso thatthegapfromittotheclosestinformationfactoronevery facetismaximized.Ifthissortofhyperplaneexists,itsmiles arereferredtoasthemaximummarginhyperplane,andthe linear classifier it defines is referred to as a maximum margin classifier or equivalently, the perceptron of most suitablestability.
Fig 1 SupportVectorMachine.
More formally, a support vector system constructs a hyperplane or set of hyperplanes in a high or infinite dimensionalspace,whichmaybeusedforclassificationand regression.SupportVectorMachineisoneofthemaximum famous supervised learning algorithms that's used for classificationinadditiontoregressiontroubles.Thepurpose of the SVM set of rules is to create an excellent line or selectionboundarythatmaysegregaten dimensionalarea.
Fig 2 SupportVectorMachine(Margin,Hyperplane, SupportVector).
The SVM chooses the acute points/vectors that assist in developing the hyperplane. These intense instances are referred to as assist vectors and therefore set of rules is namedaSupportVectorMachine.
Thedecisiontreealgorithmisoneofthefamilyofsupervised learningalgorithmswhichcanbeusedforsolvingregression andclassificationproblemsalso.Thereforetheintentionof using a decision tree approach is to generate a training modelthatcanusetocalculatethevaluesoftargetvariables bylearningdecisionrules.Comparedwithotherclassifiersit iseasytounderstandthatsolvetheproblemsbasedonthe tree representation. The every internal node of the tree assembletoanattributewhereeachleafnodecorresponds toaclasslabel.Forpredictingaclasslabelforrecordtravers from the root of the tree. Then compare the values of the
International Research Journal of Engineering and Technology (IRJET) e ISSN: 2395 0056
Volume: 09 Issue: 06 | Jun 2022 www.irjet.net p ISSN: 2395 0072
root attribute with the record‘s attribute of the tree and based on the comparison we succeed the branch correspondingtothatvalueandthenjumptothenextnode. Hence,forpredictingtheclassvaluestheprocesscontinue comparingourrecord‘sattributevalueswithotherinternal nodesofthetree.
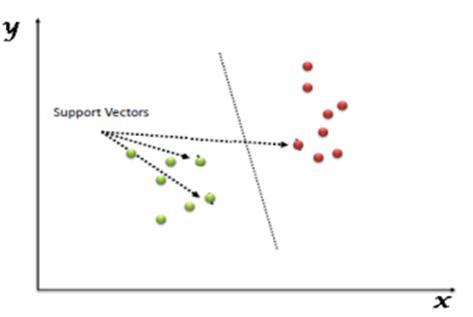
K Nearest Neighbor (KNN) characterization is a standout amongstthe most basicand straightforwardarrangement strategies. K Nearest Neighbor is also known as a lazy learning classifier. Classification typically involves partitioningsamplesintotrainingandtestingcategories.
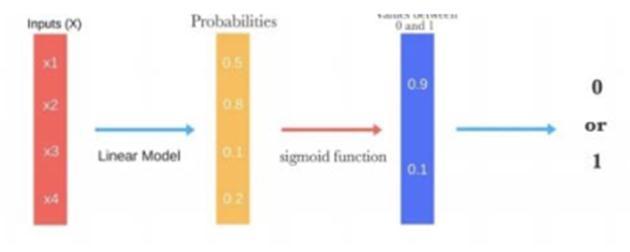
Likemanyothermachinelearningtechniques,itisborrowed fromthefieldofstatisticsanddespiteitsname,itisnotan algorithm for regression problems, where to predict a continuousoutcome.Instead,LogisticRegressionisthego to method for binary classification. Logistic Regression is specially fit for those dependent variables for binomial or multinomialclassification.Itgivesadiscretebinaryoutcome between 0 and 1. Logistic regression measures the relationship between the dependent variable (our label, whatwewanttopredict)andtheoneormoreindependent variables(orfeatures)byestimatingprobabilitiesusingits underlyinglogisticfunction.Theseprobabilitiesmustthen betransformedintobinaryvaluestomakeaprediction.This is the task of the logistic function, also called the sigmoid function.TheSigmoid FunctionisanS shapedcurvethatcan take any real valued number and map it into a value between the range of 0 and 1, but never exactly at those limits. These values between 0 and 1 will then be transformedintoeither0or1usingathresholdclassifier. The picture below illustrates the steps that logistic regressiongoesthroughtogivethedesiredoutput.
Fig 3 K NearestNeighbor(KNN).
During the training process, we use only the true class of each training sample to train the classifier, while during testingwepredicttheclassofeachtestsample[8].KNNisa "supervised"classificationmethodinthatitusestheclass labels of the training data. Unsupervised classification methods,or"clustering"methods,ontheotherhand,donot employtheclasslabelsofthetrainingdata.
Random Forest is a supervised algorithm and a sort of ensemblelearningprocess.Itisaflexiblealgorithmthatcan appearinbothregressionandclassification.Itisconstructed on multiple decision trees. It’s mainly building multiple decisiontreesandmergesthemforprocessingresults[7].In thissupervisedalgorithm,asubsetoffeaturesistakeninto consideration.Theworkingprocedureis:
1.Randomlyselectmfeatures.
2.Foranode,findthebestsplit.
3.Splitthenodeusingbestsplit.
4. Repeat the first 3 steps.5. Build the forest by repeating these4steps.
The Linear Discriminant Analysis (LDA) reduces the dimensionality which is commonly used for supervised classification problems. The LDA separates two or more classesbasedonthemodelingdifferenceswithingroupsthat isusedtoprojectthefeaturesinhigherdimensionspaceinto alowerdimensionspace[9].Supposetwosetsofdatapoints belongingtotwodifferentclassesthatwewanttoclassify.As showninthegiven2Dgraph(Fig.5.),whenthedatapoints areplottedonthe2Dplane,thereisnostraightlinethatcan separate the two classes of the data points. Hence, in this case,LDAisusedtoreducethe2Dgraphintoa1Dgraphto maximizetheseparabilitybetweenthetwoclasses.
International Research Journal of Engineering and Technology (IRJET) e ISSN: 2395 0056
Volume: 09 Issue: 06 | Jun 2022 www.irjet.net p ISSN: 2395 0072
1. Tree Pruning: The stopping criterion for tree splitting withinGBMframeworkisgreedyinnatureanddependson thenegativelosscriterionatthepointofsplit.XGBoostuses max_depthparameterforspecifiedthevaluesthancriterion firstandcomputingpruningtreesreverselywhichimproves the computational performance significantly of the algorithm.
2.HardwareOptimization:Thisalgorithmhasbeendesigned to make efficient use of hardware resources. This is accomplished by cache awareness by allocating internal buffersineachthreadtostoregradientstatistics.
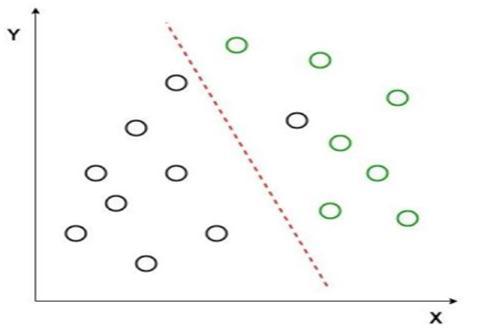
FromFig 5,itcanbeseenthatanewaxisisgeneratedand plottedinthe2Dgraphsuchthatitmaximizesthedistance between the means of the two classes and minimizes the variation within each class. In simple terms, this newly generated axis increases the separation between the data pointsofthetwoclasses.Aftergeneratingthisnewaxisall thedatapointsoftheclassesareplottedonthisnewaxis. ButLDAfailswhenthemeanofthedistributionsareshared, as it becomes impossible for LDA to find a new axis that makesboththeclasseslinearlyseparable[10].Insuchcases, weuseanon lineardiscriminantanalysis.
XG Boost is a decision tree based outfit machine learning algorithmthatemploymentsagradientboostingsystem.In prediction issues including unstructured data (images, content,etc.)artificialneuralnetworkstendtobeatallother algorithmsorsystems.Inanycase,whenitcomestosmall to medium structured/tabular information, choice tree based algorithms are considered best in class right presently.XGBoostalgorithmwasdevelopedasaresearch project at the University of Washington. The algorithm differentiatesitselfinthefollowingways:
1. A wide range of applications: Can be used to solve regression, classification, ranking and user defined predictionproblems.
2.Portability:RunssmoothlyonWindows,Linux,andOSX.
3. Languages: Supports all major programming languages includingC++,Python,R,Java,Scala,andJulia.
4.CloudIntegration:SupportsAWS,AzureandYarnclusters andworkswellwithFlink,Sparketc.
XGBoostandGradientBoostingMachines(GBMs)areboth outfit tree strategies that apply the rule of boosting weak learnersutilizingthegradientdescentarchitecture.XGBoost approachisattractiveforthefollowingpurposes.
The data was collected and developed so that it can be converted into the form that can be used in the model as inputs.Thefeatureselectionmethodshavebeendeveloped in Python programming language with Anaconda, version 1.9.7.Thecombineddatasetconsistsoftop25newspapers dataindateperspectiveandthedatasetaboutstockmarket consistsoffeatureOpen,Close,High,LowandVolume.Here wemargethesedatasetstocreateanewclasslabelthatwill havebinaryvalues(either0or1).Nowwetraineddatasets using a model and then the test data is run through the trainedmodel.Weobtainaconfusionmatrixthatrepresents the values of “True positive, False negative, False positive andTruenegative”.
True positive is the number of correct predictions that a valuebelongstothesameclass.Truenegativeisthenumber ofcorrectpredictionsthatavaluedoesbelongtothesame class.False positiveisthenumberofincorrectpredictions thatavaluebelongstoaclasswhenitbelongstosomeother class.False negativeisthenumberofincorrectpredictions thatavaluebelongstosomeotherclasswhenitbelongsto the same class. For measuring the performance of the classifiers we applied the measurements of precision, f score, re call, support, macro average, weighted average, false positiverate,andoverallaccuracy.Here,TP,TN,FPand FNcorrespondtotruepositive,truenegative,falsepositive andfalsenegativerespectively.TheROCcurveanalysiswas alsoperformedinourstudy.
Sensitivity is described as the probability of accurately recognizingsomeconditions. Sensitivityiscalculatedwith thefollowingformula:
Sensitivity=TP/(TP+FN) (1)
Precisionpointstohowfamiliarestimationsfromseparate samplesaretoeachother.Thestandarderrorisanexample ofprecision.Whenthestandarderrorislittle,estimations fromdifferentsampleswillbealikeinvalueandviceversa. Precisionismeasuredasfollows:
International Research Journal of Engineering and Technology (IRJET) e ISSN: 2395 0056
Volume: 09 Issue: 06 | Jun 2022 www.irjet.net p ISSN: 2395 0072
Precision=TP/(TP+FP) (2)
The F score is measured concurring to the accuracy and review ofa test practicedunderconsideration.F Score is estimatedwiththehelpofthefollowingformula:
F Score=2TP/(2TP+FP+FN) (3)
Instatistics,whenconductingvariouscomparisons,afalse positiveratioistheprobabilityofincorrectlydiscardingthe nullhypothesisforadistincttest.Thefalse positiverateis determined as the ratio between the numbers of negative resultsincorrectlyclassifiedaspositive(falsepositives)and thetotalamountofactualnegativeresults.
FalsePositiveRate=FP/(FP+TN) (4)
Overall accuracy is the possibility that a sample will be accurately matched by a test that is the total of the true positivesandtruenegativesdividedbythetotalnumberof individuals examinedthatisthesumoftruepositive,true negative,falsepositiveandfalsenegative.However,overall accuracydoesn‘tshowtheactualperformanceassensitivity and specificity may differ despite having higher accuracy. Overallaccuracycanbeestimatedasfollows:
OverallAccuracy=(TP+TN)/(TP+TN+FP+FN) (5)
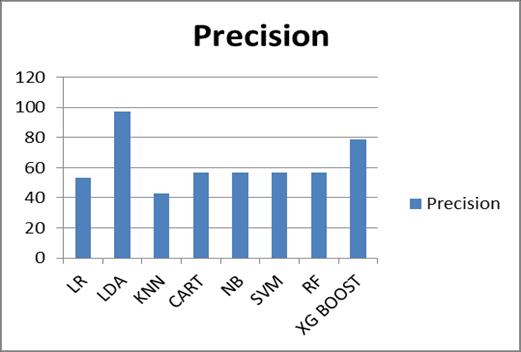
Table 1. Overall accuracy value for different algorithms
Algorit hms Sensit ivity Precisio n F1 Score Support Accuracy
LR 1.00 .53 .69 317 0.530988
LDA .91 .97 .95 317 0.943048
KNN .45 .43 .44 317 0.458961
CART .72 .57 .64 317 0.566164
NB .99 .57 .69 317 0.532663
SVM .99 .57 .67 317 0.532663
RF .67 .57 .55 317 0.559463
XG Boost .60 .79 .67 317 0.591289
Table1showstheacquiredvaluesofaccuracy,sensitivity, precision and f score for the algorithms that are implementedonthedataset.
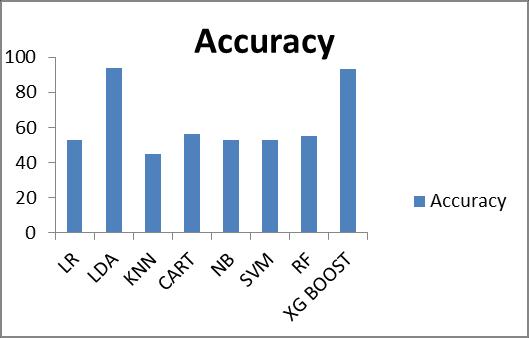
Fig -6 Comparisonsamongthealgorithmsbasedonthe accuracy.
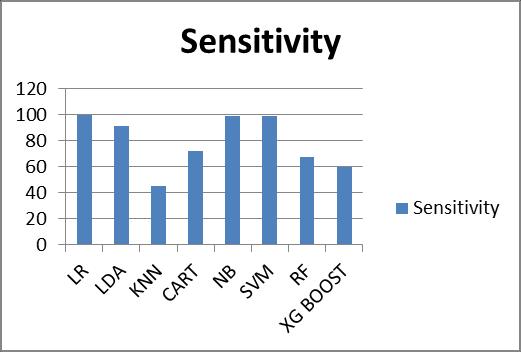
Fig 6showsthecomparisonsamongthealgorithmsbased on the accuracy. From Fig 6 we understand that Linear DiscriminantAnalysis(LDA)showsthebetterperformance thanotheralgorithms.
Fig -7 Comparisonsamongthealgorithmsbasedonthe sensitivity.
Fig 8 Comparisonsamongthealgorithmsbasedonthe precision.
Factor value: 7.529 | ISO 9001:2008 Certified
International Research Journal of Engineering and Technology (IRJET) e ISSN: 2395 0056
Volume: 09 Issue: 06 | Jun 2022 www.irjet.net p ISSN: 2395 0072
Therefore, from all these experimental results the liner discriminant analysis (LDA) model outperformed than all otherstudiesofstockmarketanalysisforincludeddatasets.
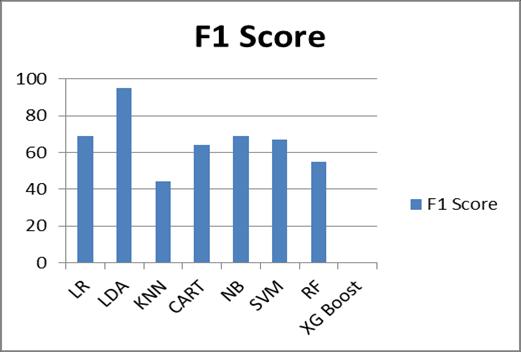
Fig 9 ComparisonsamongthealgorithmsbasedontheF1 Score.
Fig 8 and 9 show the comparisons among the algorithms basedontheprecisionand F1Score whereLDAperforms betterthanotheralgorithms.TheLDAvaluegoestoaround 95 to 97 for precision and F1 score which is the better measurementforstockmarketanalysisbasedonthetypeof datasetthatusedinthisresearch.FromTable1andFig 6,it can be assured that the linear discriminant analysis algorithmsoutperformothermethods.However,forfurther evidence,theROCcurveanalysiswasperformedaswell.
Ourresearchstudyaimstoanalyzethestockmarketdataby implementingmachinelearningalgorithmsonthedatasets. In the stock market business, prediction plays a vital role which is very difficult and challenging process due to the variable nature of the stock market. We applied eight algorithms: Logistic Regression, Linear Discriminant Analysis,RandomForest,SVM,KNN,CART,RandomForest andXGBOOSTonthedataset.Thispaperwasanattemptto determine the analysis of the stocks of a company with greater accuracy and reliability using machine learning techniques.WeconcludethatLinearDiscriminantAnalysis (LDA) is the best algorithm out of the implemented algorithmswithanaccuracyrateof94.3%.Inthefuture,this paper would be adding more parameters that will predict betterestimation.
[1] A. Sharma, D. Bhuriya and U. Singh, "Survey of stock marketpredictionusingmachinelearningapproach,"In the Proceedings of International conference of Electronics,CommunicationandAerospaceTechnology (ICECA),pp.506 509,2017.
[2] M. Usmani, S. H. Adil, K. Raza and S. S. A. Ali, “Stock MarketPredictionUsingMachineLearningTechniques”, IntheProceedingsof3rdInternationalConferenceOn ComputerAndInformationSciences(ICCOINS),pp.322 327,2016.
[3] M. P. Naeini, H. Taremian and H. B. Hashemi, “Stock MarketValuePredictionUsingNeuralNetworks”,Inthe ProceedingsofInternationalConferenceonComputer Information Systems and Industrial Management Applications(CISIM),pp.132 136,2010.
Fig -10 ROCcurve.
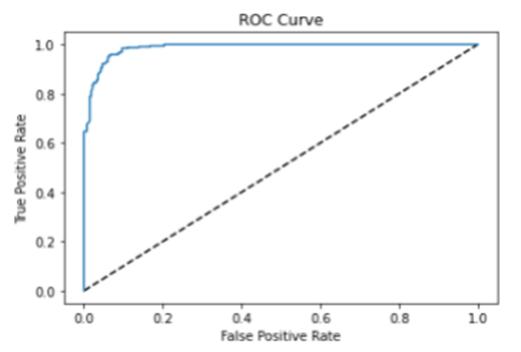
The observations made from the performance of the algorithmsare:
1. Linear Discriminant Analysis (LDA) gives the highest accuracyrateforprediction.
2.LogisticRegression(LR)reacheshighestsensitivity.
3. Linear Discriminant Analysis (LDA) reaches highest precisionandf score.
4.KNNistheworstalgorithmamongthesealgorithmsfor predictionintermsofaccuracy.
[4] K. Pahwa, N. Agarwal, “Stock Market Analysis using Supervised Machine Learning”, In the Proceedings of InternationalConferenceonMachineLearning,BigData, Cloud and Parallel Computing (Com IT Con), pp. 197 202,2019.
[5] Z.Hu,J.ZhuandK.Tse,“StocksMarketPredictionUsing Support Vector Machine”, In the Proceedings of 6th InternationalConferenceonInformationManagement, InnovationManagementandIndustrialEngineering,pp. 115 120,2013.
[6] M. Ballings, D. V. D. Poel, N. Hespeels and R. Gryp, “Evaluatingmultipleclassifiersforstockpricedirection prediction”,JournalofExpertSystemApplication,2015, Vol.42,pp.7046 7056.
International Research Journal of Engineering and Technology (IRJET) e ISSN: 2395 0056
Volume: 09 Issue: 06 | Jun 2022 www.irjet.net p ISSN: 2395 0072
[7] S. Jain and M. Kain, “Prediction for Stock Marketing Using Machine Learning”, An International Journal on Recent and Innovation Trends in Computing and Communication,Vol.6(4),pp.131 135.
[8] M. S. Babu, N. Geethanjali and B. Satyanarayana, “Clustering Approach to Stock Market Prediction”, An International Journal of Advanced Networking and Applications,2012,vol.03(04),pp.1281 1291.
[9] T. Tantisripreecha and N. Soonthornphisaj, “Stock Market Movement Prediction using LDA Online LearningModel”,IntheProceedingsof19thIEEE/ACIS International Conference on Software Engineering, Artificial Intelligence, Networking and Parallel/Distributed Computing (SNPD), pp. 135 139, 2018.
[10] I.Parmar, N.Agarwal,S.Saxena,R.Arora,S.Gupta,H. DhimanandLokeshChouhan,“StockMarketPrediction Using Machine Learning”, In the Proceedings of First International Conference on Secure Cyber Computing andCommunication(ICSCCC),pp.574 576,2018.
2022, IRJET | Impact Factor value: 7.529 | ISO 9001:2008 Certified