STOCK PRICE PREDICTION AND RECOMMENDATION USINGMACHINE LEARNING TECHNIQUES AND TWITTERSENTIMENT ANALYSIS
Kunal GaurDepartment of Information TechnologyGuru Tegh Bahadur Institute Of Technology Delhi, India

KamalJyot Singh
Department of Information Technology
Guru Tegh Bahadur Institute Of Technology Delhi, India
Saud Akhtar
Department of Information Technology
Guru Tegh Bahadur Institute Of Technology Delhi, India
Gaurav Sandhu
Department of Information Technology
Guru Tegh Bahadur Institute Of Technology Delhi, India
Abstract The prediction of the stock market has entered a technologically advanced era, redesigning the traditional concept of trade, thanks to technical wonders such as worldwide digitalization. Stock prices are difficult to predict due to theirextremevolatility,whichisinfluenced by a variety of political and economic issues, as well as changes in leadership, investor attitude, and a variety of other factors. Stock price predictions based solely on historical data or textual information have shown to be unsatisfactory, That’s why we have used both for predicting the stock price and recommendation to buy or sell a particular stock. As stockprice prediction is a Time series problem we have used various machine learning and deep learning techniques such as LSTM, ARIMA & Linear Regression.Outofthese ARIMAperformedreally well with an accuracy of 83%. Existing studies in sentiment analysis also have found that there is a strong correlation between the movement of stock prices and the twitter tweets for a particular company. We have performed sentiment analysis on the latest tweets of the respective company and will provide a recommendation to buy or sellthat particular stockof acompany.
Keywords LSTM, ARIMA, Machine Learning, Sentiment Analysis, Trade Open, Trade Close.
I. INTRODUCTION
Stock market prediction refers to predicting a company's present developments and the value of its stocks, whether they are rising or falling. The stock market is where a company's stock is traded. A stock is a type of investment that reflects ownership in a corporation. The stock market is where such stocks are bought and sold. Buying a company's shares is like buying a small piece of an institution. Thereare many factors which can impact the price of the stock. A prediction model that just takes into account one componentmay not be reliable. As a result combiningboththetweets andhistoricalpriceofthestock might improve the accuracy. There are primarily two approaches for predicting market trends. Technical analysis and Fundamental analysis are two types of
Krishvi SrivastavaDepartment of Information Technology
Guru Tegh Bahadur Institute of Technology Delhi, India ***
analysis. Fundamental analysis uses previous price and volumetoforecastfuturetrends,buttechnicalanalysisdoes not. Fundamental analysis of a firm, on the other hand, entailsevaluatingfinancialdatatogetinsights.Theefficient market theory, which holds that stock market prices are basically unpredictable, casts doubt on the usefulness of both technical and fundamental analysis. The goalofthisresearchworkistobuildamodelwhichpredicts the stock trends. Three models are used as a part of this research work. The models are ARIMA, LSTM and Linear Regression. Sentiment Analysis is performed by using twitterdataofthecompany. LSTM model was made by Hochreiter & Schmidhuber [1] which was capable of learning long term dependencies. Lateron,manyresearchedimprovedthisworkin[2][3][4].
The rest of the paper is organized is as follows. Section 2 includes the research state of the stock price prediction. Section 3 includes the Data Collection & Preprocessing. Section 4 consists of the methodologies used. Section 5 includes the Experimental Results. Section 6 concludes the paper.
II. LITERATURE SURVEY
TheSiliverstovsofManhHaDuongBoris[5],investigate the abstraction between equity pricesandcombined financesin key European countries such as the United Kingdom and Germany. Acceleration in European country investments is likely to result in a stronger link between European nation equity prices. If innovations in stock markets effect actual financialinstrumentslikeinvestmentandconsumption,this operation might lead to a merger in financial development acrossEUstates.FahadAlmudhafetal.[6],examineCIVETS' weak form market efficiency from 2002 to 2012. CIVETS employstherandomwalkhypothesisprocedure. P. Bhat[7], employed convolution neural networks to forecaststockprices.Inthismodel,learningiscompletedby computing the mean square error for each subsequent
International Research Journal of Engineering and Technology (IRJET) e ISSN: 2395 0056
Volume: 09 Issue: 06 | June 2022 www.irjet.net p ISSN: 2395 0072
observation, and the model with the least error and the highest predictive power is chosen. They are using CNN in thisstudytoforecaststocksandincentivesforthenextday. Forfuturestockpriceprediction,MohammadMekayelAnik et al[8], designed a linear regression technique. They met their objectives in that the model's accuracy is excellent, andit may be used to forecast stock prices. Xiao Ding et al.[9] created an intuitive and effective interface to include commonsenseinformationintothelearningprocess.
Alostad and Davulcu [10] used hourly stock prices for 30 stocks as well as NASDAQ online stock news items. For six months, they gathered tweets linked to those 30 stocks. Li etal. [11] gathered data from the Hong Kong stock market for five years. They collected financial news stories from thesametimeperiodtoseeiftherewasalinkbetweenthe articlesandstockmarketchanges.Theygatheredtheopen, high, close, and low stock prices for each firm on a given trading day. The stock price trend prediction issue was addressed as a classification problem by Alostad and Davulcu [12]. They used logistic regression on the n gram document matrix, hourly stock price direction, and document weight. They then performed the classification using SVM. Experiments also revealed that extracting document level sentiment does not improve prediction accuracyconsiderably.Randomforest,naïveBayesian, and evolutionary algorithms have all been used to forecast stockpriceanddirectioninearlierstudies.
Stock prediction model employing logistic regression with feature index variables has been established by Gong and Son [13]. They claim that logistic regression outperforms otherapproachessuchastheRBF ANN prediction model fordailystocktradingprediction.
J. Bean [14] utilises keyword tagging to measure polarity and emotion in Twitter feeds concerning airline satisfaction.This might give you a fast overview of how people feel about airlines and their customer service scores.
From all above researches done we were not able to find anything which have used more than 1 models and based onPolarityoftweetsarecommendationofbuy/sellisgiven totheuser.
III. DATA COLLECTION AND PREPROCESSING
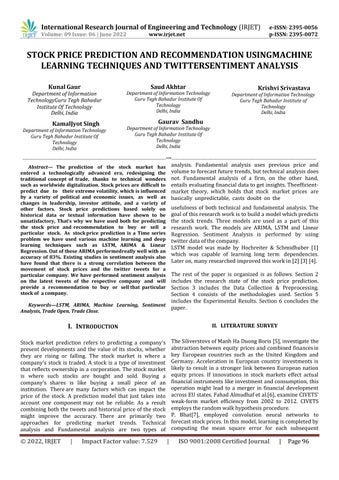
A. Data Collection
TableIII.1 Sample Data Input of SBIN.NS
B. Data Preprocessing
To make the data from the mode of entry appropriate for trustworthyanalysis,ithastobepre processed.
We preprocessed the historical data in the following manner:
S.No. Techniques
1. Dropping Null Values present in the datasetifany.
2. Appending the stock symbol atthe end ofarespectivecompany.
3. Usednormalizationtechniques toget data insamerange.
DataPreprocessingForARIMAModel: S.No. Techniques
1. Parsing the date and time in format ‘%Y %m %d’.
2. Filling the null values withbackwardfill method.
3. Taken 80% of the data fortraining and 20%datafortesting.
DataPreprocessingforLSTMModel: S.No. Techniques
1. Scaled the values using Min Max Scaler
Finance API(https://finance.yahoo.com/).
Yahoo
Forgettingthehistorical data,wedownloadedthe last 2yearsdatasetofaparticularcompanybyusing
For Sentiment Analysis Part, firstly weare reading the companynamefromacsvfilenamed Yahoo- FinanceTicker Symbols.csv andthenfetchingthelatesttweets of that particular company by using thelibrary named Tweepy
2. Storing trends of a particular company from 7 days before current day to predict 1 next output and storingthemtotrainingpart 3. Converting training list intonumpy arrays 4. Adding 3rd Dimension to trainingpart.
International Research Journal of Engineering and Technology (IRJET) e ISSN: 2395 0056
Volume: 09 Issue: 06 | June 2022 www.irjet.net p ISSN: 2395 0072
DataPreprocessingforLinearRegAlgorithm: S.No. Techniques 1. Declaring number of days (n) to beforecastedinfuture. 2. Declaring new dataframe with relevantdata.
S.No. Techniques
IV. METHODOLOGIES
A. ARIMA (Auto Regressive Integrating Moving Average):
ARIMA stands for auto regressive integrated moving average. It is a statistical analysis model that uses time series data to better understand the data set or anticipate futuretrends.
If a statistical model predicts future values based on previousvalues,itiscalledautoregressive.Forexample,an ARIMA model may try to anticipate a company's earnings based on prior periods or predict a stock's future pricing basedonhistoricalperformance.
The model's final goal is to forecast future time series movement by looking at disparities between values in the series rather than actual values. When there is evidence of non stationarity in the data, ARIMA models are used. Non stationary data are always turned into stationary data in timeseriesanalysis.
We can break down the model into smaller components basedonthename:
TheAR,whichstandsforAutoregressiveModel,shows a random process. The output of the modelislinearly dependent on its prior value, such as the number of laggeddatapointsorpreviousobservations.
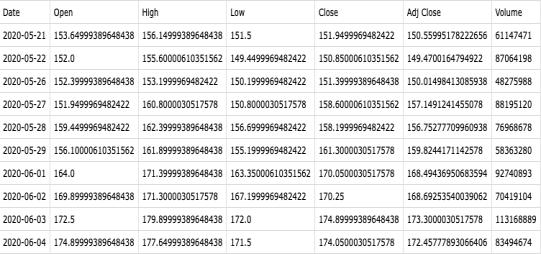
and three gates, giving it the ability to learn, unlearn, or retain information from each of the units selectively. By permitting only a few linear interactions, the cell state in LSTM allows information to travel across the units without being altered. Each unit contains an input, output, and a forget gate that adds or removes data from the cell state. The forget gate utilises a sigmoid function to determine which information from the previous cell state should be ignored. The input gate uses a point wise multiplication operation of 'sigmoid' and 'tanh' to control the information flow to the current cell state. Finally, the output gate determines which data should be transmitted on the next hiddenstate.LSTMcanbeusedinmanyapplicationssuchas for weather forecasting, NLP, speech recognition, handwritingrecognition, time series prediction, etc The cell state is represented by the horizontal line that runs across thetopofthefigure.Theconditionof thecell issimilartoa conveyor belt. This flows straight down the chain with just minimal linear interactions. The ability of LSTM to add or deleteinformationfromthecellstateiscontrolledbygates. Gates are used to allow information to pass through if desired. A sigmoid neural net layer plus a point wise multiplication operation make up gates. The sigmoid layer produces values ranging from 0 to 1, indicating how much of each component should be allowed to pass. Let nothing through with a value of 0, and everything through withavalueof1! Tosafeguardandgovernthecellstate,an LSTMcontainsthreeofthesegates.
Integrative (I) : denotes the separating of raw observations so that the time series can become stationary (i.e., data values are replaced by the difference between the data values and the previous values).
FigureIV.1 LSTM Architecture
The prior hidden state (ht 1), previous cell state (Ct 1) and presentinputaretheinputs tothe currentcell state(Ct),as illustrated in Fig. IV.1. (Xt). The forget gate, input gate, and outputgatearethethreegatesthatmakeupthecell.
C. Linear Regression :
Moving Average (MA): It takes into account the relationship between an observation and a residual errorfromalaggedmovingaveragemodel.
B. LSTM (Long Short Term Memory Network) :
It's a unique type of recurrent neural network that can learnlong termdatarelationships.Thisispossiblebecause themodel'srecurringmoduleismadeupoffourlayersthat interactwithoneanother.AnLSTMmodulehasacellstate
Linear regression is a supervised learning machine learningalgorithm.Itcarriesoutaregressiontask.Basedon independent variables, regression models a goal prediction value.Itismostlyutilisedinforecastinganddeterminingthe linkbetweenvariables.Differentregressionmodelsdifferin terms of the type of relationship they evaluate between dependentandindependentvariables,aswellastheamount of independent variables they employ. Linear regression is used to predict the value of a dependent variable (y) given anindependent variable (x). As a result of this regression
International Research Journal of Engineering and Technology (IRJET) e ISSN: 2395 0056
Volume: 09 Issue: 06 | June 2022 www.irjet.net p ISSN: 2395 0072
technique, a linear relationship between x (input) and y (output) is discovered (output). Linear Regression gets its namefromthis. Y = (Wi * x + b) D.Research Methodology :
Epochs RMSE 10 7.49 20 6.93 30 5.64 40 6.74
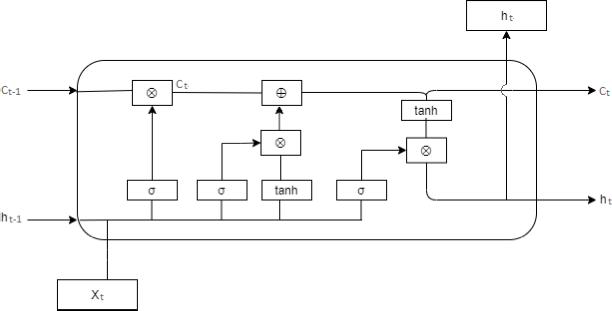
FigureIV.2SystemArchitecture
Adashboardwascreatedwhereausercanenter anystock symbol for predicting its future price up to 7 days. After enteringthestocksymboluserwillbemigratedtoanother webpage where he/she can find predictions given from different models with their RMSE and polarity from latest tweets. A recommendation will be given to user based on theoverallPolaritywhethertobuythestockornot.
V. EXPERIMENTAL RESULTS
The models ran for various stock. Some illustrations are givenbelow.We’llbeseeingtheRMSE(RootMeanSquared Error)forvariousstocks.
A. AAPL (Apple Inc.)
ARIMA:
o ARIMA model was ran for Apple stock. We got an RMSE value of 3.54 which is pretty good as we can see in the followinggraphplottedbelow
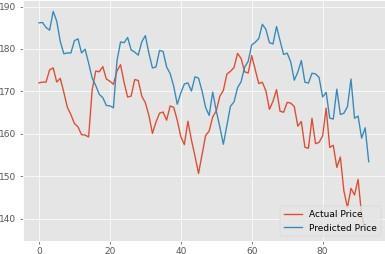
FigureV.2.: LSTMModelAccuracy
LinearRegression:
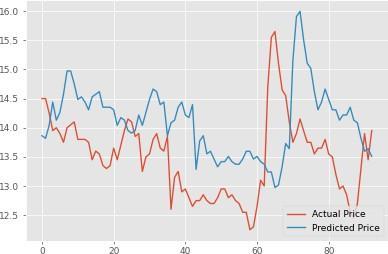
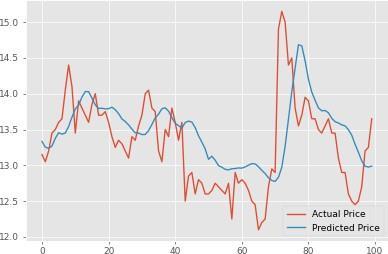
o Linear Regression model was ran and got an RMSE of 12.84. Following is the graph plotted for Linear RegressionModel.
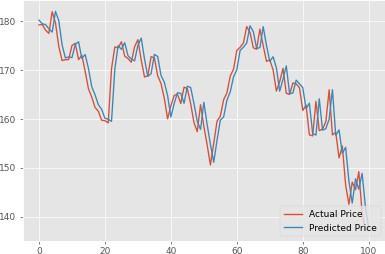
FigureV.1: ARIMA
Model
o We ran LSTM model for various epochsasdepictedinthe tablebelow.After30epochswegotagoodRMSEvalue.
TableV.1(LSTMOnVariousEpochs)
FigureV.3.: LinearRegressionModelAccuracy
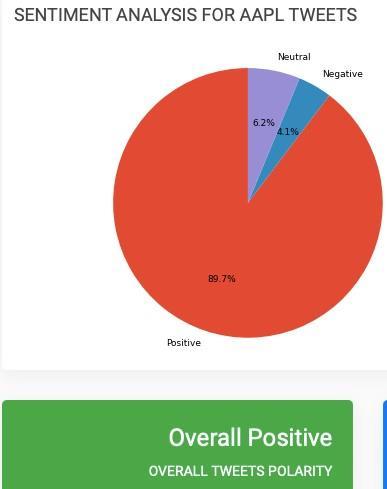
SENTIMENTANALYSIS: o Takenthelatest20tweetsbasedonapplecompany. o Calculated Polarity by using TextBlob andgot Overall PolarityasPositive.
International Research Journal of Engineering and Technology (IRJET) e ISSN: 2395 0056
Volume: 09 Issue: 06 | June 2022 www.irjet.net p ISSN: 2395 0072
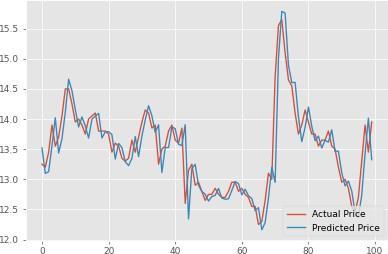
o Model was tested on test data and a graph is plotted betweenActualPriceandLSTM’spredictedprice.
TableV.1(LSTMOnVariousEpochs)
Epochs RMSE 10 0.60 20 0.58 30 0.57 40 0.63
FigureV.4:
PolarityFromTweets
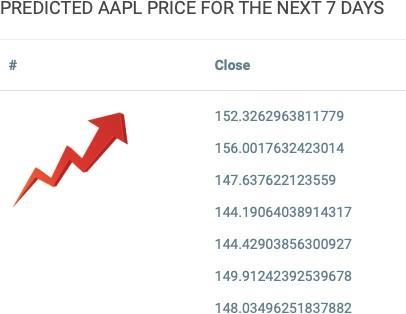
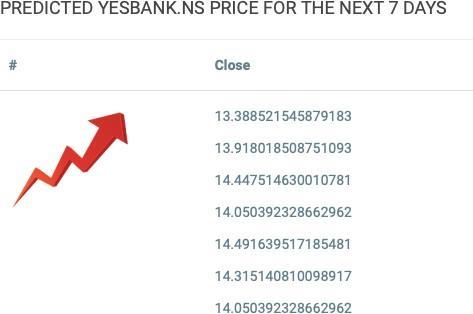
o PredictedPriceforNext7days: o WecanseethatPriceisincreasing.
YESBANK.NS (Yes Bank Ltd.) ARIMA:
o ARIMAmodelwasranforApplestock.WegotanRMSE valueof0.35whichis prettygoodaswecanseeinthe followinggraphplottedbelow
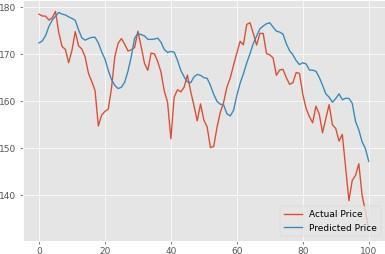
FigureV.6: LSTMModelAccuracy
LinearRegression: o Linear Regression model was ran and got an RMSE of 1.04. Following is the graph plotted for Linear RegressionModel
B. FigureV.5: ARIMAModelAccuracy
LSTM: o We ran LSTM model for various epochs asdepicted in the tablebelow.After30epochswegotagoodRMSEvalue.
FigureV.7.: LinearRegressionModelAccuracy
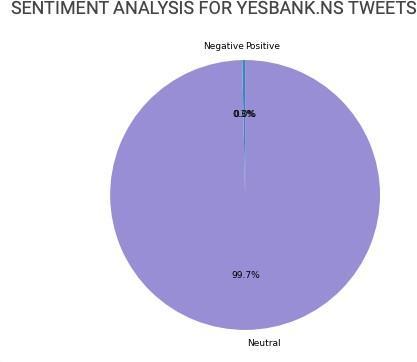
SENTIMENTANALYSIS: o Takenthelatest20tweetsbasedonAppleCompany o Calculated Polarity by using TextBlob andgot Overall PolarityasNeutral.
FigureV.8: PolarityFromTweets
prediction
VII. REFERENCES
[1]S. Hochreiter and J. Schmidhuber, "LSTM can solve hard long time lag problems," in Advancesin neural information processingsystems,NIPS,1997,pp.473 479.
[2]Y. Bengio, P. Simard, P. Frasconi and others, "Learning long term dependencies with gradient descent is difficult," IEEEtransactionsonneural networks,vol.5,no.2,pp.157 166,1994.
[3]S. Hochreiter and J. Schmidhuber, "LSTM can solve hard long time lag problems," in Advancesin neural information processingsystems,NIPS,1997,pp.473 479.
[4]S. Hochreiter, "The vanishing gradient problem during learning recurrent neural nets and problem solutions," International Journal of Uncertainty, Fuzziness and Knowledge BasedSystems,vol.6,no.2,pp.107 116,1998.
[5]ManhHaDuongBorissSiliverstovsJune2006 TheStock MarketandInvestment.
[6]Fahad Almudhaf, Yaser A. Alkulaib from Kuwait University AreCivetsStockMarketsPredictable?
[7]Pranav Bhat Electronics and Telecommunication Department, Maharashtra Institute of Technology, Pune.
[8]Savitribai Phule Pune University A Machine Learning ModelforStockMarketPrediction.
Mohammad Mekayel Anik, Mohammad Shamsul Arefin and M. Ali Akber Dewan, Department of Computer Science and Engineering An Intelligent Technique for Stock Market Prediction
VI. CONCLUSION AND FUTURE WORK
In recent years, most people have been seen investing in the stock market in order to make quick money. At the same time, an investor stands a good probability of losing all of his or her money. To comprehend future market trends,theuserwillneedaneffectivepredictivemodel. Many prediction models exist that can anticipate whether the market is going up or down, but they are inaccurate. A model for predicting the stock market movement for the next day has been attempted. A model has been constructedand evaluatedusingdiversestockmarketdata accessible open source, taking into account numerous patterns such as continuous up/down, volumetradedeach day,andalsoincludescorporatesentiment.
On the considered dataset, LSTM and ARIMA model are performingbest.
Wehavealsoperformedsentimentanalysisontwitterdata todetectpolarityofthatparticulartweet.Recommendation System is running well with the help of polarity of each tweet.
InFuturewecanmakethisresearchbroaderbypredicting cryptocurrency prices. As cryptocurrency trading is the most volatile trading so, we can build a much more concentrated model which can focus more in depth for
[9]XiaoDing,KuoLiao,TingLiu,ZhongyangLi,JunwenDuan Research Centre for Social Computing and Information Retrieval Harbin Institute of Technology, China Event Representation Learning Enhanced with External Common senseKnowledge.
[10]H. Alostad and H. Davulcu, “Directional prediction of stockpricesusingbreakingnewsontwitter,”in2015
[11]X. Li,H. Xie, Y.Song, S. Zhu, Q.Li, and F.L. Wang, “Does summarization help stock prediction? a news impact analysis,” IEEE IntelligentSystems,vol.30,no.3,pp.26 34, May2015.
[12]J. Gong and S. Sun, A New Approach of Stock Price Prediction Based on Logistic Regression Model, In 2009. NISS ’09. International Conference on New Trends in Information and Service Science, pp. 1366 1371, June (2009).
[13]J. Bean, R by example: Mining Twitter for consumer attitudes towards airlines, In Boston Predictive Analytics MeetupPresentation
[14]R. Kotikalapudi, "Keras Visualization Toolkit," [Online]. Available: https: //raghakot.github.io/keras vis. [Accessed 31May2019].
International Research Journal of Engineering and Technology (IRJET) e ISSN: 2395 0056
Volume: 09 Issue: 06 | June 2022 www.irjet.net p ISSN: 2395 0072
BIOGRAPHIES

KUNAL GAUR
Department of Information Technology Guru Tegh BahadurInstituteOfTechnology Delhi,India
SAUD AKHTAR
Department of Information Technology Guru Tegh BahadurInstituteOfTechnology Delhi,India
KRISHVI SRIVASTAVA
Department of Information Technology Guru Tegh BahadurInstituteOfTechnology Delhi,India


KAMALJYOT SINGH
Department of Information Technology Guru Tegh BahadurInstituteOfTechnology Delhi,India
GAURAV SANDHU
Department of Information Technology Guru Tegh BahadurInstituteOfTechnology Delhi,India