International Research Journal of Engineering and Technology (IRJET) e ISSN: 2395 0056

Volume: 09 Issue: 06 | Jun 2022 www.irjet.net p ISSN: 2395 0072
International Research Journal of Engineering and Technology (IRJET) e ISSN: 2395 0056
Volume: 09 Issue: 06 | Jun 2022 www.irjet.net p ISSN: 2395 0072
1Dept. of Mechanical Engineering, National Chin Yi University of Technology, Taichung 411030, Taiwan (R.O.C.) ***
Abstract - This study reported the investigation on the influence of cutting parameters and machining vibration on the surface quality of the milled workpieces Regression analysis was used to establish a mathematical model to predict the surface accuracy under various cutting conditions (spindle speed, axial depth of cut and feed rate). According to the results, for regression model established by using cutting parameters, the correlation coefficient between the predicted values and the measured values is about 0.7, and the average prediction error is 16.9%. For regression model based on cutting parameters and machining vibration, the correlation coefficient between the predicted values and the measured values is more than 0.84, and the average error is about 13.6%. It shows that the tool vibration has a great influence on the cutting quality, which is also an important parameter for establishing a prediction model. This method can be combined with other optimization algorithms to optimize the cutting process. The results can provide the basis for the development of on line cutting vibration monitoring system to predict the surface quality in milling process.
Key Words: Cutting conditions, Machining vibration, Surfaceroughness,Regressionanalysis.
Thedevelopmentofthemachinetoolindustryismainly motivated by the needs of the application side, especially, withhighdemandofprocessingefficiencyandhighquality The basic characteristics of high precision and high surface quality are gradually widely used in aerospace industry, 3C industry and other industries. High performance machining actually is an integrated technology of machining process with high cutting speed, high feed rate and high material removal rate. Compared with traditional process, high performance machining technology not only achieves faster cutting speed, higher processingefficiencyandlowerprocessingcosts,butalso, showsnewtechnicalcharacteristics,whichhasbecomean important factor to promote the development of machinerymanufacturingtechnology.
Another advantage of high performance machining technology is that it can produce better machined surface accuracy. This is based on the manufacturing process of mechanical components, and high speed machining is an
important method to obtain the final geometric size and shape. Nowadays, due to the high requirements for product quality, the surface roughness of high precision products is an important indicator of workpiece quality. Poor surface accuracy will affect the frictional resistance of the combined interface, the lubricating interface layer and even the fatigue life [1 4]. Basically, the factors affectingthesurfacecuttingaccuracyincludetoolmaterial geometry, workpiece material and cutting conditions, etc. [5,6]. Cutting parameters such as axial depth of cut, spindle speed,feed rate was shown to have greatimpacts on surface quality [7]. Therefore, monitoring the surface quality within the desired range is of importance and worthyofinvestigation. Itfollowsthattheoptimizationof cutting conditions is a perquisite for producing better surfaceaccuracy[8 11].
Lou et al. [4] proposed a surface roughness prediction model for milling 6061 aluminum alloy, in which the dominantfactorsincludecuttingrate,feedrate,anddepth of cut. Taguchi analysis based on the machining experimentsshowsthatthecuttingdepthhasasignificant effect (40%), followed by tool material (30%) and rotationalspeed(20%),whiletheeffectoffeedrateisnot significant. Finally, a multivariate regression analysis is usedtoestablisha predictionmodel.Thismodelprovides a predicted surface roughness measure with 90% accuracy. Pinar et al. [12] also employed Taguchi method toinvestigatetheinfluence ofprocessparameterssuchas cutting rate, feed rate, cutting depth and cutting path on surface roughness. Their results confirmed that surface roughness has a significant positive correlation with feed rate and depth of cut, and a negative correlation with cutting rate, while there is no significant correlation with cuttingpath Arokiadassetal.[8]reportedtheinfluenceof cuttingspeed,feedrate,depthofcutandsiliconcontentof siliconnitridehardenedtoolsonthesurfaceroughness.In their research, the response surface method was used to establish the correlation and mathematical model of surface roughness and cutting parameters. The results show that the second order model can present such a relationship, and the regression analysis shows that the correlation coefficient is 99.85%, with a confidence level of 95%. This model also confirms that feed rate has a significant effect on surface roughness, followed by spindle speed. Nian et al.[13] applied Taguchi method to set cutting speed, feed rate and depth of cut as control
International Research Journal of Engineering and Technology (IRJET) e ISSN: 2395 0056
factors, and considered multi objective characteristics at the same time. Bhogal et al. [14] applied multivariable regression analysis to establish a prediction model of cutting parameters on surface roughness, tool wear and tool vibration, and found that feed rate is the main factor affecting surface accuracy, and spindle speed is the main factoraffectingtoolvibrationinmachining. Thesestudies show that the influence extent of cutting parameters on the surface roughness is different, which is dependent on machinespindletoolsystem,geometrycharacteristicsand material of the cutter, workpiece material and selected cuttingparametersintheexperimentalconditions.
Further, David et al. [15] demonstrated that workpiece topomorphy is affected by the vibration of cutter in machining. They found that an increased cutting force with an increasing cutting depth and feed rate leads to higher vibration, and it accordingly increases surface roughness. Zahoor [16] reported that surface roughness was greatly affected by the vibration amplitude of the machine tool and the axial cutting depth. The vibration levels are closely related to the cutting parameters and they increase with an increase in the cutting speed and feedrate[17 18]
Concluding from above mentioned studies, it is obvious that the influences of the cutting parameters and the induced vibration in machining are factors affecting machining performance. Therefore, this study was aimed to develop a mathematical model for predicting the surface roughness in end milling machining with considerationofthemachiningvibration.Thenmachining experiments using aluminum alloy were conducted under various combinations of cutting conditions. The surface roughnessofthemachined partswasexamined bymeans of the white light interferometer. Multivariable linear regression analysis was employed to determine the correlation between the surface roughness and the machiningparameters.Differentmathematicalmodelsare proposed for comparing the effectiveness in roughness predictions. The models are expected to be applied for improvethemachiningqualitywithdesiredproductivity
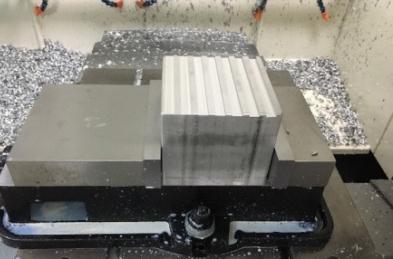
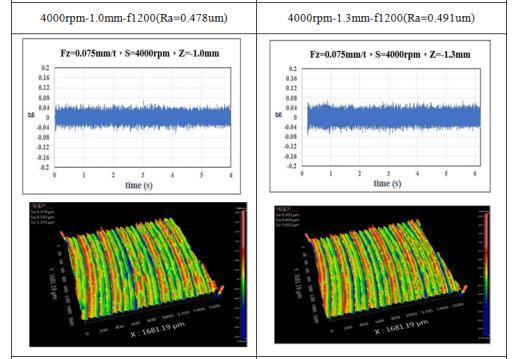
In this study, machining experiments were conducted on the milling machine using a 4 tooth tungsten carbide end mill. The workpiece material is an aluminum alloy (Al6061) with a size of 150 mm 150 mm 80 mm. Machining processes performed by full immersion of slot milling,asshowninFigure1.EachslotwasmilledintheX direction under different cutting parameters. The axial cutting depth (Z) was 1、1.5、2.0、2.5、3.0、3.5 and 4.0mm Thespindlespeed(S)wassetfrom3000to10000 rpm,increased by1000 rpm,respectively. Thelinearfeed rate (F) was set at 0.05 and 0.075 mm/tooth, corresponding to feed rate at 600 to 2400 mm/min,
respectively. During milling process, a tri axial accelerometer was mounted on the spindle housing to measure the vibrations in directions (X, Y, and Z) simultaneously.Foreachslotmachining,theaveragevalue taken from the time domain root mean square (RMS) values of the accelerations were calculated and used to compare the vibration extent of milling under different cutting parameters. There are a total of 240 machining conditions defined by the different levels of cutting parameters,including8spindlespeeds,2feedrates,and7 cuttingdepths.
Fig -1: Machiningtestandworkpiece.
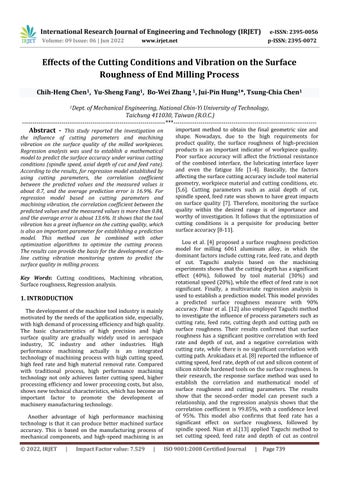
After machining tests, the surface roughness (Ra) was measured using white light interferometer (Optical Surface Profiler, Zygo, NewView™ 8000 Series). For each machined slot, roughness values were measured at five equallyspacedpointsalongthefeedingdirection,andthen, the average of these values was recorded for subsequent analysis. Figure 2 shows the morphologies of machined surfacesandthevibrationspectrumofthemillingspindle under specific machining conditions, which indicates that the cutting depth with a greater vibration level has a rougher surface. For example, for a cutting depth of 1.0 mmataspeedof4000rpm,Rawasmeasuredas0.478μm When the cutting depth was set at 1.3 mm, Ra =0.491 μm wasgeneratedunderaspindlespeedof4000rpm
Fig 2: Surfacemorphologies andVibrationspectrum.
The mathematical function of surface roughness (Ra) is proposedtoberelatedthecuttingdepth(Z),spindlespeed (S) and feed rate (F) by nonlinear model in the form as below:
Volume: 09 Issue: 06 | Jun 2022 www.irjet.net p ISSN: 2395 0072 © 2022, IRJET | Impact Factor value: 7.529 | ISO 9001:2008 Certified Journal | Page740
International Research Journal of Engineering and Technology (IRJET) e ISSN: 2395 0056
Volume: 09 Issue: 06 | Jun 2022 www.irjet.net p ISSN: 2395 0072
(1)
(2) This model can be expressed in logarithmic transformationform,asfollows
In above models, the regression coefficients βi (i=0,1,2) are to be estimated from experimental data by themethodofleastsquaresregressionanalysis. The effectiveness of the regression models were evaluated based on root mean square errors (RMSE), determination coefficient (R), and mean absolute percentageerror(MAPE).Thesevaluesaredeterminedby
(4)
(5)
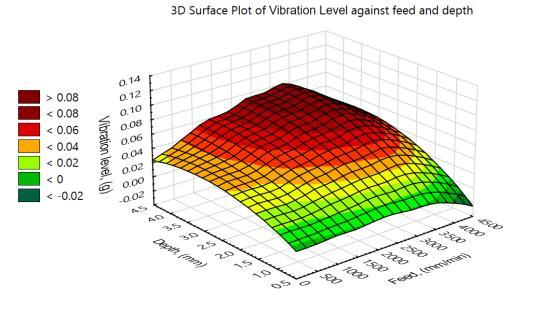
During machining, the best surface accuracy cannot be obtained in the steady cutting region. The most appropriatespindlespeed,feedrateanddepthofcutmust beselectedtoimprovetheprocessingqualityandachieve the effect of improving processing efficiency. Figure 4(a) and(b)showthedistributionofthevibrationamountwith theadjustmentofparameterssuchasspindlespeed,depth of cut and feed. Its variation trend is similar to surface roughness. When the specific speed is 6000 to 8000 rpm andthe depthofcutisabove3.0 mm, thevibration ofthe tool increases significantly, resulting in a significant increase in surface roughness. The same phenomenon, high feed rate (>2500 mm/min) and large depth of cut (above 2.5mm), the tool vibration increases significantly, whichaffectsthemachiningquality,andhencethesurface roughnessvalueincreases.
where t is the target value, y is the predicted value, and N is the number of samples in analysis.
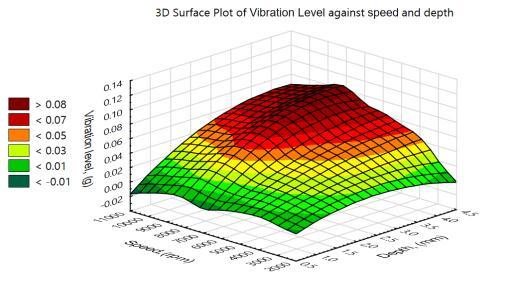
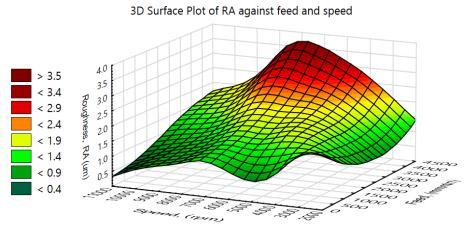
Figure 3 (a) shows the distribution of surface roughness over different speeds and cutting depths. It is found that at specific speed, a larger cutting depth generates poor surface roughness. At a specific depth of cut,thereisnospecifictrendintheeffectofrotationspeed onthesurfacethickness,butitisclearlyshownthatwhen thespeedisbetween6000and8000rpmandthedepthof cut is above 3.0mm, the surface thickness increases significantly. Figure 3(b) shows the surface roughness distribution at different feed rates and speeds. It is clear thatthesurfacefinishproducedbyhighfeedrates(>2500 mm/min) and rotational speeds between 6000 and 8000 rpmisalsosignificantlyworse.Overall,asthedepthofcut increases, the surface roughness also increases. When the feed rate is increased, the surface roughness will also increase relatively, which means that the feed rate has a certaininfluenceonthesurfaceroughness.Fromthedata, it is known that the better or worse surface roughness is not at the same location, so the most suitable machining parameters can be found by using the surface roughness.
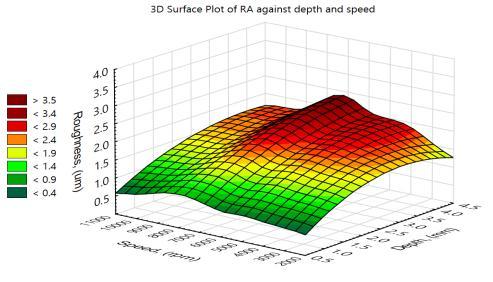
Fig 3: Distributionsofsurfaceroughnessunderdifferent cuttingconditions
Fig 4 Distributionsofmachiningvibrationunderdifferent cuttingconditions.
Volume: 09 Issue: 06 | Jun 2022 www.irjet.net p ISSN: 2395 0072
In this study, regression analysis was used to examine relationship between the independent variable and the dependent variable, and predict the dependent variable based on the change in the value of the independent variable. From the experimental results, the influence of cutting parameters and spindle tool vibration on the surface roughness or machining quality of the workpiece wasexamined.Therefore,whenestablishingtheprediction model of surface roughness, the effects of tool vibration was also be considered, and it was included as one of the independent variables. Through regression analysis, the influenceofeachparameterandtheirinteractionaswellas the machining vibration on surface roughness can be observed. Two multivariable nonlinear functions in different form were used to establish a rough prediction models, respectively Statistical coefficients of regression analysis are shown in Tables 1 to 2, and various surface roughnesspredictionmathematicalmodelsareasfollows:
(a)RAModel I (7)
(b)RAModel II (8)
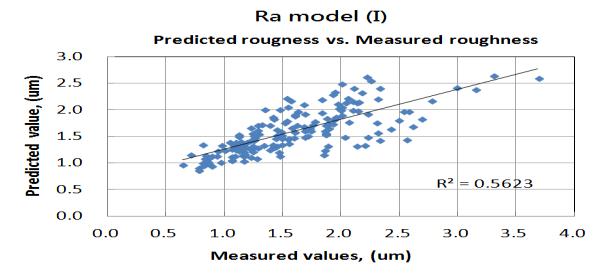
Theroughnessvaluespredictedbyregressionmodelare compared with the measured values,as shown inFigure5 For regression model I without including the vibration feature, the correlation coefficient between the measured and predicted values is above 0.75, and the average predictionerroris16.9%.
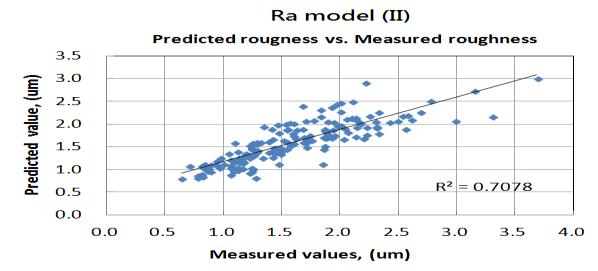
ForregressionmodelIIestablishedwithinclusionofthe vibration feature, the correlation coefficient between the measured and predicted values is around 0.84 and the average prediction error is 13.6%. The results show that theroughness models(RAII)constructedbyusingcutting parameters (speed, depth of cut and feed rate) and machining vibration have excellent accuracy in predicting surfaceroughness,whichissuperiorthanthemodelbased
only on the cutting parameters. This also verifies that surface quality can be substantially affected by tool vibrationinducedinmachiningprocess.
Table 1: Regressionparametersofnonlinearpolynomial RAmodel I
Parameters Coefficients Standard deviations P value
Intercept 953E 01 536E 01 771E 02
Cuttingdepth(Z) 8.04E 02 1.99E 01 6.87E 01
Spindlespeed(S) 560E 05 845E 05 506E 01 Feedrate(F) 768E 05 372E 04 837E 01 Depth speed(ZS) 530E 06 314E 05 867E 01 Depth feed(ZF) 700E 09 436E 08 873E 01 Feed speed(FS) 283E 04 138E 04 420E 02 Feed speedDepth (FSZ) 210E 08 162E 08 206E 01
Table 2: Regressionparametersofnonlinearpolynomial RAmodel II
Parameters Coefficients Standard deviations P value
Intercept 916E 01 439E 01 386E 02
Cuttingdepth(Z) 987E 02 163E 01 546E 01 Spindlespeed(S) 2.60E 05 6.93E 05 7.07E 01 Feedrate(F) 880E 05 305E 04 774E 01 Depth speed(ZS) 4.80E 05 2.62E 05 7.05E 02 Depth feed(ZF) 149E 08 358E 08 678E 01 Feed speed(FS) 3.08E 04 1.13E 04 7.17E 03 Feed speedDepth (FSZ) 180E 08 133E 08 179E 01 Vibration (VB) 1.08E+01 1.21E+00 1.22E 15 Fig
This research was aimed to establish a mathematical predictionmodelforthesurfaceroughnessofworkpieces. The constructed algorithm can feed back vibration signal detectedinmachiningprocess tothemodeltopredictthe roughness of the machined surface and determine whether it meets the required quality without off line measurements The roughness prediction model can be served as a reference for optimizing the processing parametersoftheprocess.
Based on the current research results, the following conclusionsaredrawn:
International Research Journal of Engineering and Technology (IRJET) e ISSN: 2395 0056
Volume: 09 Issue: 06 | Jun 2022 www.irjet.net p ISSN: 2395 0072
1. Within the experimental parameters, as the depth of cut increases, the surface roughness also increases gradually. When the feed rate is increased, the surface roughness will also increase relatively, which means that the depth of cut and the feed rate have a certain influenceonthesurfaceroughness.Thereisnospecific trend in the effect of spindle speed on the surface roughness, but it clearly shows that the surface roughness increases significantly when the spindle speedis between 6000and 8000rpmand thedepth of cutisabove3.0mm.
2. The results show that the roughness model (Ra II) based on cutting parameters and machining vibration have excellent prediction performance as compared with model based only on the cutting parameters. This clearlyverifiesthattoolvibrationinducedinmachining processhaveinfluentialeffectsonthesurfacequality.
[1] H.S., Safari, Sharif, S. Izman, H. Jafari, High Speed Dry End Milling of Ti 6Al 4V Alloy towards Nano scale Surface Roughness, Journal of Applied Sciences Research,8(11):5280 5284,2012.
[2] A.R.C. Sharman, D.K. Aspinwall, R.C. Dewes, P. Bowen, Workpiece surface integrity considerations when finishturningtitaniumaluminide,Wear,249:473 481, 2001.
[3] F. Ghanem, C. Braham, M.E. Fitzpatrick, H. Sidhom, Effect of near surface residual stress and microstructure modification from machining on the fatigue endurance of a tool steel, Journal of Materials EngineeringandPerformance,11(6):631 639,2002.
[4] M.S. Lou, J.C. Chen, C.M. Li, Surface Roughness Prediction Technique For CNC End milling, Journal of IndustrialTechnology,15(1):1 6,1998.
[5] K. Kadirgama , M.M.Noor , N.M.Zuki.N.M , M.M. Rahman , M.R.M. Rejab , R. Daud , K. A. Abou El Hossein., Optimization of surface roughness in end milling on mould aluminium alloys (AA6061 T6) using response surface method and radian basis function network.Jourdan Journal of Mechanical and IndustrialEngineering,2(4):209 214,2008.
[6] P.G., Benardos, Vosniakos, G.C., Prediction surface roughness in machining review. International Journal of Machine Tool and Manufacture. 43: 833 844,2002
[7] M. Aruna., D. Dhanlaksmi., Design Optimization of Cutting Parameters when Turning Inconel 718 with Cermet Inserts, World Academy of Science, EngineeringandTechnology,61:952 955,2012
[8] R. Arokiadass, K. Palaniradja, N. Alagumoorthi, Predictive modeling of surface roughness in end milling of Al/SiC metal matrix composite, Archive of AppliedScienceResearch,3(2):228 236,2011.
[9] E. Kuram, B. Ozceik, E. Demirbas, E. S, Effects of the Cutting Fluid Types and Cutting Parameters on Surface Roughnessand ThrustForce, WorldCongress onEngineering(WCE),2:978 988,2010.
[10] M.Soković,K.Mijanović, Ecologicalaspectsofcutting fluids and its influence on quantifiable parameters of the cutting processes, Journal of Materials Processing Technology,109:181 189,2001.
[11] P.N.Rao,Manufacturingtechnology:metalcuttingand machine tools, New Delhi :Tata McGraw Hill Publication,2000.
[12] A. M. Pinar, Optimization of process parameters with minimum surface roughness in the pocket machining of AA5083 aluminum alloy via Taguchi method.Arabian Journal for Science and Engineering,38(3),705 714,2013.
[13] C.Y. Nian, W.H. Yang, Y.S. Tarng., Optimization of Turning Operations with Multiple Performance Characteristics , Journal of Materials Processing Technology,95(1 3):90 96,1999.
[14] S. S. Bhogal, C. Sindhu, S. S. Dhami, & B. S. Pabla, Minimization of surface roughness and tool vibration in CNC milling operation.Journal of Optimization,1 13:ID192030,2015
[15] C. David, D. Sagris, E. Stergianni, C. Tsiafis, I. Tsiafis, Experimental analysis of the effect of vibration phenomena on workpiece topomorphy due to cutter runout in end milling process Machines, 6(3): 27, 2018.
[16] S.Zahoor,N.A.Mufti,M.Q.Saleem,M.P.M.Mughal,A. M. Qureshi, Effect of machine tool’s spindle forced vibrations on surface roughness, dimensional accuracy, and tool wear in vertical milling of AISI P20.International Journal of Machine Tool and Manufacture, 89(9 12):3671 3679,2017
[17] M.S.H.Bhuiyan,I.A.Choudhury,Investigationoftool wearandsurfacefinishbyanalyzingvibrationsignals in turning Assab 705 steel.Machining Science and Technology,19(2):236 261,2015.
[18] C.L.Kiew,A.Brahmananda,K.T.Islam,H.N Lee,S.A. Venier, A. Saraar, H. Namazi Analysis of the relation between fractal structures of machined surface and machine vibration signal in turning operation.Fractals, 28(1):2050019,2020
© 2022, IRJET | Impact Factor value: 7.529 | ISO 9001:2008 Certified Journal | Page743