International Research Journal of Engineering and Technology (IRJET) e ISSN:2395 0056

Volume: 09 Issue: 06 | June 2022 www.irjet.net p ISSN:2395 0072
International Research Journal of Engineering and Technology (IRJET) e ISSN:2395 0056
Volume: 09 Issue: 06 | June 2022 www.irjet.net p ISSN:2395 0072
The past two years have been very volatile, unpredictable, and even life changing for many people around the world. The pandemic has caused many to re think and recalibrate choices which in turn has had a drastic effect on their happiness.Hence,thisworkisanattempttoanalyzepeople’s happiness in different countries and regions. The main objective is to focus on the changes that have occurred or have been caused through 2019 to 2021. The six factors on whichanalysishasbeendoneareGDPpercapita,freedomto makelifechoices,Generosity,SocialSupport,Lifeexpectancy, and perception of Corruption. Since people’s mental and physical health both are affected due to the Covid 19 pandemic. This reporthelps us toget toknowthesituations indifferentcountries. How different countries’Governments controlled and handled the covid 19 situation. How the actions of their government have affected the happiness of their country. How the support from family and friends can affect one’s happiness. The world happiness report ranks a totalof149countriesaccordingtohowpeopleperceivetheir happiness. Also, how much people’s happiness differs from pre covid time to postcovid. This work extensively uses Tableau for the univariate analysis of the happiness report dataset.
To what extent has the covid 19 pandemic affected happiness,prosperity,andwell beingaroundtheworld?
Covid 19 has caused a rapid change in the well being of people around the world. However, this change hasn’t been evaluated/measuredyet.Anevaluationofsuchmeasureswill help us understand the effect of the Covid 19 pandemic on a country’s citizens, economy, happiness and other such existingfactors.
Firstly, it is important to understand the dataset and the environment we will be conducting the analysis on.I will be conducting my study on the dataset, ‘World Happiness Report 2021’ by Ajaypal Singh. Following is the link to the
data: https://www.kaggle.com/ajaypalsinghlo/world happinessreport 2021. The main attribute of the dataset is the ladder score which determines the rank of a country in terms of happiness. I will be using Tableau extensively for thisanalysis.
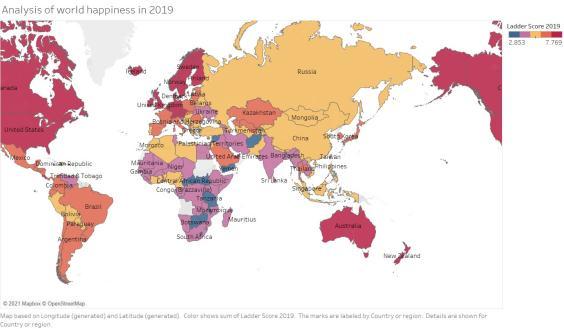
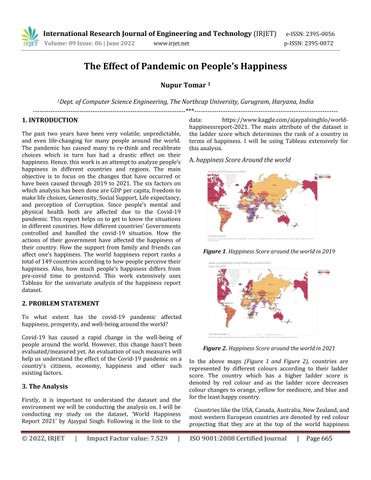
In the above maps (Figure 1 and Figure 2), countries are represented by different colours according to their ladder score. The country which has a higher ladder score is denoted by red colour and as the ladder score decreases colourchanges to orange,yellowformediocre,andblueand fortheleasthappycountry.
CountriesliketheUSA,Canada,Australia,NewZealand,and most western European countries are denoted by red colour projecting that they are at the top of the world happiness
International Research Journal of Engineering and Technology (IRJET) e ISSN:2395 0056
Volume: 09 Issue: 06 | June 2022 www.irjet.net p ISSN:2395 0072
chart. Russia and China are in the middle, and Sub Saharan countriesandIndiaabideatthebottomofthechartbeingthe least happy countries. Afghanistan is the last country in the worldhappinessreportbeingtheleasthappycountry.
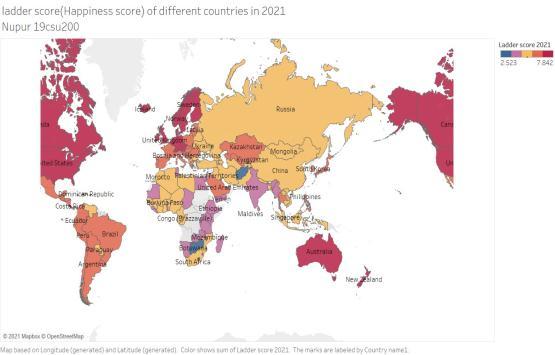
An important observation that I made through this graph is thatthecountrieswithhighfreedomtomakelifechoicesare mostly western European countries denoted by grey bars and with the least freedom to make life choices are mostly sub Saharancountriesdenotedbybrownbars.
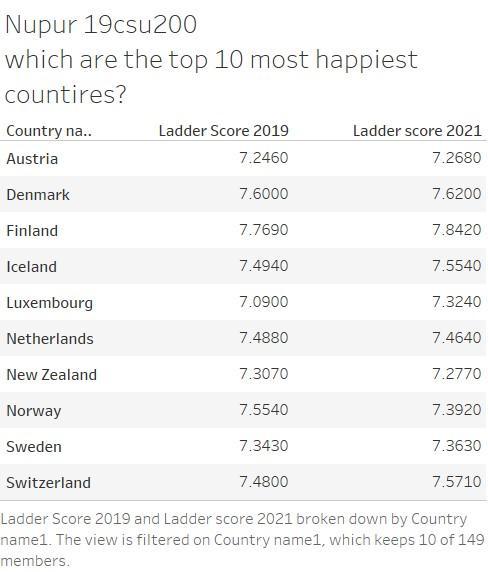
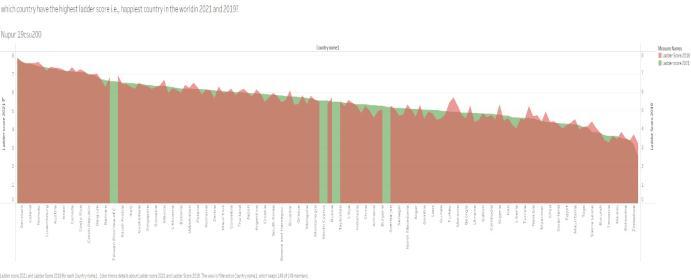
Figure 3 Which countries have the highest ladder score
Inthisgraph(Figure3),theredareagraphshowstheladder score of different countries for the year 2019 i.e., before covid,andthegreenareagraphshowsfortheyear2021i.e., after covid. With the above analysis, the top 10 happiest countries aroundtheglobearegiveninthe belowtable.The countries mentioned below are mostly western European countries.
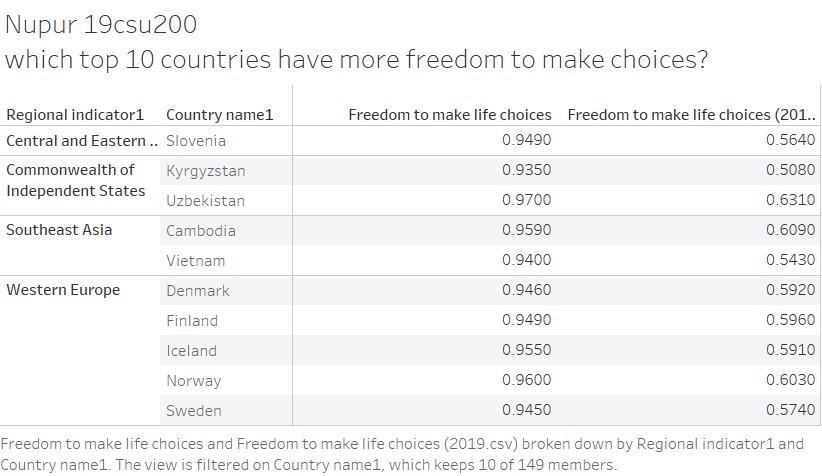
Below mentioned are the top 10 countries that have more freedom to make life choices. We can observe that the countries of western Europe are more in number than any other. Hence, in this, we can conclude freedom to make life choicesonourownhavealargeeffectonpeople’shappiness.
Table 1. Top 10 countries ranked by most happiest to least
We can clearly see in the table above that the country with the highest happiness index score is Austria, followed by Denmark,FinlandandotherEuropeancountries.
Anotherfactorthataffectstheworld’shappinessis“Freedom to make life choices”. The above graph shows the score for freedomtomakelifechoicesfordifferentcountries.
Table 2 Top 10 countries ranked by most freedom to make choices to least
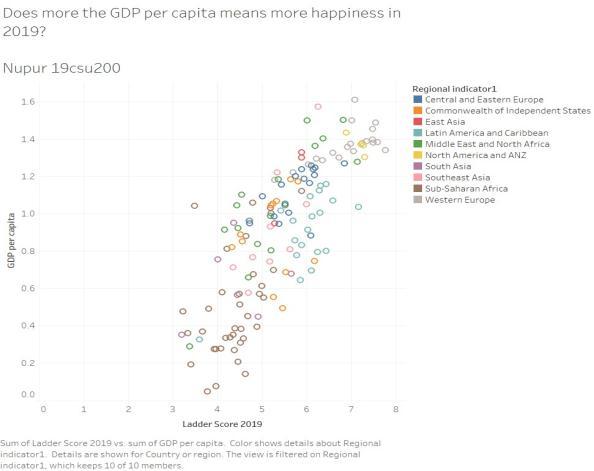
Another factor that affects world happiness most is GDPper Capital that we can observe in the following graphs of years 2019and2021.Thebelowscatterplots(Figure5&6) show the relation between the ladder score of 2019 and the score ofGDPpercapitaofthesameyear.
© 2022, IRJET | Impact Factor value: 7.529 | ISO 9001:2008 Certified Journal | Page666
International Research Journal of Engineering and Technology (IRJET) e ISSN:2395 0056
Volume: 09 Issue: 06 | June 2022 www.irjet.net p ISSN:2395 0072
families and friend. In the time of crises, only family and friendsstandwithyouandforyou.
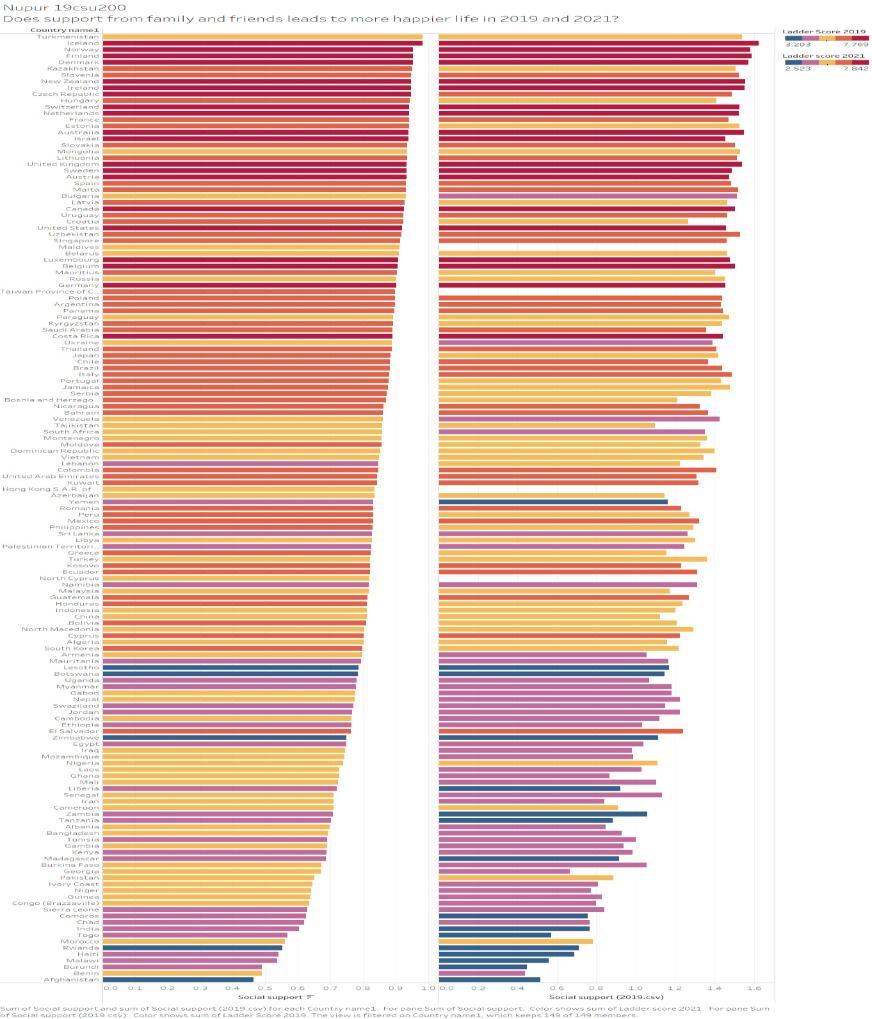
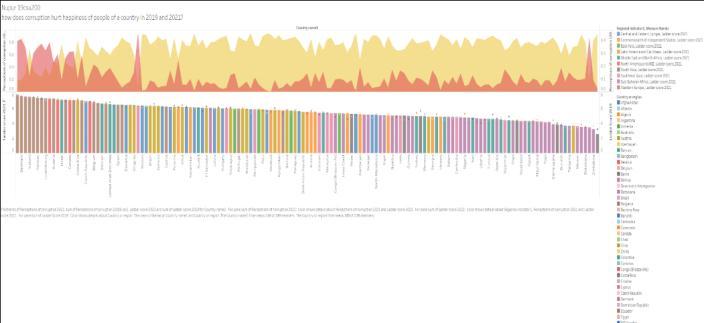
Inthefollowinggraph(Figure7),Ihavedonethecomparison betweentheyears2019and2021amongdifferentcountries that how much the support from family and friends effects thehappinessofpeople.Theleftchartshows representation for 2021 year and the right one shows for 2019. We can observe that many countries score off social support factor increasedduringthepandemic.Boththechartsdepictingthe social support score in decreasing manner and the colour sequencedepictsthehappinessindex.Redandorangecolour areforthehigh happinessscoreandpurpleandbluearefor lowhappinessscore.
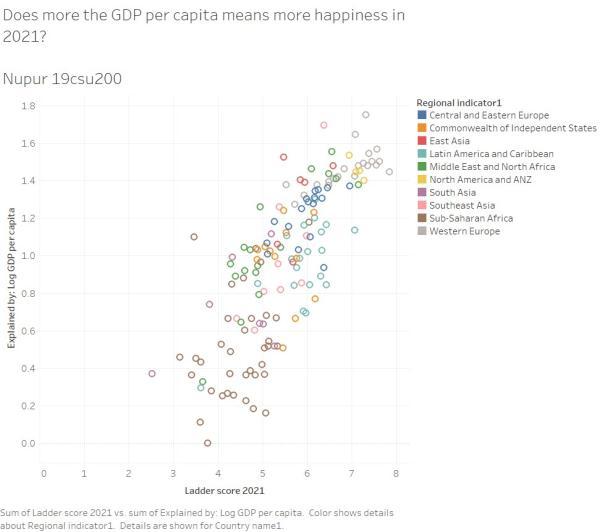
Thisscatterplotshowstherelationbetweentheladderscore of 2021 and the score of GDP per capita of the same year. A positivecorrelationis observed between thetwofactors and countries with higher GDP per capita tend to yield a higher ladder score. For instance, Western European countries are observedtohaveaGDPhigherthan1.4,whichwhenrealised on the x axis gives a ladder score higher than 6 on the happinessindexdenotedbygreycircles,andGDPlesserthan 0.6givesaladderscorelessthan5forSub Saharancountries denotedbybrowncircles.
The Next factor that comes is the support from the family members and friends. We all have seen in past two to three year, during covid that how important is the support of our
International Research Journal of Engineering and Technology (IRJET) e ISSN:2395 0056
Volume: 09 Issue: 06 | June 2022 www.irjet.net p ISSN:2395 0072
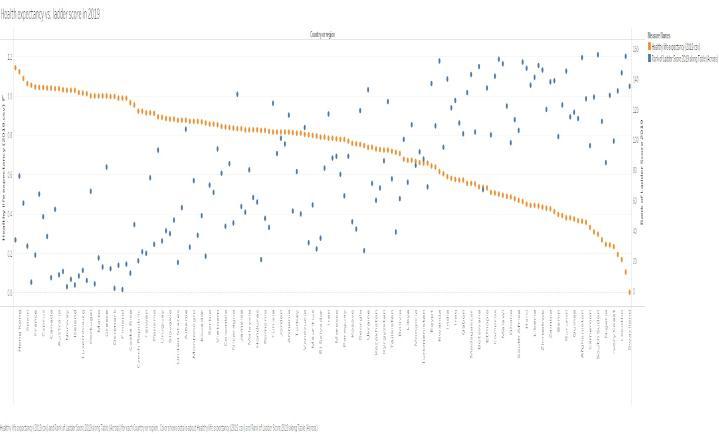
Another dependent variable is the life expectancy of people. How the life expectancy effects the happiness of people as during pandemic a lot of people suffers between the life and death situations which makes it am important factor to considerwhenanalyzingpeople’shappiness.
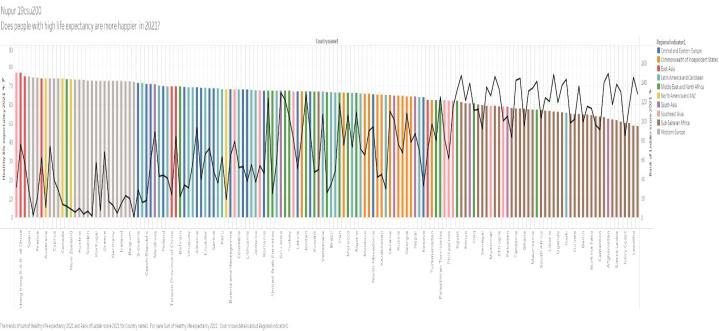
For the year 2021 visual (Figure 8), I used the bar chart for the life expectancy score and line chart for pointing the happiness score for each country. We can observe that grey bars which is for western European countries have high life expectancy and also ranks high in happiness index. Sub Saharan countries which is denoted by brown collared bars arelowonlifeexpectancyandalsoonhappinessindex.
Thisconcludes thatthelifeexpectancyisanimportant point toconsideringpeople’shappiness.
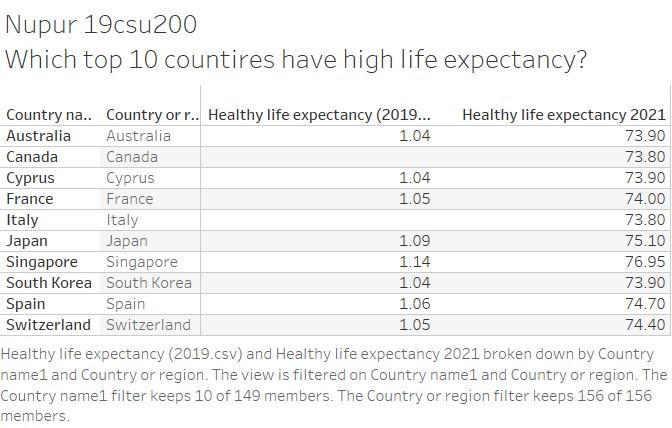
Inthefollowing scatter plot (Figure 9) sameis visualized for the year 2019. Countries are on top of the happiness index whentheyhavehighlifeexpectancyandviceversa.
Thisconcludesthatthelifeexpectancyisanimportantfactor to consider in people’s happiness. Below are the top 10 countries which have high life expectancy score for birth years2019and2021
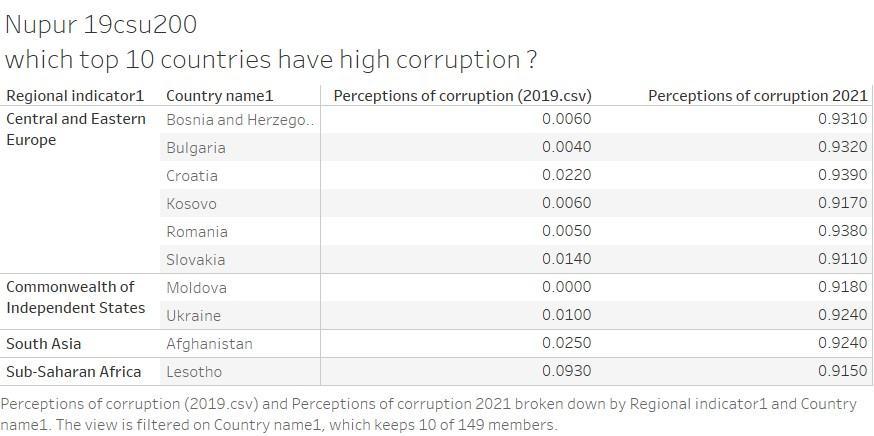
Another factor that comes into consideration is the perception of corruption. People tend to abuse the power that they behold for their own gain which leads to corruption.Duringpandemic,manygovernmentofficialsalso tend to be corrupted. A general trend that was visible in the figure below (figure 10) was that most countries had higher levels of perceptions of corruption in 2021 as compared to 2019. However, there was a particular exception/outlier in this trend: Rwanda. In 2019 Rwanda had a perception of corruption score of 0.411. Where as in 2021 this score had decreasedtoamere0.1670.
Below (Table 4) is a list of the top 10 countries with high corruption rates. We can see here that Central and Eastern European countries such as Bosnia and Herzego, Bulgaria, Croatiaetc.haveveryhighperceptionsofcorruption.
International Research Journal of Engineering and Technology (IRJET) e ISSN:2395 0056 Volume: 09 Issue: 06 | June 2022 www.irjet.net p ISSN:2395 0072
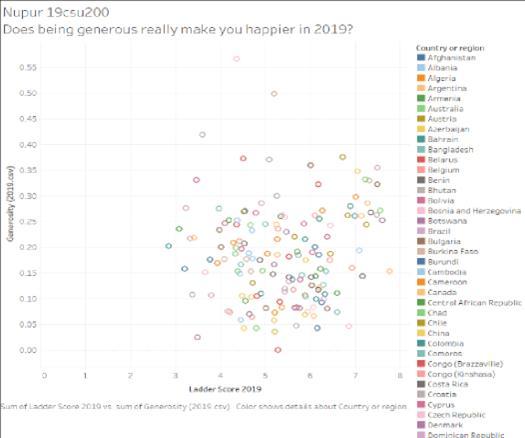
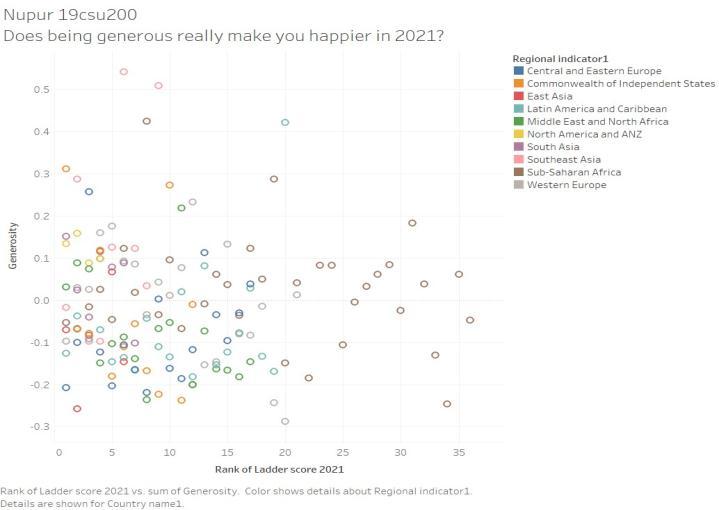
Generosity vs Ladder Score also had a negative correlation. Where generosity was indirectly proportional to the ladder score. A country with lower generosity had a higher ladder score. A higher ladder score means a higher rank on the happinessindex.
All in all, it can be said that both in 2019 and 2021 low generosityresultedinahigherrank.Generosityandrankare indirectlyproportional.
An important part of this study was finding the relation betweenGenerosityandRankofladderscore.Asyoucansee in figure 11 below there is a negative correlation between these 2 variables. It was observed that countries with lower generosity scores had a higher rank among the ladder score. Moreover, most countries with higher generosity scores also had a higher rank among the ladder score. However, there were exceptions here again. For instance, Indonesia had the highest generosity score at 0.5420 also had a rank on the ladderscoreof6.
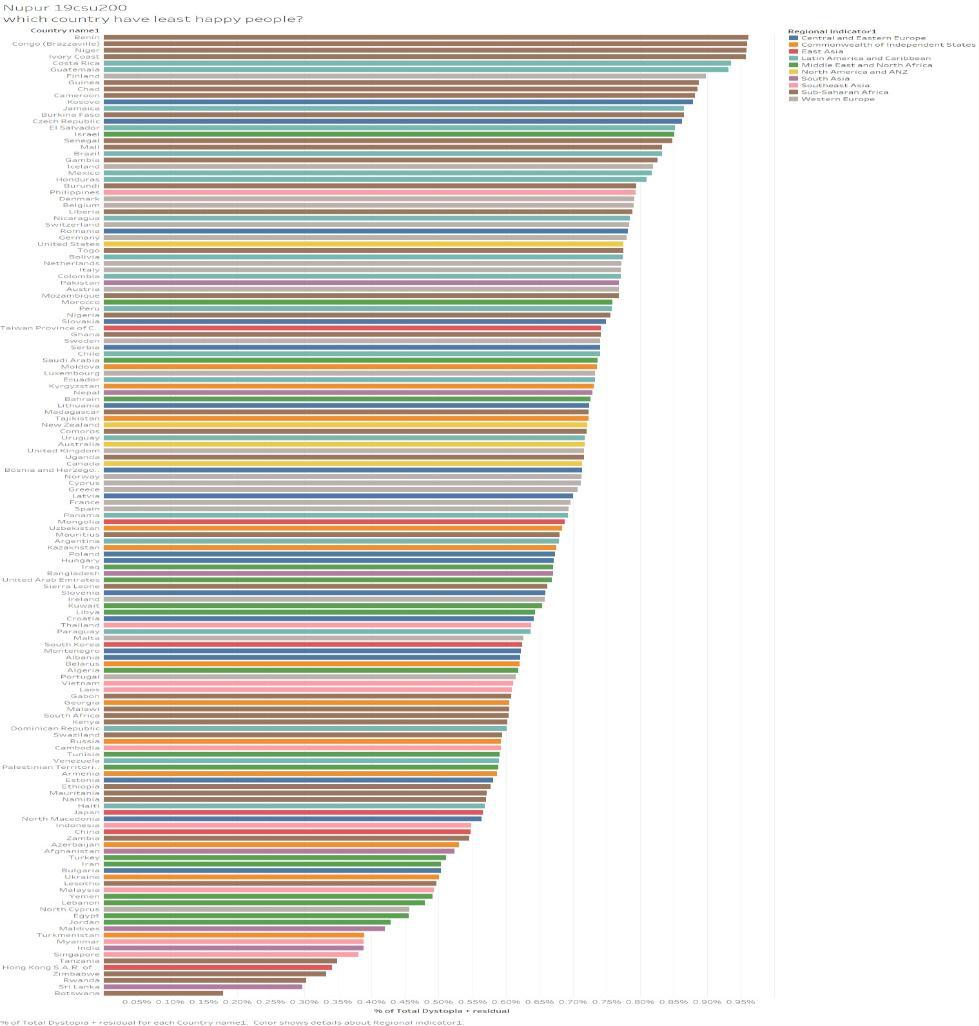
At the end, an additional factor named dystopia+residual score, the term dystopia is an imaginary country with least happy people residing in it. Country where the economy is less,lifeexpectancyisnotgood,havehighcorruptiondoesn’t have much freedom such as Afghanistan or other Sub Saharancountrieshelpustogettoknowthecountrieswhich are residingat the bottom ofthehappiness index. As wecan observeinfigure13,atthetopmostofthecountriesarefrom sub Saharan region which depicts that the people are not happylivingthere.
Ascompared to2021,in2019(Figure12) thedata hadbeen calculated using a different metric, when compared to 2021. On one hand where ranks were present in 2021, 2019 had a ladder score. After a thorough study, it was observed that
International Research Journal of Engineering and Technology (IRJET) e ISSN:2395 0056
Volume: 09 Issue: 06 | June 2022 www.irjet.net p ISSN:2395 0072
All in all, the increase in Life Expectancy, Social support, freedom to make life choices and GDP per capita, makes the people living there much happier. The increase in the Perception of corruption decreases the people’s happiness residing in that country. Generosity does not play any significantrolewiththehappinessofpeopleinthecountry.
https://public.tableau.com/app/profile/nupur4841/viz/ worldhappinessreport_16381044192110/Sheet2
[1] Singh, Ajaypal. “World Happiness Report 2021.” Kaggle, Kaggle, 22 Mar. 2021, https://www.kaggle.com/ ajaypalsinghlo/world happiness report 2021.
[2] https://byjus.com/free ias prep/world happiness report/#:~:text=India%20has%20ranked%20139%20in,ran k%20in%202020%20was%20144.
[3]https://worldhappiness.report/
[4] https://www.nationalheraldindia.com/national/world happiness report 2021 india ranks 139 out of 149 pakistan bangladesh china happier finland happiest
[5] https://www.drishtiias.com/daily updates/daily news analysis/world happiness report 2021
[6] https://currentaffairs.adda247.com/india ranks 139th in world happiness report 2021/
After a thorough study and measures of the dataset, I found out that six key factors play a significant role in shaping the happinessofthecountry.Thefollowingfactorsare:
[7]https://en.wikipedia.org/wiki/World_Happiness_Report
[8] https://www.firstpost.com/india/india ranked 139 out of 149 countries in uns world happiness report 2021 9462241.html
[9] https://www.deccanherald.com/national/world happiness report 2021 india ranks 136 out of 149 finland tops 964108.html