International Research Journal of Engineering and Technology (IRJET) e ISSN:2395 0056

Volume: 09 Issue: 05 | May 2022 www.irjet.net p ISSN:2395 0072
International Research Journal of Engineering and Technology (IRJET) e ISSN:2395 0056
Volume: 09 Issue: 05 | May 2022 www.irjet.net p ISSN:2395 0072
1Student, Department of Electrical Engineering Jabalpur, M.P
2Assistant professor, Department of Electrical Engineering Jabalpur, M.P ***
Abstract The load shedding scheme is vital for voltage and frequency stability. It is an important way for operators to keep the power system stable and reliable when it is subjected to severe disturbances. When the system frequency or voltage falls below a predetermined range, load shedding based on critical undervoltage or underfrequency protects the system. This paper presents a load shedding technique that stabilizes both undervoltage and underfrequency conditions. The scheme is developed in MATLAB where Frequency response model is used with reference to enhancement of under frequency. Voltage stability is achieved considering the Fast voltage stability index as well as line stability index. The presented method is verified in an IEEE 6 bus system which is developed in power world simulator.
Words: Frequency,Voltage,critical,Load
Themostimportantaspectofanelectricalpowersystem under an overload or imbalanced scenario is the ability to balance energy demand and power generation shortfalls [11] Because of real and reactive power inadequacies, severe system disturbances such as generation insufficiency, tripping of the primary generating unit, and overload contingency would result in under frequency and low voltage. Electrical islanding might occur as a result of cascaded outages and area isolation. Due to a lack of producing units in these electrical islands, system frequencies will continue to fall, causing the generation unit to trip under frequency protective relays [3, 16]. The most significant fact of frequency response in an electrical power system is to give important integrity and security. Frequency responseisbasicallythefunctionalityofapowersystem to secure a fast alternate in frequency following a large disturbance.Alackofsystemfrequencyinstability might result from an unexpected mismatch between system generation andload demand Normally,thevoltageof a powersystemisstable;however,whenamalfunctionor disturbance occurs, the voltage becomes unstable and unpredictable. Frequency and voltage instability in the worst casecircumstances,mightforcethesystemtoshut down. Load shedding is the most effective approach for the system to deal with transmission line overloading
during a contingency [5] To avoid excessive load shedding,theamountofloadtobeshedmustbekeptto a minimum value. Time, the amount of load to unload, and place to discharge are the three key considerations that go into load shedding [2] Load shedding can assist reduce the electrical system's severely loaded branches, decreasing the danger point of frequency and voltage instability[8].
Thispaperpresentsanadvancedloadsheddingstrategy thatcombinesvoltageandfrequencystability.Frequency response models is a kind of computational approach that uses real time system variables to determine load shedding amount. The fast voltage stability index (FVSI) is implemented to determine the voltage of contingency evaluation in a power system caused by a line loss [10] It's a straightforward mathematical strategy for analysingvoltagestability.Thestabilityandcontingency analysesis carried outusingtheIEEE6 bus testsystem, whichisconstructedinthepowerworldsimulator.
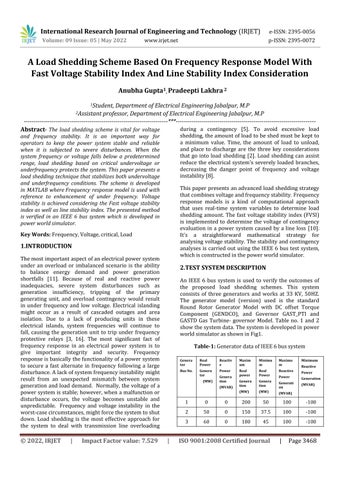
An IEEE 6 bus system is used to verify the outcomes of the proposed load shedding schemes. This system consists of three generators and works at 33 KV, 50HZ. The generator model (version) used is the standard Round Rotor Generator Model with DC offset Torque Component (GENDCO), and Governor GAST_PTI and GASTD Gas Turbine governor Model. Table no. 1 and 2 showthesystemdata.Thesystemisdevelopedinpower worldsimulatorasshowninFig1
International Research Journal of Engineering and Technology (IRJET) e ISSN:2395 0056
Volume: 09 Issue: 05 | May 2022 www.irjet.net p ISSN:2395 0072
Table 2: BusdataofIEEE6bussystem
Available electricity is dispatched to a limited consumer while other consumers' loads are shed in a pre scheduledstage.[14]
1 SB 1.05 0 0 0 1.1 0.9 2 PV 1.05 0 0 0 1.1 0.9 3 PV 1.07 0 0 0 1.1 0.9 4 PQ 1 0 70 70 1.1 0.9 5 PQ 1 0 70 70 1.1 0.9 6 PQ 1 0 70 70 1.1 0.9
Electricity is a necessary energy carrier for human activities, so the electric utility company must provide a stable and consistent supply of high quality electricity. This can be done by regularly monitoring and assessing the security of the power system, as well as building a propercontrolsystem.
3.2 Electric load can be categorized according to priority
Vital load is thatcustomers who cannot afford any loss of power, such as hospitals, are considered crucial loads.
Non vital load is that not necessary for customers. Considernonvitalloadmaybefollowedcriticalpathof the system which leads to gradually unstable state of thesystem.
Table 3: classification of loads as vital and non vital loads
Notinstantlyused Instantlyused Lead to correctly predicted branch Lead to mis predictedbranch
Fig -1:IEEE6bussystemdevelopedinpowerworld simulator
3.1 Load shedding based on the circumstances
(i) Forced outages
Load shedding is carried out automatically as a last line of defense in order to avoid the black out during severe perturbationinthesystem.Hereloadsheddingimproves the stability of the system by enhancing the system voltageprofileandthesystemfrequency.[15]
Underfrequencyloadshedding(UFLS)mustbecarried outquicklyinordertopreventpowersystemfrequency drop by reducing power system load. For this reason, frequency threshold values are specified to begin underfrequency load shedding. The minimum suitable frequencyisdetermined by thesystem equipment. The standard frequency range for the system is 49.5 Hz to 50.2 Hz [1] Frequency response model is used for under frequency load shedding scheme. The rate of changeoffrequencydrop,whichisdirectlyimpactedby the load generation mismatch, must be used to accomplish UFLS in this scheme, as shown in equation (1).
International Research Journal of Engineering and Technology (IRJET) e ISSN:2395 0056
Volume: 09 Issue: 05 | May 2022 www.irjet.net p ISSN:2395 0072
companies to reduce voltage instability and restore voltage to its nominal level [9]. Electric power systems are currently approaching their stability limit. As a result,thisproblemrepresentsasignificantchallengefor power system stability and control. The main source of instability is the power system's inability to convert reactive power to load, which may be avoided by increasingthestaticvoltagestabilitymargin.
Fig. 2:Simplifiessystemfrequencymodel
Where Pd: Loadgenerationmismatch H: Inertiaconstant
Oncetheloadgenerationmismatchiscalculated,load shedding action can be initiated using Eq. (2) derived from the SFR model in “Fig.1” as shown [5]. The load shedding amount can be calculated with respect to the frequencyresponseofthesystem.Equation(2)showsthe response of the simplified system frequency response modelbyusingLaplaceTransform.
( ) [ ( ] (2)
Fast Voltage Stability Index The power transmission idea of a single line model is used to calculate line stability indices. The primary goal of employing voltage andlinestabilityindexesistolocatethecollapsepointin a complicated linked power system. These indices are used to access power system voltage and line stability. Thesevoltagestabilityindicescanbeappliedtoeithera bus or a line. The stability of linked buses (receiving buses) on that line is indicated by the line stability [12]. The load shed, however, is done on a bus or line with a highindexvalue.
Where,
The load shedding amount is calculated based on minimum allowable frequency that is taken as 48Hz and minimumnon sheddingoverload
(ii) Under voltage load shedding Scheme using Fast voltage stability index and line stability index
The purpose of the undervoltage load shedding scheme is to provide safeguard of the electricity system against voltage breakdown Essential power shortages have occurredinrecentyearsasaresultofvoltageinstability, according to studies. Voltage instability is frequently causedbyaforcedoutageofthegeneratorortheline,as well as overloading. When this happens, the reactive energy demand for transmission lines fluctuates dramatically, potentially resulting in a blackout. The undervoltage load shedding strategy is used by power
In a large power system, the fast voltage stability index (FVSI) may be used to estimate the point of voltage collapse, critical zones, and maximum permitted load. It may also be used to determine the maximum load capacity of a power system, as well as weak buses and themostvitallineinaninterconnectedsystem.
TheFastvoltagestabilityindexmustbeusedtoidentify the state of voltage stability in a power system. This index can be found in either a bus or a line. The FVSI (FastVoltageStabilityIndex)isappliedinline.


The FVSI is derived from a two bus system model (Fig. 3). Here P, Q and S are the active, reactive and apparent power respectively. The sending end and receivingendbusarerepresentedby i and j respectively.
Vi & Vj voltage at sending and receiving bus (ith & jth) buses
International Research Journal of Engineering and Technology (IRJET) e ISSN:2395 0056
Iij = Branch current of every line connecting (ith & jth) buses
Thevoltagequadraticequationonthereceivingendbus atthesystemisusedtocalculatethefastvoltagestability index.Hereaneachlineimpedanceisreferredtoas
Zij =R ij+jX ij (3) ( ( ) ( )) ( ) =0 (4)
Here we find real roots for from eq. 4, Equation 7 is discriminantvalueissetgreaterthanorequalto‘0’
[( ( ) ( )) ]2 ( ) ≥0 (5) ( ( ) ( )) ≤ 1 (6)
When value is very small then, in this condition , thenRij Sin &Xij Cos (7)
Where Zij =lineimpedance
Xij =linereactance
Qj =Atthereceivingend,reactivepower Vi =Sendingendvoltage
For the power system to operate efficiently, the FVSI value must be less than one. The value around one indicates that the line is approaching the point of instability,resultinginvoltagecollapseinsidethesystem [7]
Line Stability Index (Li j) The power transmission concept on a single line is used to calculate the line stabilityindex.Atwo bussystemisdepictedinFigure4. Li j is the line's stability index. It's used to calculate the stability index for each bus line. The line stability index measures the line's stability for linked buses (receiving buses). This model's line stability index may be written as [ ( )] (8)
Tokeepthelinestable,thevoltagecollapsemarginmust be less than one. The voltage collapse margin directly affectedbythelinestabilityindex.
[ ( )] X,Q,V, 1
FVSI Z,Q,V,X 1
Table no. 4 represent voltage stability indices formulation which is used to determine the voltage collapsepointatreceivingendatbusorline.
This paper's load shedding scheme combines both underfrequency and undervoltage techniques. Figure 4 depictsthetechniqueforapurposedloadsheddingplan. Thestepsfollowedareasbelow
Theamountofloadsheddingistheoutputofthe simplified frequency response model as shown in figure 2 The frequency response is studied usingEq.2.
Once an unexpected overload is introduced in the system, amount of load shedding is calculated.
Before applying load shedding scheme. The loadsaredividedintotwocategoriesvitalload& non vital. Vital load is that load shed is important for the customers Non vital load is firstpriorityloadsheddingsteps.
After application of unexpected load of the system, each line’s FVSI & line stability index valueisnowcomputed.Thelinewiththeclosest valueto1isconsideredunstable,and50%ofthe load shedding amount is shed in the bus that correspondtothatline.
Repeattheabovestepsuntilall ofthelineshave FVSI&linestabilityindexvaluesclosetozero.
Volume: 09 Issue: 05 | May 2022 www.irjet.net p ISSN:2395 0072 © 2022, IRJET | Impact Factor value: 7.529 | ISO 9001:2008 Certified Journal | Page3471
An IEEE 6 bus system developed in power world simulatorisusedtoperformthepresentedscheme.This system is tested to ensure that it is effectiveness of the scheme.
The amount of load shedding mentioned in this paper was determined using a frequency response model. The total load shedding amount 97.86MW for 100 MW
International Research Journal of Engineering and Technology (IRJET) e ISSN:2395 0056
Volume: 09 Issue: 05 | May 2022 www.irjet.net p ISSN:2395 0072
unexpected load. The amount of load shedding divided into4section Theloadsheddingamountare48.86MW, 24.46MW,12.23MW,12.23MWtheseamountsareused for load shedding scheme. The load shedding amounts fora 60 MW unexpectedloadare 24.46MW, 14.44MW, 12.23 MW, & 12.23 MW, sequentially. These are the valuesthatwereappliedinthisload sheddingsystem.
Anunexpectedoverloadof100MWisappliedfirstatbus no.6for1second.Thefrequencydropsto49.6Hzin1.9 seconds and afterwards stabilizesat 50.40 Hz, which is outside the system's stable range. Furthermore, the voltageinthesystemcontinuestofall.AccordingtoSFR, theamountofloadsheddingis97.86MW
Determined the FVSI value of each line at this moment.IftheFVSIvalueofa transmissionline is near to one, the line is considered unstable. Table5representsthestepsinFVSIvaluewhen the load is suddenly increased to 100 MW. CalculatetheFVSIvalueforeachline,andatthis moment,non vitalloadisdeterminedatline(5 6), which is close to one of the others. Perform the 50 percent load shedding of 48.93 MW at busno.5'1at1.1secondatthismoment.
There is still a persistent decrease in frequency and voltage and an overload of 51.11 MW, therefore againdeterminetheFVSIvalueofeachtransmission line at this moment. The non vital load in line (5 6) is around 1. As a result, the remaining 50% of load shedding, total 24.46 MW,isremovedat bus no. 5'1 at1.2sec.
Iff<48HZ & V<0.9pu
Yes
Determinetheloadshedding amountbyfrequencyresponse model
PerformFastvoltagestability indexofeachline
CalculateFVSI&LineIndexvalueof eachline
No
ClosestFVSI value1 (unstable)
Yes No
Remainingalllinesinthesystemare stable
End


Again frequency and voltage are not in the desirable range,andanoverloadof26.61MWstillexists,theFVSI valueofeachtransmissionlinewasrecalculated,andthe largest nonvital load was found at line 5 6. The remaining 50% of load shedding is now removed at bus number6'1at1.3second.
WhencalculatingtheFVSIvalueofeachline,thereisstill aportionofsuddenload14.23MW.Atthistime,theFVSI value at line 2 4 was determined to have the highest nonvital load. For this moment, remove the load sheddingamountatbusnumber42at1.4second.
International Research Journal of Engineering and Technology (IRJET) e ISSN:2395 0056
Volume: 09 Issue: 05 | May 2022 www.irjet.net p ISSN:2395 0072
Simultaneously, the line index value of each line is calculated using Equation 8; if the line stability index valueiscloseto1,thelineisconsideredunstable.
Whena100MWoverloadisappliedtobusno.6at1 second, at which moment the frequency drops to 49.6Hzin1.9seconds,whichisoutsidethesystem's normaloperatingrange,andthevoltagecontinuesto drop.Thefrequencyresponsemodelhasdetermined 97.86MWamountofloadshedding.
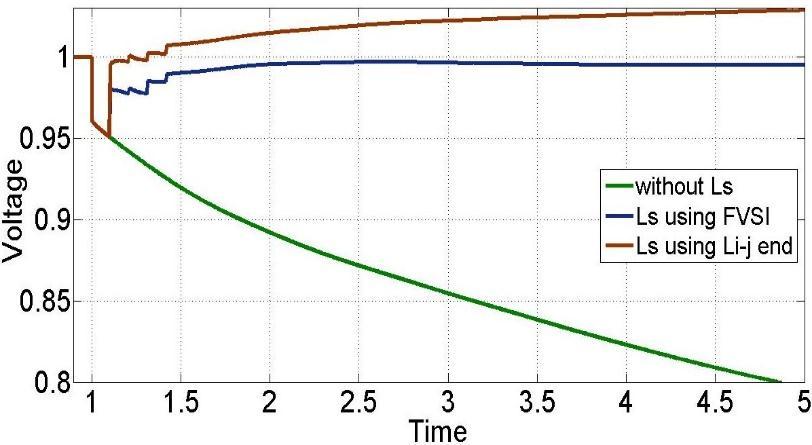
Hz,andthevoltageresponseis0.99volts.Thefollowing scenario is based on line stability stability index. When thelinestabilityindex isapplied,thefrequencybecomes stable at 49.2 HZ, and the voltage range continuously increases. This is outside the system's permitted range. accordingtothesystem'sperformanceIncomparisonto others, the system is stable when load shedding is used withFVSI.
Table 5:Valueoffastvoltagestabilityindexandload categoryofoverload100MW
After applying a sudden load of 100 mw, determine the line index value of each line. If the line stability index value is close to 1, consider the transmission line to be unstable. Table no. 6 represents the step of line stability index. At this moment, the largest non vital load is at line 5 6, so perform 50% load sheddingatbusno.5'1at1.1second.
Sequence No.
Value of Fast Voltage Stability Index & Load Category
Line no. 100 MW 51.11 MW 26.61 MW 14.39 MW
1 2 0.2864 Non vital
Now that just 51.11 MW is left, calculate the line indexvalueofeachlineagain,andfindthemaximum non vital load at line 2 5. Following that, a 50 percent load shedding amount of 24.46 was applied atbusnumber5'1at1.2second.
1 4 0.4648 Non vital
0.1887 Vital 0.1412 Vital 0.1105 Vital
0.3644 Non vital
The 26.61 MW unexpected load continues thus the line index value of each transmission line was determinedagain,andthehighestnonvitalloadwas foundatline5 6.Atthispoint,theremaining50%of loadsheddingiseliminatedatbusnumber5'1at1.3 second.
1 5 0.5485 Non vital
2 3 0.3058 Non vital
2 4 0.5574 Non vital
0.3410 Non vital
0.2287 Non vital
0.4365 Non vital
0.3216 Non vital
0.2248 Non vital
0.2058 Non vital
0.3858 Non vital
0.2946 Nonvital
0.1851 Vital
0.1363 Vital
0.3567 Non vital
Atthefinaltimetheremainingportionofthesudden load14.23MW remains againline'sline index value wascalculated.Thehighest nonvital loadwasfound at line 2 6at this time. At this moment, remove the load shedding amount at bus number 6'1 at 1.4 second.
The frequency and voltage responses of a 100 MW unexpectedloadareshowninFigures5and6.Figure5.6 Three cases of the system were verified in these figuers i.e. when there is no load shedding, load shedding using the Fast voltage stability index and load shedding using thelinestabilityindex The abovestepsaresummarized asbelow.
When the IEEE 6 bus system is used, a sudden load of 100 MW is introduced. At this moment, the frequency drops to49.6Hz for1.9 seconds beforestablizesat 50.4 Hz, which is outside the system's allowable range. After then,theloadsheddingamountiscalculatedtobe97.86 MW. After calculating the FVSI value of each line, use a simplified frequency response model. And use the fast voltage stability index to perform out the load shedding scheme At this point, the frequency is steady at 50.15
2 5 0.6205 Non vital
0.0764 Vital 0.3369 Non vital
2 6 0.0895 vital 0.3603 Non vital
3 5 0.6472 Non vital
0.3088 Non vital
0.1953 vital
0.0665 vital 0.0616 Vital
0.2656 Non vital
0.2175 Nonvital
3 6 0.0347 vital 0.0319 Vital 0.0027 Vital 0.0264 Vital
4-5 0.1745 vital 0.2082 Non vital
5 6 0.8302 Non vital
0.710 Non vital
0.2828 Non vital
0.6208 Non vital
0.0581 Vital
0.1717 Vital
International Research Journal of Engineering and Technology (IRJET) e ISSN:2395 0056
Volume: 09 Issue: 05 | May 2022 www.irjet.net p ISSN:2395 0072
vital vital vital
3 5 0.110 Vital 0.0106 vital 0.0097 Vital 0.0092 Vital
3 6 0.1155 Vital 0.0864 vital 0.070 Vital 0.0618 Vital
4 5 0.1770 Vital 0.1161 Vital 0.1385 Vital 0.1342 Vital
5 6 0.3076 Non vital
0.1382 vital 0.4923 Non vital
0.1652 Vital
The procedures in Table No. 7 are used to apply an unexpected60MWoverload.Atbusnumber5’1a60MW loadisappliedat1second.Thefrequencydipsto49.8HZ after 1.8 seconds. The frequency settled at 50.25 Hz in the end. Furthermore, the voltage in the system continuesto diminish.Accordingto LSusing SFR model, the amount of load shedding is 57.79 MW. According to FVSI value calculation in table 7 and load shedding amountestimatedfromSFR,firststepsheddingof28.89 MW is applied on bus no. 5'1 at 1.1 sec. Following the procedures outlined in the approach, 14.44 MW is shed frombus6'1at1.2seconds,followed by12.23MWfrom bus4'1at1.3seconds,andbus5'1at1.4seconds.When these procedures are performed, the system becomes stable.
Whenanunexpectedoverloadisappliedatbusno.5at1 second.Atthismomentfrequencydropbelow49.8Hz at 1.8 second and voltage continue decreased at this moment load shedding amount is used which calculates byfrequencyresponsemodelaloadsheddingamountis 57.79 MW. After that calculate line index value of each line and which line near to 1 that transmission line considered zero. Table 8 shows the step and used the load shedding amount which derived from equation no. 8
The quantity ofloadshedding executedinitiallyis28.89 MWatbusnumber5'1at1.1second Againstepfollowed according table 8 and 14.44 amount of load is shed at bus no.4’1at1.2second.Then12.23mwloadatbus no 6’1at 1.3secondisshed. In the final stage, 12.23 MW is shedatbusno4’2at1.4second
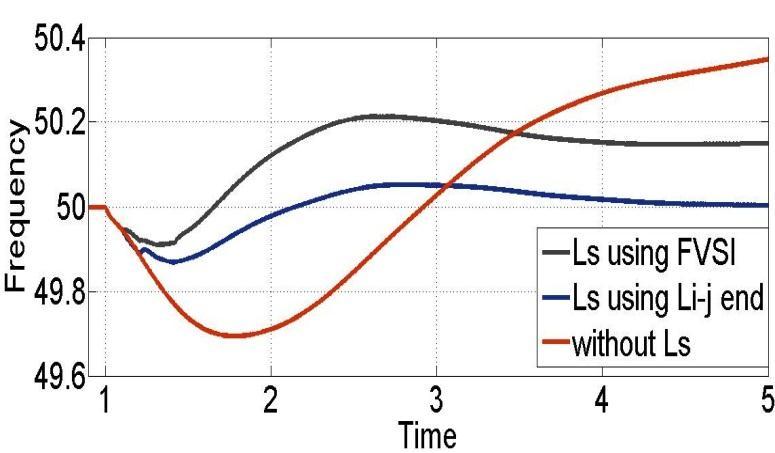
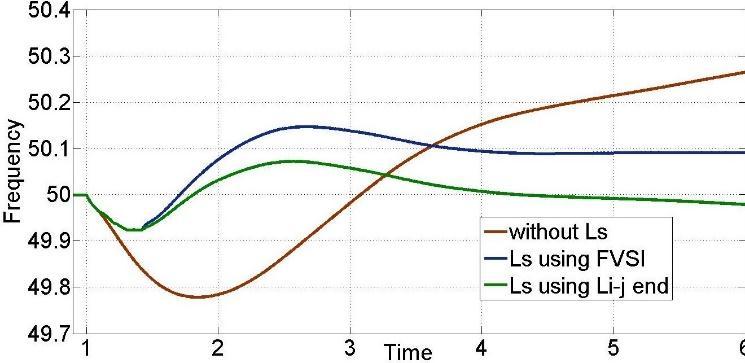
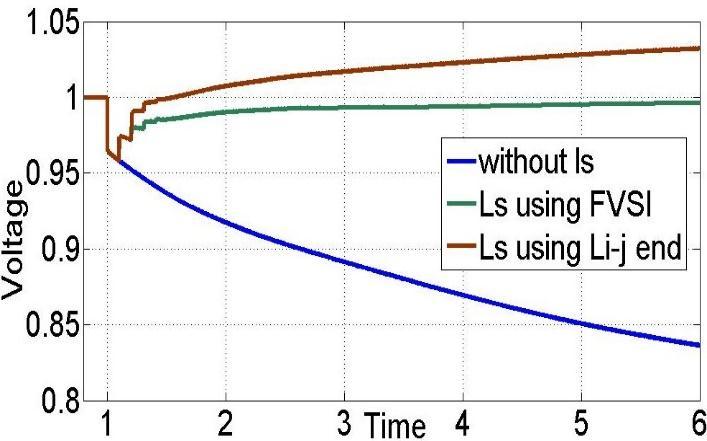
The frequency response and system voltage for this situation are shown in Figure 7,8. When the load shedding scheme is not used, Fig. 7,8clearly indicates that when the system's sudden load increases, the voltagedropsandthefrequencyincrease.Whenaloadof 57.79MW is shed in four steps without usingthe FVSI
International Research Journal of Engineering and Technology (IRJET) e ISSN:2395 0056
Volume: 09 Issue: 05 | May 2022 www.irjet.net p ISSN:2395 0072
valuesofthelines,theminimumfrequencyreached49.8 HZ. However, the system stabilizesaround 50.30 Hz, which is outside of the desired range. When the load shedding scheme combines the SFR load shedding with theFVSIvaluesofeachlineateachstage,systemvoltage also achieves 0.85 p. u. At 50.12 HZ, the frequency becomes steady. At 50.12 HZ, the frequency becomes steady. This frequency range is stable and. At 0.99 p. u., thesystemvoltagealsobecomessteady.
2-3 0.1496 Vital 0.1644 Vital 0.0850 Vital 0.0486 Vital
2 4 0.4833 Non vital
2 5 0.6283 Non vital
0.4419 Nonvital 0.4136 Nonvital 0.3858 Non vital
0.5481 Nonvital 0.4539 Nonvital 0.4716 Non vital
2 6 0.0478 Vital 0.0422 vital 0.0390 Vital 0.0318 Vital
3 5 0.6852 Non vital
0.6514 Nonvital 0.4955 Nonvital 0.4616 Non vital
3 6 0.0019 Vital 0.00017 Vital 0.0159 Vital 0.0129 Vital
4 5 0.1895 Vital 0.3276 Nonvital 0.1370 Vital 0.1279 vital
5 6 0.4978 Non vital
Fig. 7:Frequencyresponseofoverload(60MW)
Fig. 8:voltageresponseofoverload(60MW)
0.7291 Non vital 0.3904 Non vital
0.3166 Non vital
Table 8:Valueoflinestabilityindexandloadcategory ofoverload60MW
Overload State Without Load Shedding
Line stability index based Load shedding (Li j)
Fast voltage stability based load shedding
Frequency response model based load shedding
100 MW Min Frequency 49.65 49.9 49.9 49.9
Stable frequency 50.40 50.0 50.15 50.5 Stable voltagep.u. 0.75 1.04 0.99 0.95
60MW Min Frequency 49.8 49.96 49.9 49.9
Stable frequency 50.30 49.9 50.12 48.95 Stable voltage p.u.
0.83 1.04 0.99 0.91
International Research Journal of Engineering and Technology (IRJET) e ISSN:2395 0056
Volume: 09 Issue: 05 | May 2022 www.irjet.net p ISSN:2395 0072
9:comparisonofloadsheddingscheme
Line no. 60 MW 35.51 MW 21.07 MW 8.84MW
1 2 0.1533 Vital 0.0035 Vital 0.0757 Vital 0.0194 Vital
1 4 0.1140 Vital 0.3754 Non vital
0.2824 Non vital
0.0067 Vital
1 5 0.1473 Vital 0.1324 Vital 0.1082 Vital 0.0940 Vital
2 3 0.0033 Vital 0.0016 Vital 0.0005 Vital 0.0878 Vital
2 4 0.2126 Non vital
0.0419 Vital 0.0315 Vital 0.0074 Vital
2 5 0.1207 Vital 0.2145 Non vital
2 6 0.3168 Non vital
0.2697 Non vital
0.1741 Vital 0.1558 Vital
0.2975 Non vital
0.1115 Vital
3 5 0.0138 Vital 0.0010 Vital 0.0102 Vital 0.0100 Vital
3 6 0.0636 Vital 0.0515 Vital 0.0394 Vital 0.2391 Non vital
4 5 0.9840 Non vital
5 6 0.3372 Non vital
0.1706 Vital 0.1432 Vital 0.1227 Vital
0.1560 Vital 0.1105 Vital 0.09565 Vital
The main concerns in the power system are frequency andvoltageinstability,whichcanbecausedbyasudden loss of generator, overloading, or transmission line damage. Anadvancedloadsheddingapproachisusedto maintain the voltage and frequency stability of the system within the standard range. Using Frequency responsemodelbaseloadsheddingamountiscalculated. While load shedding keeping in view the fast stability index as well as line stability index leads to more stable voltage and frequency range as shown in table 9. This method helps in the implementation of a rapid system stability solution. The scheme is more efficient as load shedding is more accurate and maintains system stabilitymoreprecisely.Thismethodhasbeenevaluated
in the IEEE 6 bus system power world simulator. It is concluded that load shedding amount as calculated by the system frequency response model along with FVSI and line stability index enables to identify the exact weakest lines and buses where are action should be taken. With the presented scheme both voltage and frequencystabilitycanbeachieved.
[1] A.Gautam,R.Shukla,K.Kishore,P.Jain,R.K.Porwal and N. Nallarasan, "Analyses of Indian Power System Frequency," 2020 IEEE International Conference on Power Systems Technology (POWERCON), 2020, pp. 1 6, doi:10.1109/POWERCON48463.2020.9230532.
[2] F.Zare, A. Ranjbar and F. Faghihi, “Intelligent topology oriented load shedding scheme in power system”,201927th Iranian ConferenceonElectrical Engineering (ICEE), 2019,PP.652 656, doi:10.1109/IranianCEE.2019.8786519.
[3] N. C. Munukutla, V. S. K. Rao Gadi and R. Mylavarapu, "A Simplified Approach to Controlled IslandingofPowerSystem," 20198thInternational ConferenceonPowerSystems(ICPS),2019,pp.1 6, doi:10.1109/ICPS48983.2019.9067725.
[4] S. Kucuk, "Intelligent electrical load shedding in heavilyloadedindustrialestablishmentswithacase study," 2018 5th International Conference on ElectricalandElectronicEngineering(ICEEE),2018, pp.463 467,doi:10.1109/ICEEE2.2018.8391382.
[5] Z. Jianjun, S. Dongyu, Z. Dong and G. Yang, "Load Shedding Control Strategy for Power System Based ontheSystemFrequencyandVoltageStability(Apr 2018)," 2018 China International Conference on Electricity Distribution (CICED), 2018, pp. 1352 1355,doi:10.1109/CICED.2018.8592262.
[6] T. Amraee, M.G. Darebaghi, A. Soroudi and A. Keane,”ProbabilisticunderfrequencyloadShedding Considering RoCoF Relays of Distributed Generators,”inIEEETransactionsonpowersystem, Vol. 33, no. 4, pp. 3587 3598, July 2018, doi: 10.110./TPWRS.2017.2787861.
[7] N.A. Yusof, H.Mokhils, M.Karimi, J.A. Laghari, H. A. llliasandN.M.Sapori,“undervoltageloadshedding scheme based on voltage stability index for distribution network”, 3rd IET International ConferenceoncleanEnergyandTechnology(CEAT) 2014,2014,PP.1 5,doi:10.1049/cp.2014.1470.
International Research Journal of Engineering and Technology (IRJET) e ISSN:2395 0056
Volume: 09 Issue: 05 | May 2022 www.irjet.net p ISSN:2395 0072
[8] J. Tang, J. Liu, F. Ponci and A. Monti, “Adaptive load sheddingbasedoncombinedfrequencyandvoltage stability assessment using synchrophasor measurement.” In IEEE Transaction on power system,Vol.28,no.2,pp.2035 2047,may2013,doi: This10.1109/TPWRS.2013.2241794
[9] J.A.Laghari,H.Mokhils,A.H.A.BaskarandHasmaini Mohamad (2013) “Application of computational intelligence technique for load shedding in power system” Energy conversion and management, pp. 130 140.
[10] Y. Hong and P. Chen, "Genetic Based Underfrequency Load Shedding in a Stand Alone Power System Considering Fuzzy Loads," in IEEE Transactions on Power Delivery, vol. 27, no. 1, pp. 87 95, Jan. 2012, doi: 10.1109/TPWRD.2011.2170860.
[11] I. Musirin and T. K. Abdul Rahman, "Novel fast voltage stability index (FVSI) for voltage stability analysis in power transmission system," Student Conference on Research and Development, 2002, pp.265 268,doi:10.1109/SCORED.2002.1033108.
[12] R. E. Uhrig, "Introduction to artificial neural networks," Proceedings of IECON '95 21st Annual ConferenceonIEEEIndustrialElectronics,1995,pp. 33 37vol.1,doi:10.1109/IECON.1995.483329.
[13] L. Wang, "The Effects of Scheduled Outages in Transmission System Reliability Evaluation," in IEEE Transactions on Power Apparatus and Systems, vol. PAS 97, no. 6, pp. 2346 2353, Nov. 1978,doi:10.1109/TPAS.1978.354740.
[14] "Common mode forced outages of overhead transmissionlines,"inIEEE Transactions on Power Apparatus and Systems, vol. 95, no. 3, pp. 859 863, May1976,doi:10.1109/T PAS.1976.32170.
[15] JieZhang,LinGuanandXiaogangWang,”Impact ofislandloadsheddingandrestorationstrategiesof reliability of microgrid in distribution system,” 2016 IEEE PES Asia Pacific Power and energy Engineering Conference (APPEEC), 2016,PP. 1594 1598,doi:10.1109/APPEEC.2016.7779760.