International Research Journal of Engineering and Technology (IRJET) e-ISSN: 2395-0056

Volume: 09 Issue: 05 | May 2022 www.irjet.net p-ISSN: 2395-0072
International Research Journal of Engineering and Technology (IRJET) e-ISSN: 2395-0056
Volume: 09 Issue: 05 | May 2022 www.irjet.net p-ISSN: 2395-0072
Anshumaan Phukan 1 , Adarsh Raghav 2 , Varad Vinayak Godse 3
1,2,3 Dept. of Computer Science Engineering, Bennett University, Greater Noida, Uttar Pradesh, India ***
Abstract - In the past decade, developments in the fieldof medical analysis and imagery have been exponential. Logical approaches to intricate problems have played a significant role in the larger picture: medical diagnosis andtreatment. This paper discusses the detection of brain abnormalities, casualties, and complex analysis of medical imagery such as Magnetic Resonance Images and X raysin a more focused spectrum. The most common occurring brain disorders today stem from brain abnormalities. The general practice is to have a neurologist analyse many patient images, which becomes extremely tedious and inefficient. In this work, we propose an abnormality detection workflow revolving around advanced machinelearning techniques to study the brain's medical images (X rays/MRIs).
With more than 700 unlabeled patient images, we would label and pre process these images (resizing, orientation, grayscale, and noise removal). Then, further classifying the images into 'brain' and 'not brain' using a neural network based classifier framework. With these concrete brain images and a convoluted neural network architecture, we will classify the brain images; 'Normal' and 'Abnormal.' These predictions will be based on the learning from training data. The further steps in classification include modifications to improve accuracies and training on larger datasets to get a better fit.
Accordingtoa 2007 studyorganisedbytheUnitedNations,upto1 billionpeoplesufferfromoneform ofa numerological disorderortheother.Toexpand,thesedisorders/abnormalitiesvaryfromsomethingassevereasAlzheimer'sdiseasetosome asminuteasamigraine.
A logical approachfor diagnosingsuchabnormalitiesis to conduct an MRI (Magnetic Resonance Imaging) of the patient's brain followed by a short sighted examination of theseMRI/X ray.Unfortunately,suchaprocedurecanoftenbetedious and inefficient. As per standard protocols, the neurologist has to pace through multiple scans of a singlebrain to accurately determine the root cause and occurrence of abnormalities in most cases. Thus, such an approach can lead to inaccuracy, latency,andfalsepositives.
Before beginning our project, we had to construct ideation of our project. The ideation process encompassed various parameters too analyze and metricate our idea and the approach we were to take to reach the most optimal solution. Furthermore, since our idea is structured on medical imagery and analysis and, more specifically, neurology, the solution demanded in depth research into brain abnormalities: what they are, how they are caused, and how they can be detected/treated.
Inlayman'sterms,a braintumorisaneurologicalanomalythatmayoccurduetothepresenceofatypical featuresinbrain function.Now,thisatypicalfeaturecanoccurduetomultiplecausessuchas:
• Damagetothebrainthroughanaccident ortraumaticevent(suchasconcussions/bloodclots/strokes)
• ParentalGenetics
• Toxins/diseasesthatmayhavebeenpassedonfromtheparent
• Somethiscanbecausedbyotherdiseasessuchas:
International Research Journal of Engineering and Technology (IRJET) e-ISSN: 2395-0056
Volume: 09 Issue: 05 | May 2022 www.irjet.net p-ISSN: 2395-0072
Thenextstepistounderstandhowdoctorsprocess detectingandtreatingbrainabnormalities.Aninitialapproachistoget the patients' symptoms mapped, whereinitial symptoms can range from vomiting, nausea, speech difficulty, paralysis, and memoryloss.
A more precise and well adapted approach is to conduct a Magnetic Resonance Image (MRI) of the patient's brain, which returns an X ray likeview ofthe patient's brain. The doctor can then use this MRI todetect malignant abnormalitiesin how thepatient'sbrainisstructured.
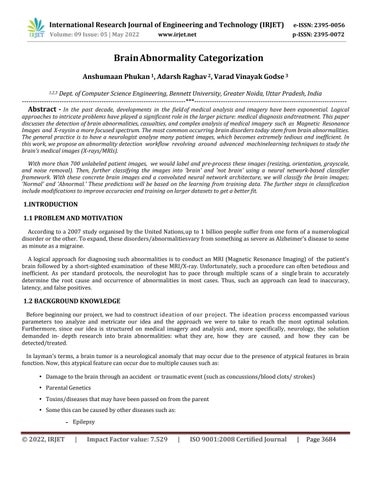
In fig 1 below, we can see the side by side comparison of 2 brain MRIs. The scan to the left is of a patient with no visible abnormalities, whereas the image to the rightisofabrainabnormality.
As seen in the scan to the right, the patient has abnormal tissue in the brain, which can be spotted as a white highlight towardsthecenterofthescan.Uniquepatternssuchasthesecanbeusedtodetectanymalignantinthebrain,furtherhelping usclassifywhetherthebrainisabnormal.
While doing our research on this topic, we took heavy inspiration from a scientific journal where theresearchers took anomaly detection approach to identify chronic brain infarcts on MRI. They discovered an effective approach to detect all anomaliesbylearninghow'normal'tissuelooksusingtheiranomalydetectiontechnique.Atotalof967patientswereenrolled inthisstudy,with270ofthemsufferingfrombraininfarctions.Beforecreatingthemodel,theyperformedfundamentalimage preprocessing activities such as N4 bias field correction and normalization. For the required training dataset, 1 million transversalimagepatches(15*15voxels)weresampledfromimagesofallbut10patients withoutbraininfarcts.Theneural networkarchitecturetheyimplementedwasbasedontheGANomalyarchitecturewhichconsistedofgenerator(bottomhalf) anddiscriminator(tophalf). The generatoranddiscriminator they used consisted ofencoder and decoder parts. Each parts containedthreesequentialconvolutionallayers,interleavedwithRelu activationandbatchnormalization.Encodingofinput image patches x into latent representations: z and zˆ were doneusing generator and creation of realistic reconstructions xˆ wasdoneusingdiscriminator.Adamwasusedastheoptimizerwithalearningrateof0.001.
International Research Journal of Engineering and Technology (IRJET) e-ISSN: 2395-0056
Volume: 09 Issue: 05 | May 2022 www.irjet.net p-ISSN: 2395-0072
•Incomparisontoallotherlatentvectorsizes,alatentvector size of 100 had the maximum sensitivity anddetectedbrain infarctvolumepercentagefor thesamenumberofsuspectedabnormalitiesoverpracticallythefullrange,accordingto the validation set. On the test set, the suggested method yielded an average of 9 suspected abnormalities per image whileusingoptimalparametersforevaluation.Theirneuralnetworkdetected374outof553braininfarcts(sensitivity: 68percent).
• Whitematterhyperintensitieswereresponsiblefor44.3percent(865)ofthesuspectedabnormalities.
• Normalhealthytissuewasshowntoberesponsiblefor563,or28.8%,ofalldetectedabnormalities.
• The researchers discovered that 1.3 percent ofallsuspectedanomalieswereunannotatedbraininfarcts,whichwere typicallylocatedwithinthecerebellum.
Wealsohadgreatinsightfromanothersimilarresearch paper.whattheydidwasthattheybasically trainedan autoencoder onaperfectlyhealthybrain’ sMRIimagesand went on with it to detect anomalies likeglioblastoma,microangiopathyand multiplesclerosis.
Theyusedthisfeatureofspatialencoders,whichbythewaycouldflattenandrefurbishthedatasothattheycouldlearnmore abouttheirregularityofahealthybraingivenitsMRimages.Theytrainedthisunsupervisedmodelwith100normal,perfectly healthy MRI in house scans. By making out the difference of input data and it!srevamping, with the help of this feature they could detectand delineate several diseases. The model was the held in contrast with a supervised UNet and other models based on threshold, which were trained with images of total of hundred patients MR scan images, fifty patients suffering with sclerosis (multiple), which was an autogenous dataset, and another fifty patients out of CIA (Cancer Imaging Archive). Thereafter, both the UNet models were tested with 5 datasets of different brainabnormalities like glioblastoma, microangiopathy and multiple sclerosis. UNet is a basically a neural network architecture extension features with some editionsintheCNNarchitecture,todealwith biomedical imageswherethegoalistofindtheareaoftheinfectionalongwith theaffirmationofananomaly.
Conclusionfoundinthispaper:
They used precision recall statistics like F1 Score, DiceScore, mean area under the curve and etc. to facilitate segmentation performance.Theunsupervisedmethodwonoverthethresholdingmodelinvariousaspects.Ananomalyheatmapdisplaywas created of the model. Theunsupervised model showed a F1 Score of 17% to 62% for tumour identification. The naïve thresholding modelwas tested across five datasets, revealing them a 6.4% 15% F1 Score. The UNet Model (supervised) meanwhilecameclosetotheunsupervisedmodelwithaF1scorerangingintheregionof20%to40%.Withameanprecision scoreof15% 59%,theunsupervised modelshadaupperhandoverthethresholdingmodels, whichhas3.4& 10%MPscore. This vast difference of mean precision score credited to the unsupervised model’s success. After gathering all the data, they cameup with a conclusion that Deep Learning UnsupervisedModel would identify more potential abnormalities efficiently fromagiveninputMRIscanimageofthebrain.
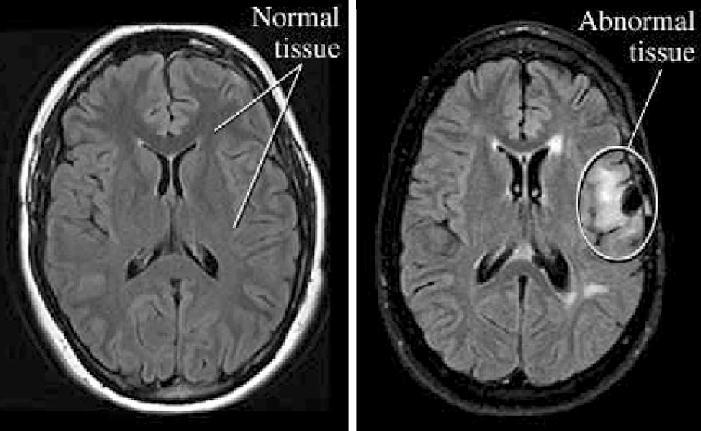
TheimagedatacomesinDicomformat(.dicextension).Everyimagegets convertedtoJPEGthroughrescaling. Theprepared JPEG data needs manual labelling at the beginning. The images get labeled as brain or not brain. The labeled dataset moves intothe binaryclassifierfor training. The CNN model classifies theimageas"BRAIN" or"NOTBRAIN" based onthe learning fromtrainingdata.Thefurtherstepsinclassification include modifications toimprove accuracies.
(IRJET) e-ISSN: 2395-0056
The image detection process needs detailed annotated images for training. The different parts of brain images must be annotated inrequiredforms like bounding boxes,polygons,etc.Thedimensionsof annotatedparts getstoredintxtformats likeXML.Thedimensiondataoneveryimagecanthenmovefortraining.Theneural networkforobjectdetectiontrainsitself anddetectsthedifferentpartsofthebrainimage.
The abnormalities in a brain image require the analysisof specific brain parts. The features of the identifiedparts get compared to conditions that fulfil an abnormal image. The images get labeled as Abnormal and Normal.The labeled dataset movesintothebinaryclassifierfor training. TheCNN model classifies theimageas"ABNORMAL"or"NORMAL"basedonthe learningfromtrainingdata.Thefurtherstepsinclassificationincludemodificationstoimproveaccuracies.
Thefirstapproachincludeddetectingthebrainpartsand applyingconditionstoclassifythemas‘Abnormal’or‘Normal’.Itis computationally possible, but the chancesof errors are more. The nature of the annotations included complex edge and polygonselection,andminorerrorscouldhaveledtoinaccurateresults.Thedegreeofrandomnessoftheabnormalityonbrain images would have generated the need for a large number of annotated samples. The comparison process would have been tediousbecausenopreexistingmodelsareworkingonasimilarapproach.
Thesecondapproachfunctionsthroughthetraditionalbinaryclassificationprocess.Ittrainsthemodelwithalabeleddataset which in turn predicts the two classes. The nature of the approach makes comparison easy as many models share a similar structure.Itleadstofasterimprovements,betterinsights,andaccuracies.
Volume: 09 Issue: 05 | May 2022 www.irjet.net p-ISSN: 2395-0072 Fig2.Methodologyflowchart
© 2022, IRJET | Impact Factor value: 7.529 | ISO 9001:2008 Certified Journal | Page3687
International Research Journal of Engineering and Technology (IRJET) e-ISSN: 2395-0056
Volume: 09 Issue: 05 | May 2022 www.irjet.net p-ISSN: 2395-0072
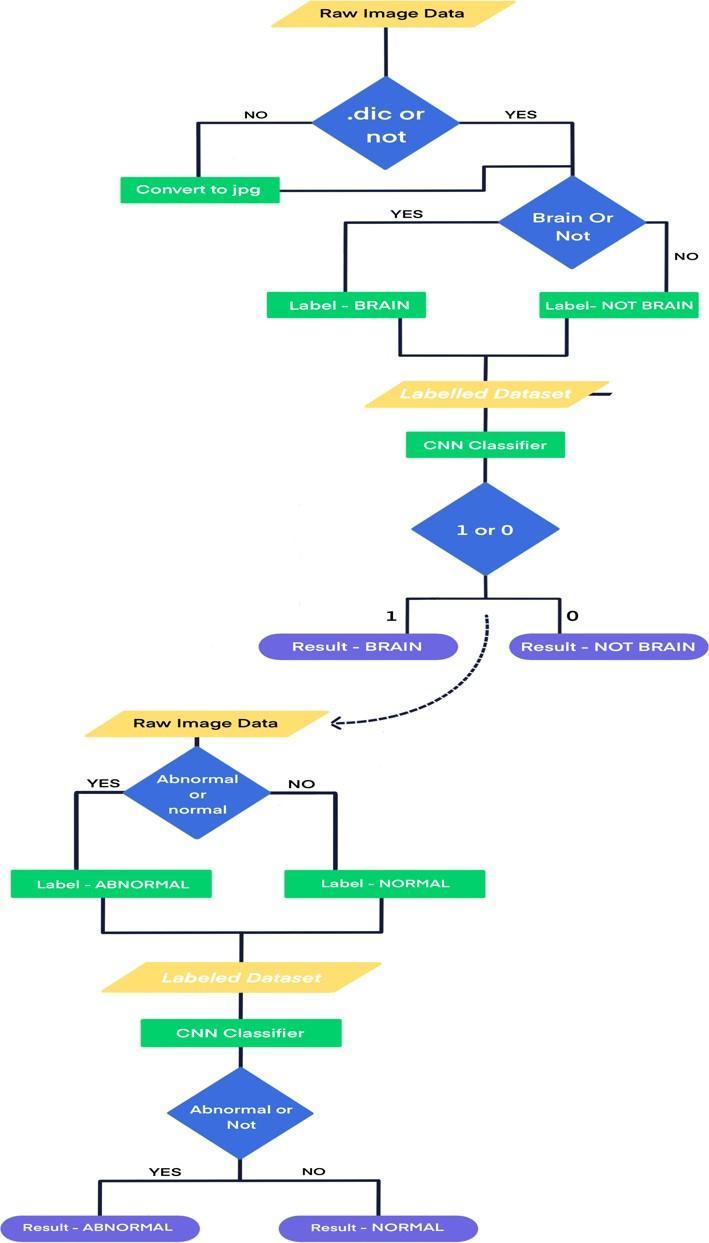
The initial image data consisted of random MRI images belonging to multiple categories. It included the spine, bladder, and brain.Thebrainimagescorrespondedtothreesub parts,namelyT1W,T2W,andflair.ThemajorityportionofT1Wimagesis bright with dark ventricles. The T2W is dark with bright ventricles, whilethe flair has a slightly bright greyish portion with dark ventricles. The classification of a particular category needs at least one other differentiation against it. The image data had around 720 images of the brain (T1W, T2W, Flair), spine, gall bladder. The number of samples from each category was unknown. The classification needed T1W, T2W, and flair images from the two categories (ABNORMAL and NORMAL). The dataset had 400 images with an unknown number of samples from each class. MRI: an imaging technique that uses magnets(magneticfield)andradiowavestocreateimagesofinnerpartsofthebody.ACTusesX raystodothesamefunction.
Fig.3 MagneticResonanceImageofthebrain
The images needed manual labelling or categorizing The Pigeon Jupyter library of python helps to achievethe task. The annotatefunctionunderthelibraryinputsthefolderpathandthelabelstobeassigned.Ittraverseseveryimageandasksthe usertocategorizeaccordingly.
Thedatasetconsistingof720imageswentthroughannotatefunctiontogetlabeledasBRAINandNOTBRAIN.Thefunction returnsaNumPyarraywithimagepathsandlabelsattheend.Thetrainingphasemakesuseofitlater.Thedataset(NORMAL andABNORMAL)having400imagesfollowedthesameannotatingsteps.
The image dataset came in the form of image pathsalong with labels. The classification model does not understand string pathsorimages.Theconversiontonumericalformisnecessary.TheIMAGEfunctionunderthePILlibraryofpythonhelpsto open the image. It provides read and writes operations on the file. The ASARRAY function from the NumPy library further converts them into arrays. The data used for both the classification came in different configurations. It was a random collectionofgrayscaleandRGBchannelpictures.ThenumericaldifferenceliesintheshapeofNumPyarraysoftheimages.
Forexample,agrayscaleimagearrayshapewouldbe >(256,300).Itmeansthatthearrayistwo dimensional withanouter sizeof256andeachofthe256blockshas300 pixel values. The pixel values represent the degreeofbrightnessthatranges from0 255,withzerorepresentingthedarkestvalueand255asthebrightest.
AnRGBimagearrayshapewouldbe >(256,300,3).Itmeansthatthearrayisthree dimensionalwithanoutersize of 256. The size of the second layer is 300, witheachblockhaving3 pixelvalues.Thepixel valuesrepresentdistributionoverRGB(Red, Green,Blue).
The images came in different sizes like (256,330) or(400,1000). However, the architecture of a neural network needs to be definedbasedontheinputsize.Thedifferentsizesineveryiterationcancauseerrors;hence, theimagearrayshavetoresize similarly. The "resize" function from the CV2 library or " np. resize" function from the NumPy library carries out the task properly.
© 2022, IRJET | Impact Factor value: 7.529 | ISO 9001:2008 Certified Journal | Page3688
International Research Journal of Engineering and Technology (IRJET) e-ISSN: 2395-0056
Volume: 09 Issue: 05 | May 2022 www.irjet.net p-ISSN: 2395-0072
Theimagedataisreadyfortrainingafterthesesteps.Othertechniquesweusedforimageprocessingwere:
a. ,ithastheaddedfeatureofevaluatingpixeldensity.Itcontainstwonotablefeatures:
b. Median blurring: While applying convolution to the full image, this pre processing activity takes the median of all the pixelsinthekernelarea andreplacesthecoreelementwiththemedianvalue.Thisapproachisverygoodatreducingsalt and papernoisefromMRIscans,whichcanberatherprevalent.
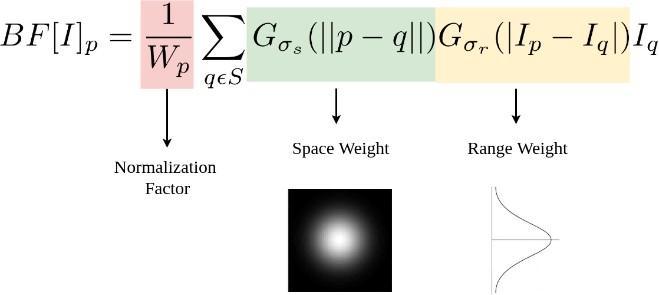
• BilateralFiltering:Thisapproachismostlyusedtoremovenoisewhilekeepingedgesintact.Incomparisontoother blurringalgorithmsGaussianfunctionofspace:Onlypixelsincloseproximityareexamined
• Gaussianfunctionofintensity:onlypixelswithsimilarintensitiesareexamined Itensuresthatonlypixelswithmatchingintensityvaluestothecorepixelareevaluatedforblurring,whilemaintainingsharp intensitychanges.
Fig.4 BilateralFiltering
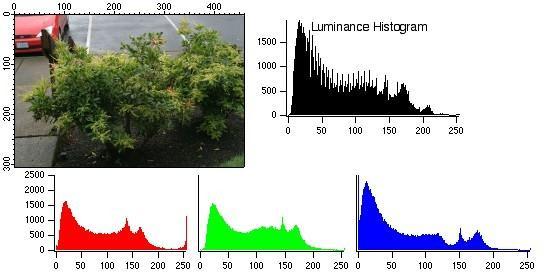
c. ImageHistograms:Tobettercomprehendthe distributionofpixelintensitiesovertheentireimage, wehaveusedimage histogramsinour research. It's representedasa graph with255 binsforeachpixel value.This specialized examination provides an overview of contrast, brightness, and intensity distribution. It allows us to quickly identify the Background andgreyvaluerange.ClippingandQuantizationNoiseinimagevaluescanalsobeidentifiedrightaway.
Fig.5.
TheArtificialneuralnetworkisawidelyusedtrainingarchitecturefortheclassificationofimages.Thetraditionalapproachof ANN starts with converting the image into a grid of pixel values ranging from 0 255.The required object has marginally differentvaluesthanotherparts,thusformingthescopeforclassifyingthedifference.Thefirstlayerofthenetworkcontains a chain of neurons that need one dimensional input. The flattening of grids (usually multidimensional like 2*2 or 7*7) is necessary. The multiple hidden layers functionforbetterlearning.Eachhiddenordenselayercontainsneuronsthatconnect
© 2022, IRJET | Impact Factor value: 7.529 | ISO 9001:2008 Certified Journal | Page3689
International Research Journal of Engineering and Technology (IRJET) e-ISSN: 2395-0056
Volume: 09 Issue: 05 | May 2022 www.irjet.net p-ISSN: 2395-0072
to every neuron in the previous layer. The value of the connections depends on the weights assigned and the activation function.Everyiterationformulatesthedifferencebetweenthe actualandpredictedoutput.Thebackpropagationstartsafter theresults,andtheweightsarechangedaccordingly.Theykeepchangingtillthemaximumpossibleaccuracy.
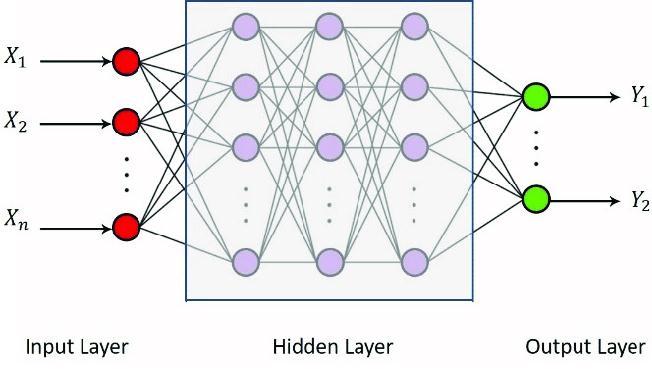
Fig.6 PictorialViewofANN
However,thismodeldoeshavesomedrawbacks:
• Too much computation A large sized complex image may generate millions of neurons in the input layer, which is not computationallyefficient
• Sensitive to locality A dog in an image remains a dog even if it is present at the left, right, or center. The ANN architecturelearnstheimageataparticularlocation.Itleadstoinaccuraciesforchangedpositions.
TheConvolutionalNeuralNetwork(CNN)differsfromANNintermsofimagepartitioning.TheANNlearnstheentireimageata position while CNN learns individual parts. The change in position of image doesn't affect CNN. It is a significant advantage overANN.ThemechanismofCNNinvolvesthreekeysteps: a. Convolutional Operation or Filter b. Activation Function c. Pooling d. Dropout
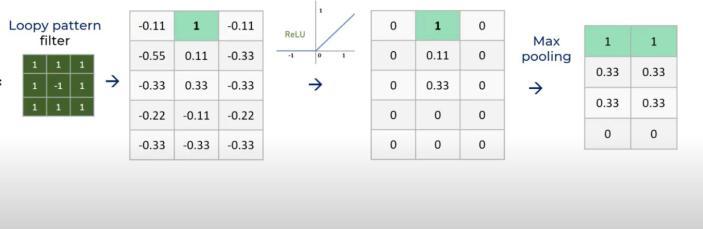
The convolutional filter involves multiplying the image grid with a smaller matrix. For example, if the imagegrid is 5*7, thenitwouldbemultipliedwitha 3*3matrix with sample sizes of 3*3 in the grid. It generatesafeaturemapthathashigher valuesatthecellswhereourtargetobjectispresent.Theactivationfunctionbringsnonlinearitytothedata.Theabsenceofan activation function makes the network similar to linear regression. It assumes a linear relationship between dependent and independent variables. The real world data hardly has a linear relationship. For example, aRELU function converts negative values to zero. It eliminates linearity. The pooling layers are responsible for size reduction. It ensures the conversion of the largergridtoasmalleronecontainingnecessaryinformation.Max pooling selects themaximum valuefromthe subsetofthe grid,whileaveragepoolingselectstheaverageofthesubsetvalues.
Wealsoaddeda dropoutlayer.Ateachupdateofthe trainingphase, Dropoutworksbysettingtheoutgoing edges ofhidden units (neurons that make up hidden layers) to 0. This technique provides a computationally simple and highly effective regularizationstrategyfordeepneuralnetworksofalltypestopreventoverfittingandenhancegeneralizationerror.
© 2022, IRJET | Impact Factor value: 7.529 | ISO 9001:2008 Certified Journal | Page3690
International Research Journal of Engineering and Technology (IRJET) e-ISSN: 2395-0056
Volume: 09 Issue: 05 | May 2022 www.irjet.net p-ISSN: 2395-0072
Fig.7 DifferentParts
Thedifferentpartsoftheimagesgettrainedthroughthe combinationoftheabovelayers.Themodellearnsthe entireobject image when an aggregated form of already learned partitions passes the layers again. The CNN model functions through multiplesetsofConvolutionalfilters,Activationfunctions,andPoolingLayers.
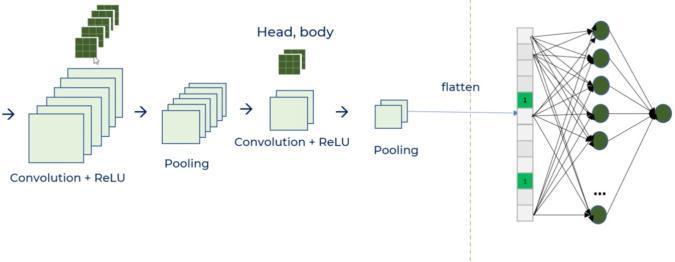
Fig.8. CNNModelWorking
Model
Accuracy
ANN 0.8077 CNN 0.9231 CNN(AugmentationLayer) 0.8077 VGG16 0.6154 AlexNet 0.6923
Table1. DifferentModelsandtheiraccuracies
Deploying and training multiple models was necessaryto evaluate performance and choose the right fit for our task. We started by training a simple Artificial Neural Network (ANN) with a few dense layers combined with 'relu' and 'sigmoid' activation functions. After training and testing, our model evaluation yielded that the ANN model resulted in an accuracy of 80.77%. However, a loss of 0.35 hinted at inefficiency. We then switched our approach to a Convolution Neural Network (CNN),wherewecouldefficientlyperformconvolutionandpoolingcomparedtoANN.TheCNNmodelresultedinanaccuracy of92.31%overourtestingandtrainingdata.Toshakethingsup,weaugmentedourbrainimagestocreateawidervarietyfor the training data and training process and used it over a CNN model again. This CCN model with an augmentation layer yielded an accuracyof 80.77%, which is low compared to the CNN model. However, when averaged, the accuracy is comparatively higher.Wewantedto enhancefurtherourunderstanding ofourtask andthealgorithm thatwouldbestfit it; hence, we trained two more models, VGG16 and AlexNet. Both VGG16 and AlexNet resulted in less than70% accuracy, more specifically61.54%and69.23%,respectively.
© 2022, IRJET | Impact Factor value: 7.529 | ISO 9001:2008 Certified Journal | Page3691
International Research Journal of Engineering and Technology (IRJET) e-ISSN: 2395-0056
Volume: 09 Issue: 05 | May 2022 www.irjet.net p-ISSN: 2395-0072
All in all, the accuracy for our CNN-based model was the highest, standing at 92.31%. For the performance measuring of the CNN model, we used a variety of othermetrics. Since detecting brain abnormality is a classification task; Hence we needed to evaluate basedonclassificationmetrics.Mostclassificationevaluations startwitha confusion matrix.Aconfusion matrixisdividedintofoursegments;Truepositive, falsepositives,falsenegatives,andtruenegatives.Ourconvolutionneural networkhadthefollowingconfusionmatrix:
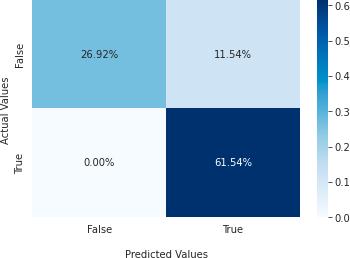
The confusion matrix above shows that most values fall into the true positive (61.54%). A true positive percentage tells us thatmostpredictedvaluestendtobesimilartotheactualvalue.Thisinturntellsusthatourmodelisefficient.Tosupportthis claim,wecanseehowthesecondhighestmajorityisoccupiedbytruenegatives(26.92%),whichmeansthatmostvaluesthat are actually 'not abnormal' are also predicted as 'not abnormal.' With the confusion matrix developed, we now resorted to otherevaluationmetrics,suchas:
• AccuracyScore:accuracyscoreisameasureofthefractionofsamplesthatwerepredictedcorrectly.Itisgivenby:
TP + TN
TP + TN + FP + FN
Accuracy Score =
Theaccuracyscoreofourconvolutionalneuralnetworkforbrainabnormalitydetection yielded a score of 92.31%.
• PrecisionScore:theprecisionscoremeasuresthefractionofpredictedpositivesthatwereactuallypositive.Thefollowing equationgivesthis:
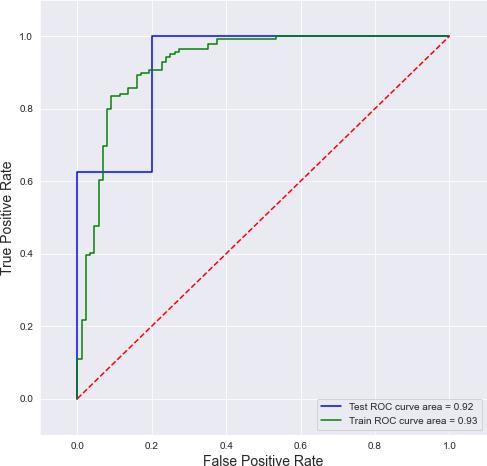
Fig.10 ROCCurve
International Research Journal of Engineering and Technology (IRJET) e-ISSN: 2395-0056
Volume: 09 Issue: 05 | May 2022 www.irjet.net p-ISSN: 2395-0072
As we can see in the figure above, with time, the true positive rate increases exponentially, and on the other hand, the false positivedoesn'tgrowonasignificantscale.
• F1 Score: This measure gives us the mean of bothrecall and precision scores, with higher scores concluding a better model:
• F1Score= 2 ×(Precision × Recall )
Precision Score = TP/ TP + FP
Precision + Recall
The F1 score of our convolutional neural network for
ThePrecisionscoreofourconvolutionalneuralnetworkforbrainabnormalitydetection yielded a score of 78.95%.
• Recall Score: recall score is a measure of the fractionofpositiveeventsthatwerepredictedcorrectlybythemodel:
RecallScore =
TP/ TP + FN
Therecallscoreofourconvolutionalneuralnetworkforbrainabnormalitydetection yielded a score of 93.75%.
Herewecanobservethatourrecallscoresarecomparativelyhigherthantheprecisionscore.Theses cores tell us that our model is returning most of therelevantresults/predictions.Inheadofmakingamorecoherentcomparison,weusedaROC curvewhichmapsthefalsepositiveratewiththetruepositivesratebrainabnormalitydetection yielded a score of 85.71%.
• JaccardScore: The Jaccardscore gives us anidea of howalikethe predictionandactual datasetswere. We computea Jaccardscorewiththefollowingformula:
• JaccardScore= A ∩B/AUB
TheJaccardscoreofourconvolutionalneuralnetworkforbrainabnormalitydetection yielded a score of 72.22%.
• Hamming Loss: hamming loss measures the number oflabels that were incorrectly predicted over the dataset. In our case,the hamming loss came out to be 19.23%.
• Thismodelwillhavethearchitectureofconvolutionneuralnetworkwithconvolutional,maxpooling,anddenselayers.
• Thefirstlayerwillbeaconvolutionallayerwith32filters,3*3kernelsize,withreluasactivation.
• Thenextlayerwillbeamaxpoolinglayerwithapoolingsizeof2*2
© 2022, IRJET | Impact Factor value: 7.529 | ISO 9001:2008 Certified Journal | Page3693
International Research Journal of Engineering and Technology (IRJET) e-ISSN: 2395-0056
Volume: 09 Issue: 05 | May 2022 www.irjet.net p-ISSN: 2395-0072
• Nextwillbeanotherconvolutionallayerwith64filters,3*3kernelsize,andreluactivation.Followedbyanothermax poolinglayerofpoolsize2*2.
• Featurevalueswillbeflattened,andtheywillbepassedtoafullconnecteddensenetwork.
• Afterflattening,thenexttwolayerswillbedenselayerswithnumberofoutputnodesas64and10respectively,withrelu activation.
• Thefinallayerwillbeanotherdenselayerwithnumberofoutputnodesas2withsoftmaxactivationtopredictwhether theinputwasabrainornot.
Similartothemodel1usedinpredictionofabnormalandnormalclassificationbelow.
1. MODEL1(CNN):
• In this model we have taken a Convolutional Neural Network architecture comprising of convolution, pooling, dropout,anddenselayers.
• Firsttwo layerswill beofconvolutional layerwith 32and64filtersrespectively,withboth havinga kernel sizeof 3*3andreluasactivation.
• Max pooling will be performed in the third layerwith a pool size of 2*2, followed by a dropout layer as the fourthlayerwith25%ofthetotalnodesbeingdropped.
• Fifthlayerwillbeaconvolutionallayerwith64filters,3*3kernelsize,andreluactivation.
• Sixthlayerwillbeamaxpoolinglayerwithapoolsizeof2*2,followedbyanotherdropoutlayerastheseventhlayer with20%dropoutrate.
• Next will be another convolutional layer with 128 filters, 3*3 kernel size, and relu activation. Followedby a max poolinglayerofpoolsize2*2,andadropoutlayerof25%.
• Allthematrixvalueswillbeflattedusingaflattenedlayer to send the individual values as a single nodeinadense neuralarchitecture.
• Afterflattening,thenextlayerwillbeadenselayerwithnumberofoutputnodesas64andreluactivationwhichwill againbefollowedbyadropoutlayerof20%dropoutrate.
• The final layer will be another dense layer with number of output nodes as 2 with softmax activation, as the architecturewouldbepredictingtwoclasses.
Thearchitectureofmodel2willbesimilartomodel1, withtheadditionofanaugmentationlayeratthebeginning.Following arethetransformationsincludedinouraugmentationlayer:
i. Random translation with 0.2 height and width factorandwrapasthefillmode:
Duringtraining,thislayerwillapplyrandomtranslationstoeachimage,fillingemptyspaceaccordingtothefillmode.
International Research Journal of Engineering and Technology (IRJET) e-ISSN: 2395-0056
Volume: 09 Issue: 05 | May 2022 www.irjet.net p-ISSN: 2395-0072
ii. Randomflipwithhorizontalmode:
Dependingonthemodeparameter,thislayerwillflipthephotos horizontally orvertically. Theoutput will beidenticaltothe inputatinferencetime.
iii. Randomrotationwithfactorof0.1: Thislayerwillrotateeachimageatrandom, fillingemptyspaceaccordingtothefillmode.
iv.Randomcontrastwithafactorof0.2:
This layer will use a random factor to modify the contrast of an image. During training, the contrast ofeach channel of eachimageismodifiedseparately.
v.Randomzoomwithafactorof0.1:
Thislayerwillzoominandoutofapictureatrandomoneachaxis,fillingemptyspaceaccordingtofillmode.
The architecture used in this model is called VGG16.The input to the first convolutional layer is a 224 * 224 RGB image with a fixed size. A sequence of convolutional layers are being used to process the image,each with a relatively restricted receptivefieldofsize3*3.
Afewoftheconfigurationsalsoutilizes1*1convolutionfilters,whichcouldbeconceivedasalinearchangeoftheinput channels.
Thestrideoftheconvolutionisalways1pixel.
Portionoftheconvolutionallayersaresucceededbyfivemax poolinglayers,whichperformspatialpooling.
Strideof2willbeusedtomax poolovera2*2pixelframe.
ThreeFullyConnectedlayersaccompanyastackofconvolutionallayers.Thefirst2willalwayshave4096channels,whilethe 3rdwillhave1000channelsduetotheusageofa1000 wayILSVRCclassificationsystem(oneforeachclass).Thelastlayer wouldbethesoft maxlayer.Thefullyconnectedlevelsinallnetworksaresetupinthesameway,witheachconcealedlayer havingaReLUactivationfunction.
The AlexNet architecture consists of 8 layers with 3 FC layers AND 5 convolutional layers. This architecture is famous for avoidingoverlappingasithas60millionparameters.Approachesusedinthismodel:
Relu is employed instead of a tanh function, which was quite common until then. The benefit of ReLU is noticeable while trainingourdataset.Ithasbeenproven thatwhiletrainingusingtheCIFAR 10dataset,compared toCNN withtanh theCNN modelsusingReLUactivationcanreacha25%errorsixquicker.
InCNNs,theoutcomesofneighboringinterconnected neuronsarefrequentlypooled.However,introducingoverlapyieldeda 0.5percentdropinerror,suggestingthatmodelswithoverlappingpoolingaremorechallengingtooverfit.
© 2022, IRJET | Impact Factor value: 7.529 | ISO 9001:2008 Certified Journal | Page3695
International Research Journal of Engineering and Technology (IRJET) e-ISSN: 2395-0056
Volume: 09 Issue: 05 | May 2022 www.irjet.net p-ISSN: 2395-0072
Instead of applying standardization to the entire image, aspecific section was selected. This approach enhancesthe model's overalleffectiveness.
Theformulabehindthesizeofoutputimageforthenextlayer:
n in:Numberofinputfeatures
n out:Numberofoutputfeaturesk:convolutionalkernelsize
p:convolutionalpaddingsizes:convolutionalstridesize
We successfully developed a solution to our problem of classifying an abnormal brain from a normal brain. With the use of Convolutional Neural Network based model we were able to construct a system of classification capabilities with high accuracyandperformance.Withadvanceper processingtechniques,labellinganddataaugmentationwewereabletoprovide thenecessary
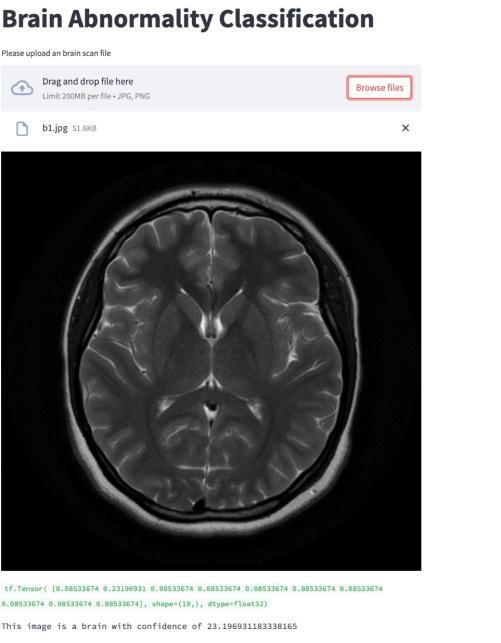
Fig. 11. The Web App characteristicsto ourmodel. Our final model yielded an accuracy of 92.31%. In orderto showcase ourmodel andits working, wewerealsoabletosuccessfullydevelopafullymanagedweb apptoclassifybrainimagesandabnormalitiesasitcanbeseen intheimagebelow:
WithproperlydevelopedCNNDesign,ourmodelcanbeusedtoclassifybrainabnormalitiesfromanyimage.
1. VanHespen, K.M.,Zwanenburg, J.J.M., Dankbaar, J.W. et al. Ananomalydetection approach to identify chronic brain infarcts on MRI. SciRep 11, 7714(2021).https://doi.org/10.1038/s41598 021 87013 4
© 2022, IRJET | Impact Factor value: 7.529 | ISO 9001:2008 Certified Journal | Page3696
International Research Journal of Engineering and Technology (IRJET) e-ISSN: 2395-0056
Volume: 09 Issue: 05 | May 2022 www.irjet.net p-ISSN: 2395-0072
2. Baur C, Wiestler B, Muehlau M, Zimmer C, Navab N, Albarqouni S. Modeling Healthy Anatomy with Artificial Intelligence for Unsupervised Anomaly Detection in Brain MRI. Radiol Artif Intell. 2021 Feb 17;3(3):e190169. doi: 10.1148/ryai.2021190169.PMID:34136814;PMCID:PMC8204131.
3. Gao, L., Pan, H., Li, Q. et al. Brain medical image diagnosis based on corners with importance values. BMC Bioinformatics 18, 505(2017).https://doi.org/10.1186/s12859 017 1903 6
4. Shahriar,Sakib&Al Ali,A.&Osman,Ahmed&Dhou,Salam&Nijim, Mais.(2020).MachineLearningApproachesfor EVChargingBehavior:AReview. IEEEAccess 8 168980 168993 10 1109/ACCESS.2020.3023388.
5. Guizard,Nicolas&Coupé,Pierrick&Fonov,Vladimir&Phd,José&Arnold,Douglas&Collins,Louis.(2015).Rotation invariantmulti contrastnon localmeansforMSlesionsegmentation.
6. Modeling Healthy Anatomy with Artificial Intelligence for Unsupervised Anomaly Detection in Brain MRI ’ by ChristophBaur,BenediktWiestler,MarkMuehlau,ClausZimmer,NassirNavabandShadiAlbarqouni
7. Wavemetrics.” I g o r P ro f ro m Wa v e M e t r i c s , h ttps://www.wavemetrics.com/products/igorpro/imageprocessing/ imagetransforms/histmodification.
8. “Python:BilateralFiltering.” GeeksforGeeks,31Oct.2021,https://www.geeksforgeeks.org/python bilateral filtering/.
9. Grossi, Enzo & Buscema, Massimo. (2008). Introduction to artificial neural networks. European journal of gastroenterology&hepatology.19.1046 54.10.1097/MEG.0b013e3282f198a0.
10. Simonyan, Karen & Zisserman, Andrew. (2014). Very Deep Convolutional Networks for Large Scale Image Recognition.arXiv1409.1556.
11. K. Lee, S. H. Sung, D. h. Kim and S. h. Park, "Verification of Normalization Effects Through Comparison of CNN Models," 2019 International Conference on Multimedia Analysis and Pattern Recognition(MAPR), 2019, pp. 1 5, doi: 10.1109/MAPR.2019.8743531.
12. Hyperspectral Remote Sensing Image Classification Based on Maximum Overlap Pooling Convolutional Neural Network Scientific Figure on ResearchGate. Available from: https://www.researchgate.net/figure/ Maximum overlap pooling CNN parameter table_tbl4_328468285[accessed22Jan,2022]
13. SusmagaR.(2004)ConfusionMatrixVisualization.In:KłopotekM.A., WierzchońS.T.,TrojanowskiK.(eds)Intelligent Information Processing and Web Mining. Advances in Soft Computing, vol 25. Springer, Berlin, Heidelberg.https://doi.org/10.1007/978 3 540 39985 8_12
14. H .Ide and T. Kurita, "Improvement of learning for CNN with ReLU activation by sparse regularization," 2017 International Joint Conference on Neural Networks (IJCNN), 2017, pp. 2684 2691, doi: 10.1109/ IJCNN.2017.7966185.
15. HanJ.,MoragaC.(1995)Theinfluenceofthesigmoidfunctionparametersonthespeedofbackpropagationlearning. In:Mira J.,SandovalF.(eds)FromNaturaltoArtificialNeuralComputation.IWANN1995.LectureNotesinComputer Science,vol930.Springer,Berlin,Heidelberg.https://doi.org/10.1007/3 540 59497 3_175
© 2022, IRJET | Impact Factor value: 7.529 | ISO 9001:2008 Certified Journal | Page3697