International Research Journal of Engineering and Technology (IRJET) e ISSN: 2395 0056

Volume: 09 Issue: 05 | May 2022 www.irjet.net p ISSN: 2395 0072
International Research Journal of Engineering and Technology (IRJET) e ISSN: 2395 0056
Volume: 09 Issue: 05 | May 2022 www.irjet.net p ISSN: 2395 0072
Department of Refrigeration and Air Conditioning Technology, Faculty of Technology and Education, Helwan University, 11282, Cairo, Egypt ***
Abstract - This paper presents a new form of solar stills, the oval tube solar still (OTSS). It aims to increase the daily; production rate of freshwater by using some improvements such as covering cooling water, OTSS is characterized by its simple design. The OTSS is used with and without cooling water. Experiments have been carried out in Cairo, Egypt climatic conditions. Different design parameters are investigated; depth of saltwater in the basin of (2, 1.5, 1, and 0.5 cm). It is found that, without cooling water, the production rate decreases with increasing the water depth in the basin, and the maximum production rate reached 5.11 L/m2/day at 0.5 cm water depth, with the highest efficiency of about 43.35 %.
Key Words: Solar desalination; oval tubular solar still; covercooling;Productivityenhancement.
Water is one of the most important elements of human and animal life. Thus, the supply of potable water has always been a major concern in humanitarian affairs. It is very difficult for human life to find a source of drinking water, especially in remote areas. Water covers almost two thirdsoftheEarth'ssurface,morethan97%ofwhich isintheoceans,2%isfrozenasicebergsandglaciers,and only1%isavailableaspotablewater.Thus,mostwateron Earthisnotsuitableorsafe todrink [1].Nowadays,many differentmethodsareusedtoproducepotablewaterfrom pollutedorsalinewater.Theoldestmethodofpurification is called desalination which uses energy to remove impurities from the water. Considering the availability of renewable energies such as wind and solar energy in remote areas, these are the best options for making polluted and saline water safe to drink. Solar distillation uses solar energy to produce freshwater. Thus they are moreeconomicalthanotherdistillationsystems[2,3].
Many researchers have made many different experiments to improve the performance of solar stills to increase the daily rate produced from desalinated water [4], such as using hot water heated by solar radiation [5 7],theuseofnanofluids,whichachieveda38%increasein productivity[8,9],useanaircompressortopumphotair into the saltwater basin[10], the use of phase change materials[11],theuseofasolarchimney,whichledtoan increase in productivity by 46.3% [12], Installing internal
and external condensers [13, 14], paint the basin in black with the use of nanomaterial[15], combined wick and cover cooling [16], the integration of phase change material and nanoparticles, where an experimental study of the solar still using paraffin wax was carried out, with the performance enhanced by adding nanoparticles (Al2O3), and the improvement percentage was 45% after adding(Al2O3)[7].
Intheyear 2020, [17] experimental study was presented for circular tubular solar still. The study was conducted under the weather conditions of Tanta city Egypt. Two cases were worked on the first case, which is the traditional circular solar still without additives, and the second case is the use of paraffin wax as a heat storage method in order to increase productivity and achieve the bestperformanceofthesolarstill,whereparaffinwaxwas shipped inside 10 copper tubes, was placed under the saltwater basin. The system productivity and efficiency reached 4.31 L/m2/day and 33.8% without paraffin wax, respectively, but after adding paraffin wax, the productivity and efficiency increased to 9.05 L/m2/day and 72.7%, respectively and the improvement rate in productivity was 115% [17]. Also, in the year 2020, an experimental study of circular tubular solar still was carried out, and three cases were worked. The first case was the traditional circular tubular solar still, the second case was the use of phase change material, which is paraffin wax, and the third case was the merging of paraffin wax with nanoparticles, which is graphene, and the productivity was in the three Cases of 4.3, 6, and 7.9 L/m2 respectively, and efficiency 31, 46, and 59%, respectively[18].
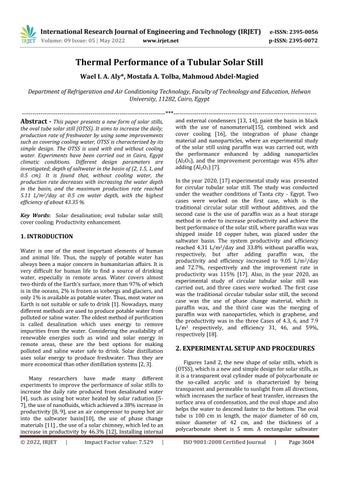
Figures 1and 2, the new shape of solar stills, which is (OTSS),whichisanewandsimpledesignforsolarstills,as itisa transparentoval cylinder made ofpolycarbonate or the so called acrylic and is characterized by being transparentandpermeabletosunlightfromalldirections, whichincreasesthesurfaceofheattransfer,increasesthe surface area of condensation, and the oval shape and also helps the water to descend faster to the bottom. The oval tube is 100 cm in length, the major diameter of 60 cm, minor diameter of 42 cm, and the thickness of a polycarbonate sheet is 5 mm. A rectangular saltwater
International Research Journal of Engineering and Technology (IRJET) e ISSN: 2395 0056
Volume: 09 Issue: 05 | May 2022 www.irjet.net p ISSN: 2395 0072
basinof80cmlength,30cmwidth,andheight5cmisput inside the oval tube Table 1 shows the still design parametersused.
Property cm 100
Unit Value
Stilllength cm 60
Majordiameter cm 42 Minordiameter mm 5
Acrylicthickness cm 80x30x5
Basinwaterdimensions cm 80x30x5.6
Basinwaterandparaffindimensions cm 10 Thedistancebetweeneachtwo adjacentsprinklers
Thefollowingequationisusedinfindingtotaluncertainty ofanyfunction y [19 22]
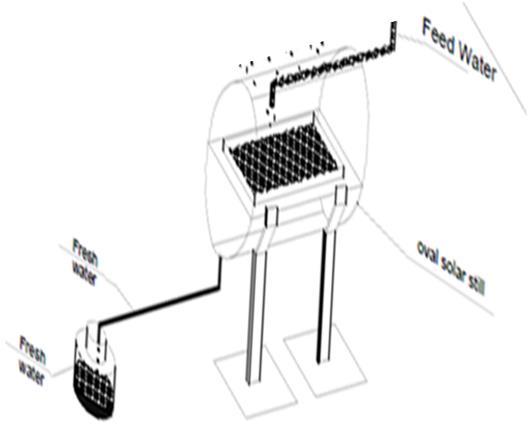
Fig.1.Schematicdiagramoftheexperimentalsetup
( ) √( ) ( ) ( ) ( ) ( ) ( ) ( )
Where ( ) the uncertainty of the variable x, uxn is the uncertainty of parameter and xn is the parameter of interest.
It is estimated that, uncertainties of thermocouples, solar power meter, calibrated flask and hot wire anemometer are ±0.10,±2.88, ±2.88,and±0.06,respectively.
The climatic conditions in this experimental work are represented by the ambient temperature. The intensity of solar radiation and the wind speed variables affected the performance of the OTSS. The experimental work carried out during August and September of 2020 during the summer season in Cairo (latitude. 30.10º N, longitude. 31.29ºE),Egypt.
A sample figure Fig. 3 is presented for the first case without cooling. It is found that the ambient temperature ranges between 31˚C at the beginning of the experiment till reaching its highest value 38.8˚C at 13:00 noon and thengraduallydecreasesto30˚C aftersunset,asshownin Fig. 3(a). Also, Fig. 3(b) shows the intensity of solar is recorded through the days of the experiment, ranging from the minimum 550w/m2 at 9am and its maximum value1058w/m2,andgraduallydecreasingto400w/m2 at the end of the experiment at 6pm at noontime. The wind speed during the days of the experiment at different depths of the saltwater in the basin is shown in Fig. 3(c), asthevaluesrangebetween1.14 3.25m/s.
Solar Radiation (w/m 2
International Research Journal of Engineering and Technology (IRJET) e ISSN: 2395 0056
Volume: 09 Issue: 05 | May 2022 www.irjet.net p ISSN: 2395 0072
Levelbasinwater
d=0.5cm01-8-2020 d=1cm05-8-2020 d=1.5cm09-8-2020 d=2cm 14-8-2020
Time(h)
Levelbasinwater d=0.5cm01-8-2020 d=1cm05-8-2020 d=1.5cm09-8-2020 d=2cm14-8-2020
Levelbasinwater d=0.5cm01-8-2020 d=1cm05-8-2020 d=1.5cm09-8-2020 d=2cm14-8-2020 Wind speed (m/s)
Time(h)
Fig.3 Climaticcondition(A)ambienttemperature,(B) solarradiation,and(C)windspeed.
3.2Theeffectofdifferentsaltwaterdepthsinthebasinon OTSSperformance.
Four different depths of saltwater inside the basin were investigated, namely 0.5, 1, 1.5, and 2 cm, in order to determine the best depth of saltwater inside the basin. Figure 4 (a) shows the relation between saltwater depth
70
65
60
55
50
45
40
and its temperature with time. It is clear that the lowest temperature of the water inside the basin is at the beginning and the end of the day, namely at 9:00 and 18:00,whileitsmaximumvalueisatnoon(13:00)andthe maximum value obtained is 65 ˚C, as this degree was achieved at the lowest water depth, which is 0.5 cm at 1 PM, while the maximum temperature was obtained at the largest depth of the saltwater, which is 2 cm, the temperature was 52 ˚C and the water temperature reached57and62˚Catdepth1.5and1cm,respectively.It is clear that the lower the depth of the water inside the basin,thefasterthewatertemperatureincreases,andthis leads to a higher evaporation rate. On the contrary, the large depth of water takes a long time to heat up and evaporate. Figure 4(b) shows the surface temperature of the solar distiller (polycarbonate) during the study days with different depths of water, where the lowest temperatureoftheovaltubesurfacereached32˚Candthe maximum temperature 50 ˚C. As seen the temperature among the four cases is relatively small compared to the differenceinwatertemperatures.Itisclearthatthelower depth of the basin water increases rapidly the water temperature and leads to a higher evaporation rate and hence a higher cover temperature and vice versa. It is notedthatthehighesttemperaturesofthecoveroccurred atthelowestdepthofthewater. 8 910111213141516171819 30
Levelbasinwater Basin water temperature ( o C ) Time(h)
(A)
35
(B) Levelbasinwater cover temperature ( o C ) Time(h)
0.5cm 1cm 1.5cm 2cm 8 910111213141516171819 30 32 34 36 38 40 42 44 46 48 50 52 54 56 58 60
0.5cm 1cm 1.5cm 2cm
Fig.4 Effectofvarioussaltwaterdepthsinthebasinon OTSSperformance(A)basinwatertemperature,and(B) coversurfacetemperature
International Research Journal of Engineering and Technology (IRJET) e ISSN: 2395 0056
Volume: 09 Issue: 05 | May 2022 www.irjet.net p ISSN: 2395 0072
Figure 5(A) illustrates the production of desalinated water every hour at different depths, where the production of water increases every hour starting from the morning until it reaches its maximum production at noontime,thenreturnstograduallydecreaseaftersunset. Thehighestproductionofdesalinatedwatereveryhourat varioussaltwaterdepths2,1.5,1,and0.5cmis0.64,0.70, 0.75,and0.84L/h,respectively.Itisclearthatthesmaller the depth of the water, the higher the rate of desalinated water production because the lower depth of the water needsasmallamountofheatandlesstimetoheatupand evaporate. Moreover, the temperature variation between the tube surface and the saltwater reaches its maximum valueasthedepthofthewaterdecreases[23].
Normally,heatistransferredfromthevaporasaresult of its condensation to the inner surface of the distiller cover, and then this heat is lost to the ambient by two methods of heat transfer, which are convection and radiation relatively and it increases when the wind speed islow[24].Accordingly,the temperatureoftheinnerand outer surface of the cover is high, close to the vapor temperature,whichreducesthethermalperformance,and to increase the temperature difference between them, waterisusedforcooling.Aircoolingcanalsobeused,and air and water can be used together to increase thermal performance[25].
1.0 (A)
0.9
0.8
0.7
0.6
0.5
0.4
0.3
Figure 5(B)illustratesthe rateof thetotal production offreshwateratvariousdepths,whichare4.14,4.42,4.67, and 5.11 L/m2/day at depths of 2, 1.5, 1, and 0.5cm, respectively. As seen, the accumulated production of desalinatedwateratthedepthof0.5cmishigherthanthe depths of 2, 1.5, and 1cm by 23.42%, 15.61%, and 9.42%, respectively. 78910111213141516171819 0.0
Levelbasinwater Hourly productivity (L/m 2 ) Time(h)
Thermalefficiency( )iscalculatedthroughEq.(2).It is defined as the ratio between the products of the total freshwater produced per hour multiplied by the latent heat of vaporization of water and divided by the product of the sum of the total solar radiation intensity per day multipliedbythetotalabsorptionarea[26 29] ∑ ∑ ( )
Knowingthat( )totalfreshwaterproducedperhour Kg/h,( ( ))totalsolarirradianceperdayW/m2,( ) total absorption area m2, and ( ) water latent heat of vaporizationJ/kg.
0.2
0.1
Levelbasinwater (B)
d=0.5cm d=1cm d=1.5cm d=2cm 78910111213141516171819 0.0 0.5 1.0 1.5 2.0 2.5 3.0 3.5 4.0 4.5 5.0 5.5 6.0 d=0.5cm d=1cm d=1.5cm d=2cm Accumulated water productivity (L/m 2 )
Time(h)
Fig.5EffectofvarioussaltwaterdepthsonOTSS performance(a)hourlyproductivity(b)accumulated waterproductivity
ThroughtheresultsandcompensationinEq.(2)itisclear that the efficiency of the OTSS reached 43.35% at the lowest depth of the saltwater, which is 0.5cm, and this percentage in without any improvement or additions to thesystem
Table (2) presents a comprehensive comparison from literature for the cost analysis of OTSS, TSS, and CSS. It is clear that the cost of one liter of desalinated water using the OTSS is lower than the cost of using the TSS and conventional stills CSS, as it is clear that it achieves the highestresultsintermsofefficiencyandproductivity.
Table (2) ComparisonofpresentOTSSperformanceand differentCSSandTSS
Presentstudy (OTSS)
Totalfreshwater(L/m2/day) Reference 29.98 2.8 [24] Notgiven 3.5 [25] 31.99 2.14 [14] 29.20 2.1 [30] 29.98 2.9 [31] 41.4 5.45 [23] 43.35 5.11
ƞ ,(%)
International Research Journal of Engineering and Technology (IRJET) e ISSN: 2395 0056
Volume: 09 Issue: 05 | May 2022 www.irjet.net p ISSN: 2395 0072
1. The depth of salty water significantly affects productivity, for the case of without additions, the productionratedecreaseswithincreasingthewaterdepth in the basin, and the maximum production rate reached was5.11L/m2/dayatwaterdepthof0.5cm.
2. at the lowest saltwater depth of 0.5 cm, the daily efficiencywithoutandwithcoolingwaterwas43.35%and 58.44respectively.
Nomenclature
totalabsorptionarea,m2 waterlatentheatofvaporization,J/kg totaldailyvalueofsolarradiation,W/m2 ( ) totalsolarirradiance,W/m2 totalfreshwaterproduced,kg/h Greek Letters
Thermalefficiency uncertainty Scripts
dailyproductivity,L/m2/day a Ambient bw basinwater w Wind x Variable xn Parameterofinterest t temperature,˚C ambienttemperature,˚C Acronyms and Abbreviations
OTSS ovaltubularsolarstill, PSS pyramidsolarstill, TSS tubularsolarstill
1. Edalatpour, M., et al., Solar stills: A review of the latest developments in numerical simulations. Solar Energy,2016. 135:p.897 922.
2. Mahian, O. and A. Kianifar, Mathematical modelling andexperimental studyofa solardistillationsystem. Proceedings of the institution of mechanical engineers, Part C: Journal of Mechanical Engineering Science,2011. 225(5):p.1203 1212.
3. Mahian, O., et al., Nanofluids effects on the evaporation rate in a solar still equipped with a heat exchanger.Nanoenergy,2017. 36:p.134 155.
4. Sharshir, S., et al., Thermal performance and exergy analysis of solar stills A review. Renewable and SustainableEnergyReviews,2017. 73:p.521 544.
5. Khairat Dawood, M.M., et al., Increasing the freshwater productivity of a solar still loaded with
CuO nanofluids using vibration motion and cover cooling techniques. International Journal of Energy Research,2021. 45(6):p.9099 9115.
6. Sampathkumar,K.andP.Senthilkumar,Utilizationof solar water heater in a single basin solar still an experimentalstudy.Desalination,2012. 297:p.8 19.
7. Rajasekhar, G. and M. Eswaramoorthy, Performance evaluation on solar still integrated with nano composite phase change materials. Applied Solar Energy,2015. 51(1):p.15 21.
8. Sharshir,S.W.,etal.,Aminireviewoftechniquesused to improve the tubular solar still performance for solar water desalination. Process Safety and EnvironmentalProtection,2019. 124:p.204 212.
9. Kabeel, A., Z. Omara, and F. Essa, Enhancement of modified solar still integrated with external condenser using nanofluids: An experimental approach.Energyconversionandmanagement,2014. 78:p.493 498
10.Joy, N., A. Antony, and A. Anderson, Experimental study on improving the performance of solar still using air blower. International Journal of Ambient Energy,2018. 39(6):p.613 616.
11.Abu Arabi,M.,etal.,Theoreticalinvestigationofsolar desalination with solar still having phase change material and connected to a solar collector. Desalination,2018. 448:p.60 68.
12.Kiwan, S. and I. Salim, A hybrid solar chimney/photovoltaic thermal system for direct electric power production and water distillation. Sustainable Energy Technologies and Assessments, 2020. 38:p.100680.
13.Kabeel, A.E., et al., Effect of water depth on a novel absorberplateofpyramidsolarstillcoatedwithTiO2 nanoblackpaint.Journalofcleanerproduction,2019. 213:p.185 191.
14.Sharshir, S., et al., Enhancing the solar still performance using nanofluids and glass cover cooling: experimental study. Applied thermal engineering,2017. 113:p.684 693.
15.Peng, G., et al., Low cost high efficiency solar steam generator by combining thin film evaporation and heat localization: Both experimental and theoretical study. Applied Thermal Engineering, 2018. 143: p. 1079 1084.
16.Arunkumar, T., et al., Effect of water and air flow on concentric tubular solar water desalting system. Appliedenergy,2013. 103:p.109 115.
17.Kabeel, A., et al., Augmentation of diurnal and nocturnal distillate of modified tubular solar still having copper tubes filled with PCM in the basin. JournalofEnergyStorage,2020. 32:p.101992.
18.Thalib,M.M.,etal.,Comparativestudyoftubularsolar stillswithphasechangematerialandnano enhanced phase change material. Energies, 2020. 13(15): p. 3989.
International Research Journal of Engineering and Technology (IRJET) e ISSN: 2395 0056
Volume: 09 Issue: 05 | May 2022 www.irjet.net p ISSN: 2395 0072
19.Kabeel, A., M. Abdelgaied, and M. Mahgoub, The performance of a modified solar still using hot air injection and PCM. Desalination, 2016. 379: p. 102 107.
20.Alaian,W.,E.Elnegiry,andA.M.Hamed,Experimental investigation on the performance of solar still augmented with pin finned wick. Desalination, 2016. 379:p.10 15.
21.Rahbar, N., A. Asadi, and E. Fotouhi Bafghi, Performanceevaluationoftwosolarstillsofdifferent geometries: tubular versus triangular: experimental study,numericalsimulation,andsecondlawanalysis. Desalination,2018. 443:p.44 55.
22.Shalaby, S., E. El Bialy, and A. El Sebaii, An experimental investigation of a v corrugated absorber single basin solar still using PCM. Desalination,2016. 398:p.247 255.
23.Kabeel, A., et al., Improving performance of tubular solar still by controlling the water depth and cover cooling. Journal of cleaner production, 2019. 233: p. 848 856.
24.Omara, Z., et al., The cooling techniques of the solar stills' glass covers A review. Renewable and SustainableEnergyReviews,2017. 78:p.176 193.
25.Suneesh, P., et al., Effect of air flow on “V” type solar still with cotton gauze cooling. Desalination, 2014. 337:p.1 5.
26.Velmurugan, V., et al., Desalination of effluent using fin type solar still. Energy, 2008. 33(11): p. 1719 1727.
27.Dashtban, M. and F.F. Tabrizi, Thermal analysis of a weir type cascade solar still integrated with PCM storage.Desalination,2011. 279(1 3):p.415 422.
28.Kabeel, A., et al., Theoretical and experimental parametric study of modified stepped solar still. Desalination,2012. 289:p.12 20.
29.El Sebaii, A., et al., Thermal performance of a single basin solar still with PCM as a storage medium. AppliedEnergy,2009. 86(7 8):p.1187 1195.
30.Sharshir, S.W., et al., Energy and exergy analysis of solar stills with micro/nano particles: a comparative study. Energy conversion and management, 2018. 177:p.363 375.
31.Winston, D.P., et al., Experimental investigation on hybrid PV/T active solar still with effective heating andcovercoolingmethod.Desalination,2018. 435:p. 140 151.
Wael Aly,isaprofessorandthehead of the Refrigeration and Air Conditioning Technology Department, Faculty of Technology and Education, Helwan University, Cairo, Egypt. He obtained his B.Sc. (1994) in Mechanical Power Engineering from Benha University, Egypt and M.Sc. (1997) from Eindhoven University of Technology, the Netherlands. He obtained also the PhD (2007) from Okayama University, Japan. He is the author and co author of than 40 papers in the fields of Thermofluids, RHVAC, andCFD.


Mahmoud Mohammed Abdelmagied, is a Lecturer at the Department of Refrigeration and Air Conditioning Technology, Faculty of Industrial Education, Helwan University, Cairo Egypt. He obtained his B.Sc. (2007) in industrial Education from Helwan University, Egypt and M.Sc. (2012) from Suez University, Egypt. He obtained also the Ph.D (2017) from Helwan University, Egypt. He has about 13 research papers in the fields of Thermofluid, RHVAC, and CFD.
MostafaA.Tolbaisademonstratorat the Refrigeration and Air Conditioning Technology Department, Faculty of Technology and Education, Helwan University, Cairo,Egypt.