International Research Journal of Engineering and Technology (IRJET) e-ISSN: 2395-0056

Volume: 09 Issue: 05 | May 2022 www.irjet.net p ISSN: 2395 0072
FEATURE EXTRACTION FROM RETINAL FUNDUS IMAGES
A. ARUL AFRIN MARY1 , I. MUTHUMANI2, V. SELVAKUMAR3
1Student, Dept. of ECE, GCE, Tirunelveli, Tamil Nadu, India
2Professor, Dept. of ECE, GCE, Tirunelveli, Tamil Nadu, India
3Assistant Professor, Dept. of ECE, GCE, Tirunelveli, Tamil Nadu, India ***
Abstract - COVID 19 pandemic has brought around changes in human life and work habits due to lockdown and has resulted in an increase in the frequency of numerous conditions like Diabetes. One such side effect of Diabetes is Diabetic Retinopathy. The proposed method aims to detect the optic disc, blood vessels and exudates in the retinal fundus images. Optic disc is detected using Histogram Normalization technique. Blood vessels are detected using Kirsch’s template and Morphological Operations. Exudates appear as small white dots on the retinal fundus images which are detected using Morphological Operations. Retinal fundus images for testing were collected from the standard diabetic retinopathy database DIARETDB0 and DIARETDB1. From the results, it is found that the area of the extracted optic disc, blood vessels and exudates are more accurate than the state of the art methods.
Key Words: Fundus Images, Optic Disc, Blood Vessels, Exudates, Morphological Operations.
1. INTRODUCTION
Humaneyeisasensereceptorthatreactstolight and permits vision with the assistance of the photoreceptorcells(rodandconecells)presentinit.Rod cell is helpful for vision during night time or in dim light and this vision is named as scotopic vision. Cone cells facilitate vision during daytime or in bright light and this visionistermedasphotopicvision.Internalsurfaceofthe eye isthe fundus whichincorporates macula,retina,optic disc and fovea and can be examined by ophthalmoscope and/or fundus photography. Optic disc also known as optic nerve head is the point where the optic nerve connectstothebrain.Opticdiscisadditionallyreferredto as blind spot since it doesn’t embody any photoreceptor cells.Commoneyedisordersarecataract,nightblindness, glaucoma,DiabeticRetinopathy.
Cataractsmayoccureitherduetoaneyeinjuryor excessive exposure to actinic radiations. Nyctalopia also called night blindness is a condition where the affected personisunabletoseeduringnighttimeorindimlight.It may also occur due to the deficiency of Vitamin A. Glaucomaisa groupofeye conditionswhichdamagesthe opticnervecausedbyanabnormallyhighpressurewithin theeye.
Insulin secreted by the duct gland helps glucose fromfoodgetintothecellstobeusedforenergy.Diabetes
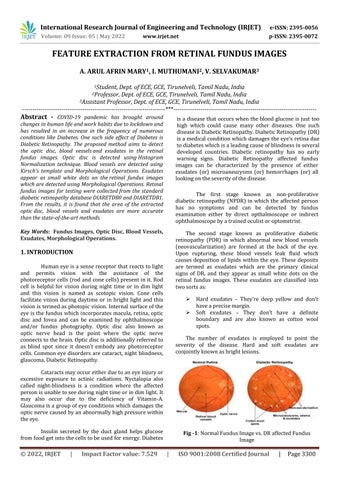
isa diseasethatoccurswhenthebloodglucoseisjusttoo high which could cause many other diseases. One such diseaseisDiabeticRetinopathy.DiabeticRetinopathy(DR) isamedicalconditionwhichdamagestheeye’sretinadue todiabeteswhichisaleadingcauseofblindnessinseveral developed countries. Diabetic retinopathy has no early warning signs. Diabetic Retinopathy affected fundus images can be characterized by the presence of either exudates (or) microaneurysms (or) hemorrhages (or) all lookingontheseverityofthedisease.
The first stage known as non proliferative diabetic retinopathy (NPDR) in which the affected person has no symptoms and can be detected by fundus examination either by direct opthalmoscope or indirect ophthalmoscopebyatrainedoculistoroptometrist.
The second stage known as proliferative diabetic retinopathy (PDR) in which abnormal new blood vessels (neovascularization) are formed at the back of the eye. Upon rupturing, these blood vessels leak fluid which causes deposition of lipids within the eye. These deposits are termed as exudates which are the primary clinical signs of DR, and they appear as small white dots on the retinal fundus images. These exudates are classified into twosortsas:
Hard exudates They’re deep yellow and don’t haveaprecisemargin.
Soft exudates They don’t have a definite boundary and are also known as cotton wool spots.
The number of exudates is employed to point the severity of the disease. Hard and soft exudates are conjointlyknownasbrightlesions.
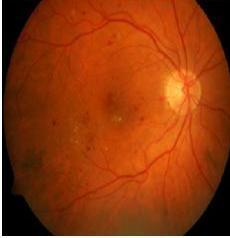
Fig 1:NormalFundusImagevs.DRaffectedFundus Image
International Research Journal of Engineering and Technology (IRJET) e ISSN: 2395 0056
Volume: 09 Issue: 05 | May 2022 www.irjet.net p ISSN: 2395 0072
Microaneurysm is an eye condition in which tiny reddotsencircledbyyellowringsarefoundwithintheeye as a result of vascular leakage. Retinal hemorrhage refers to abnormal bleeding within the delicate blood vessels of the retina whose symptoms range from the undetectable to severe vision issues. Vision problems are often temporary, but in some instances, they’ll be permanent. Microaneurysms and hemorrhages are jointly known as redlesions.
2. PROPOSED METHODOLOGY
The detection of optic disc, blood vessels and exudates is a major problem in the automatic processing of retinal images. The segmentation of exudates is essential in differentiating the normal eye from the DR affected eye. In this work fundus image of the retina is used.MATLABisusedforimplementingtheprocess.
2.1 Dataset
The retinal fundus images for testing were taken from the standard publicly available Diabetic Retinopathy databaseDIARETDB0andDIARETDB1.
2.2 Preprocessing
Preprocessing includes resizing of the retinal fundus images and choosing the appropriate color componentfromtheRGBimage.
The retinal fundus images collected for testing were of different resolutions. In order to maintain a uniform resolution, all the images collected were resized to512x512pixels.Theresizedretinalfundusimageswere in RGB colour space. The contents in the blue colour channel of the image are of low contrast whereas the red colourchannel of the image is noisy. The opticdisc, blood vesselsandexudateshasgoodcontrastinthegreencolour channel of the image. Hence the green channel is chosen fortheanalysisoftheretinalfundusimages.
2.3 Image Enhancement
CLAHE (Contrast Limited Adaptive Histogram Equalization) algorithm is applied for noise reduction by increasing the contrast and filtering of the image. Histogram equalizationisusedforenhancing thecontrast of the image. It removes the background for the resulted imagebyconvertingthebackgroundtowhitecolor(every pixeloutsidethewhiteboardchangedtowhitecolor).
2.4 Exudates Detection
The proposed technique for the detection of exudates in the retinal fundus images is implemented using morphological top and bottom hat filtering operations.
Theflowdiagramforexudatesfeatureextractionintheretinalfundusimagesisshowninfig.3
The flow diagram for exudates extraction in the retinalfundusimagesisshowninfig.2
RetinalFundusImages
ExtractGreenChannel
MorphologicalBottomHatMorphologicalTopHat
ExtractedExudatePixelsConverttoBinaryImage
Fig -2:FlowDiagramforExudatesExtraction
Fig. 3Flow Diagram for Exudates Extraction
The exudates from the retinal fundus images are detected by applying the morphological bottom hat filtering on the extracted green channel of the fundus imagewithadiscshapedstructuringelement. Bottom hat filtering subtracts the original image from the morphologicallyclosedimage.Thenmorphologicaltop hat filtering is applied on the extracted green channel of the fundusimagewithadiscshapedstructuringelement.Top hat filtering subtracts the morphologically opened image fromtheoriginalimage. Then the bottom hat filtered imageissubtractedfromthetop hatfilteredimage.Thena binary image is obtained by converting the resultant image with a threshold value i.e., the pixels with luminance value greater than the threshold value are replaced by value 1 (white) and the remaining pixels are replacedbyavalue0(black).Thewhitepixelscorrespond totheexudatespixelsintheoriginalimage.
2.5 Blood Vessels Detection
Theproposedtechniqueforthedetectionofblood vesselsin the retinal fundus images isimplemented using Kirsch’stemplates.
Theflowdiagramforbloodvesselsfeatureextractionintheretinalfundusimagesisshowninfig.4
The flow diagram for blood vessel extraction in retinalfundusimagesisshowninfig.3
ExtractGreenChannel
RetinalFundusImages
MorphologicalBottomHatFIRFilter
ExtractedBloodVessel Pixels ThresholdImage
Fig. 4Flow Diagram for Blood Vessels Extraction
Fig 3:FlowDiagramforBloodVesselsExtraction
The blood vessels in the retinal fundus images were detected by applying a 2 dimensional digital finite impulse response (FIR) on the bottom hat transformed
International Research Journal of Engineering and Technology (IRJET) e ISSN: 2395 0056
Volume: 09 Issue: 05 | May 2022 www.irjet.net p ISSN: 2395 0072
image and the Kirsch’s template co efficients. Then a threshold is applied on the 2 D FIR filtered image to extract the pixels of the blood vessels from the filtered image. The pixels greater than the threshold value correspondtothebloodvesselpixels.
2.6 Optic Disc Detection
Theproposedtechniqueforthedetectionofoptic disc in the retinal fundus images is implemented using histogramconversionandnormalizationofhistogram.
The flow diagram for optic disc extraction in retinalfundusimagesisshowninfig.4
ExtractGreenChannel
RetinalFundusImages
NormalizationofHistogram
ThresholdImage
ContrastEnhancement
ExtractedOpticDiscPixels
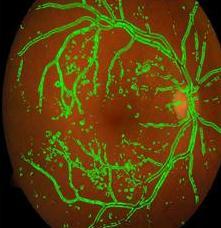
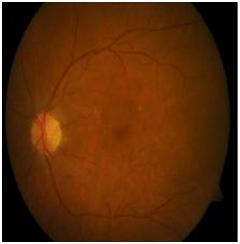
3.2 Detected Optic Disc
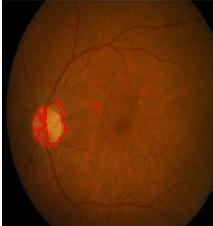
Fig. 7, 8 shows the detected optic edges disc in normalandDRaffectedfundusimages.
Fig 7:DetectedOpticDisc inaNormalRetinalFundus Image
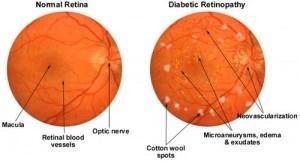
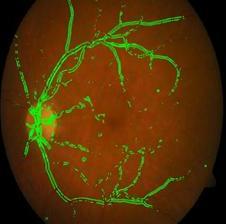
3.3 Detected Blood Vessels
Fig 8:DetectedOpticDisc inaDRaffectedRetinal FundusImage
Fig. 9, 10 shows the detected blood vessels in normalandDRaffectedfundusimages.
Fig. 3Flow Diagram for Optic Disc Extraction
Fig 4:FlowDiagramforOpticDiscExtraction
In image processing, normalization is a process used for changing the range of intensity values of the pixelsintheimage.Itisalsocalledhistogramstretchingor contraststretching.Histogramnormalizationenhancesthe finedetailswithinanimage.Thenathresholdisappliedon the normalized histogram to find the pixels of the optic disc from the normalized histogram. The pixels greater than the threshold value correspond to the optic disc pixels.
3. RESULT
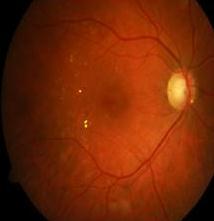
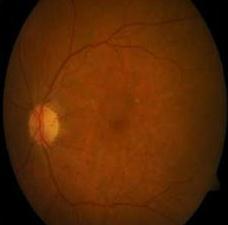
3.1 Retinal Fundus Image
FundusImageconsists ofRGBChannel whichhas uniquefeature.
Fig 9:DetectedBlood VesselsinaNormalRetinal FundusImage
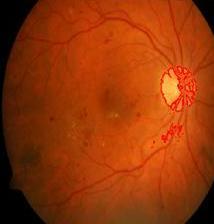
3.4 Detected Exudates
Fig 10:DetectedBlood VesselsinaDRaffected RetinalFundusImage
Fig.11,12showsthedetectedexudatesinnormal andDRaffectedfundusimages.
Fig 5:NormalRetinal FundusImage
Fig 6:DRaffectedRetinal FundusImage
Fig 11:DetectedExudates inaNormalRetinalFundus Image
Fig 12:DetectedExudates inaDRaffectedRetinal FundusImage
International Research Journal of Engineering and Technology (IRJET) e ISSN: 2395 0056
Volume: 09 Issue: 05 | May 2022 www.irjet.net p ISSN: 2395 0072
Fromfig.11,itisobservedthatthenormal retinal fundus images do not have any exudates. The yellow dots intheabovefigure(fig.12)showsthedetectedexudates.
3.5 Area of the Detected Features
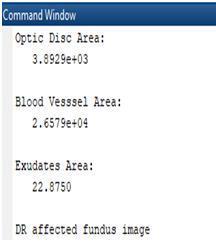
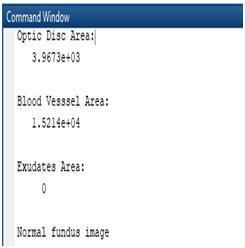
Fig. 13, 14 shows the area of the extracted featuresfromtheretinalfundusimage.
Abramoff,“AutomaticDetectionofRed Lesionsin Digital Color Fundus Photographs,” IEEE Transactions on Medical Imaging, Vol. 24, No. 5, pp.584 592,May2005
[2] Dongbo Zhang, Xiong Li, Xinyu Shang, Yao Yi, Yaonan Wang, “Robust Hemorrhage Detection in Diabetic Retinopathy Detection,” pp. 209 213, 2011IEEE.
[3] Balint Antal, Andras Hajdu, “An Ensemble Based System for Microaneurysms Detection and DiabeticRetinopathyGrading,”IEEETransactions on Biomedical Engineering, Vol. 59, 6, pp. 1720 1726,June2012.
[4] Sohini Roychowdhury, Dara D. Koozekanani, Keshab K. Parthi, “Screening Fundus Images for DiabeticRetinopathy,”pp.1641 1645,2012IEEE.
Fig 13:Areaofthe ExtractedFeaturesina NormalRetinalFundus Image
4. CONCLUSION
Fig 14:Areaofthe ExtractedFeaturesinaDR affectedRetinalFundus Image
Inthiswork,featureslikeopticdisc,bloodvessels and exudates in the human retinal fundus images were extracted. Retinal fundus images including both normal andDiabeticRetinopathyaffectedimagesweretakenfrom the publicly available standard Diabetic Retinopathy Databases like DIARETDB0 and DIARETDB1 for testing. Optic Disc in the retinal fundus images were detected using the Histogram Normalization technique. Blood Vessels in the retinal fundus images were detected using Kirsch’s templates and Morphological Operations Exudatesintheretinalfundusimagesweredetectedusing the Morphological Operations. The area of the extracted features was also measured. The extraction of all the above three features and the area of these extracted features were performed using MATLAB R2018a. From the extracted exudates and its area, it was observed that the area of the exudates was zero in the normal retinal fundus images and greater than zero in the case of DiabeticRetinopathyaffectedretinalfundusimages.From this observation, it is inferred that if the area of the exudates is greater than zero, then the corresponding retinal fundus image can be classified as a Diabetic Retinopathy affected retinal fundus image and if the area of the exudates is equal to zero, then the corresponding retinal fundus image can be classified as a normal retinal fundusimage.
REFERENCES
[1] Meindert Niemeijer, Bram van Ginneken, Joes Staal, Maria S. A. Suttorp Schulten, Michael D.
[5] M.UsmanAkram,ShehzadKhalid,ShoabA.Khan, “Identification and classification of microaneurysms for early detection of diabetic retinopathy,” ELSEVIER Pattern Recognition 46 (2013),pp.107 116.
[6] L.Giancardo,F.Meriaudeau,T.P.Karnowski,K.W. Tobin, E. Chaum, “Validation of Microaneurysm based Diabetic Retinopathy Screening across RetinalFundusDatasets,”pp.125 130,2013IEEE.
[7] Sundararaj Wifred Franklin, Samuelnadar Edwar Rajan, “Diagnosis of Diabetic Retinopathy by employingImageProcessingTechniquestodetect Exudates in retinal images,” IET Image Process, 2014Vol.8,Iss.10,pp.601 609.
[8] R.S.Deshmukh,“AnalysisofDiabeticRetinopathy by Automatic Detection of Exudates,” International Journal of Electronics and Communication Engineering (IJECET), Vol. 5, Iss. 12,December(2014),pp.266 275.
[9] ManojKumarSB,ManjunathR,Dr.HSSheshadri, “Feature extraction from the Fundus Images for the diagnosis of diabetic retinopathy,” International Conference on Emerging Research inElectronics,Computer Scienceand Technology, pp.240 245,2015IEEE.
[10] Sudeshna Sil Kar, Santi P. Maity, “Automatic Detection of Retinal Lesions for Screening of Diabetic Retinopathy,” IEEE Transactions on BiomedicalEngineering,pp.1 9,2016IEEE.
[11] Karan Bhatia, Shikar Arora, Ravi Tomar, “DiagnosisofDiabeticRetinopathyUsingMachine Learning Classification Algorithm,” 2016 2nd
International Research Journal of Engineering and Technology (IRJET) e ISSN: 2395 0056 Volume: 09 Issue: 05 | May 2022 www.irjet.net p ISSN: 2395 0072
International Conference on Next Generation Computing Technologies (NGCT 2016), pp. 347 351,2016IEEE.
[12] Sarni Suhaila Rahim, Vasile Palade, James Shuttleworth, Christiana Jayne, “Automatic screening and classification of diabetic retinopathy and maculopathy using fuzzy image processing,” Brain Informatics (2016) 3: 249 267.
[13] Dilip Singh Sisodia, Shruti Nair, Pooja Khobragde, “Diabetic Retinal Fundus Images: Preprocessing and Feature Extraction For Early Detection of Diabetic Retinopathy,” Biomedical and Pharmacology Journal, Vol. 10(2), pp. 615 626 (2017).
[14] Wei Zhou, Chendong Wu, Dali Chen, Zhenzhu Wang, Yugen Yi, Wenyou Du, “Automatic MicroaneurysmDetectionofDiabeticRetinopathy inFundusImages,”pp.7453 7458,2017IEEE.
[15] Shuang Yu, Di Xiao, Yogesan Kanagasingam, “Exudate Detection for Diabetic Retinopathy with Convolutional Neural Networks,” pp. 1744 1747, 2017IEEE.
[16] Wei Zhou, Chengdong Wu, Xiaosheng Yu, “Computer Aided Diagnosis for Diabetic Retinopathy based on Fundus Image,” Proceedings of the 37th Chinese Control Conference2018,pp.9214 9219.
[17] Zihao Wang, Ke Jia Chen, Lingli Zhang, “A R CNN Based Approach for Microaneurysm Detection in RetinalFundusImages,” 2019.
[18] Muhammad Mateen, Junhao Wen, Nasrullah Nasrullah, Song Sun, Shaukat Hayat, “Exudate Detection for Diabetic Retinopathy using Pretrained Convolutional Neural Networks,” HindawiComplexity,Vol.2020,pp.1 11.
[19] DIARETDB0andDIARETDB1Database.
[20] SoftwarePackage,“MATLAB(2018a)”.
2022, IRJET | Impact Factor value: 7.529 | ISO 9001:2008 Certified Journal