International Research Journal of Engineering and Technology (IRJET) e ISSN: 2395 0056

Volume: 09 Issue: 05 | May 2022 www.irjet.net p ISSN: 2395 0072
International Research Journal of Engineering and Technology (IRJET) e ISSN: 2395 0056
Volume: 09 Issue: 05 | May 2022 www.irjet.net p ISSN: 2395 0072
1 ,
Purushottamsahu2
1BM College of technology Indore, RGPV, Bhopal
2Example: Professor, Dept. of Mechanical Engineering, BM College of technology Indore
*** Abstract
response surface methodology (RSM), Grey relation analysis and regression analysis (RA) for predicting the hardness (HRB)strength,percentage ofelongationandhardnessofbrasswhichiswidelyusedinautomotive,aircraftanddefense industries by incorporating friction stir welding (FSW) process parameter such as tool rotation speed of 1000 rpm, tool travelspeedof20mm/min&2No.ofpasses. Establishedmathematical quadraticregressionmodelwasverymuchfitto the actual experimental results. This experimental analysis also determines the elite combination of input parameters of theFSWtechnique,whichwouldexhibitthebestvaluesofoutputparameters.
CHAPTER 1
1.1
Weldingisajoiningprocessthatfabricatesvariouspartsorcomponentssoastoproduceproductsof complexshapesand geometry, which are otherwise too difficult to produce through other manufacturing processes. In order to produce efficient, compact complex products that can fulfill their functional and esthetic requirements, it is necessary to use a suitable fabrication process to assemble together several smaller components possessing exotic properties. Welding is a common option to join such components. Joining of dissimilar material often poses serious challenges to such an extent thatjoiningissometimesnotpossibleatall.Thisproblemismainlybecauseofdifferenceinmechanical,physical,chemical, and metallurgical properties of the materials being joined. Difference in melting point, thermal expansion coefficient, thermal conductivity, etc. may cause failure at the weldment even during welding. Welding constitutes an essential manufacturing process that enables the production of a wide range of products being used in automotive, shipbuilding, aerospace,andseveralotherindustrialsectors.However,weldingprocessesareextremelycomplexandmultidimensional intermsofmaterials,process,andworkmenskill,whichmakethefabricationofdesiredqualityjointextremelydifficult.
In summary, the review of response surface methodology in Friction Stir Welding to focusing on 60/40 brass plates has beensuccessfullyconducted.Thiswillprovideacomprehensiveinsightforthecurrentandalsoprovidethecurrentstate of research on response surface methodology in friction stir welding to 60/40 brass plates in order to fill the gaps with newresearchapproachesandideas.Furthermore,newstudiesonresponsesurfacemethodologyinFrictionStirWelding to60/40brassplateswithrespecttotheselectionofcost effectiveFSWtoolsandprocessoptimizationtoproducesound weldsstillneedstobedeveloped.
International Research Journal of Engineering and Technology (IRJET) e ISSN: 2395 0056
Volume: 09 Issue: 05 | May 2022 www.irjet.net p ISSN: 2395 0072
Fig.3.1FrictionStirProcessing(FSP)[42]
Table 3.3: Significant parameters of FSW technique and their levels for Brass
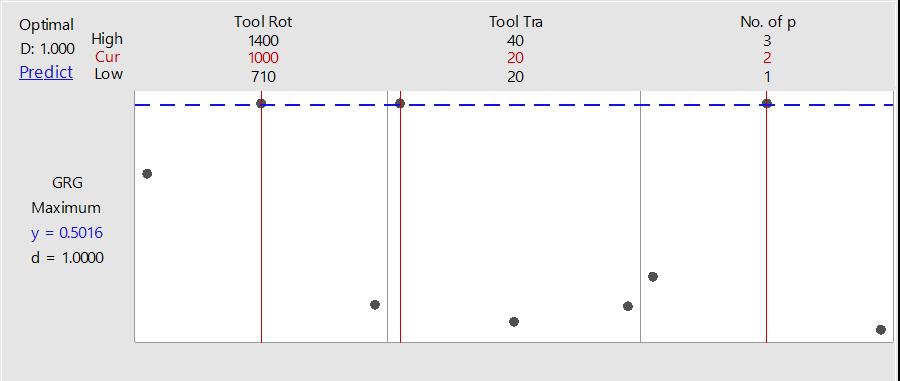
Level A B C ToolRotationSpeed(rpm) ToolTravelSpeed(mm/min) No.ofpasses 1 710 20 1 2 1000 28 2 3 1400 40 3
Table: 3.4 Proposed Design matrix and results of experimental runs Experiment No. A B C DError ToolRotationSpeed(rpm) ToolTravelSpeed(mm/min) No. of passes 1 710 20 1 2 710 28 2 3 710 40 3 4 1000 20 2 5 1000 28 3 6 1000 40 1 7 1400 20 3 8 1400 28 1 9 1400 40 2
International Research Journal of Engineering and Technology (IRJET) e ISSN: 2395 0056
Step 1
Thedataisfirsttobenormalizedbecauseofavoidingdifferentunitsandtoreducethevariability.Itisessentiallyrequired sincethevariationofonedatadiffersfromotherdata.Asuitablevalueisderivedfromtheoriginalvaluetomakethearray between0to1(NoorulHaqetal.,2008).Ingeneral,it isamethodofconvertingtheoriginaldatatoacomparabledata.If the response is to be minimized, then smaller the better characteristics is intended for normalization to scale it into an acceptablerangebythefollowingformula.
Equationisselectedanditcanbeexpressedas . max()min()()()min() YkYk YkYk Yk ii
ii i
Thefirststandardizedformulaissuitableforthebenefit typefactor. max()min() ()max()() xkxk xkxk xk ii
ii i
(2) The second standardized formulaissuitablefordefect typefactor. max()()()()() 0
i i
0 xkxk xkxk xk i
Thethirdstandardizedformulaissuitableforthemedium typefactor. Thegreyrelationdegreecanbecalculatedbystepsasfollows:
a) The absolute difference of the compared series and the referential series should be obtained by using the followingformula[15]: Andthemaximumandtheminimumdifferenceshouldbefound.
b) Thedistinguishingcoefficient p isbetween0and1.Generally,thedistinguishingcoefficient p issetto0.5.
c) Calculationoftherelationalcoefficientandrelationaldegreeby(12)asfollows. InGreyrelationalanalysis,Greyrelationalcoefficient canbeexpressedasfollows[15]: Andthentherelationaldegreefollowsas: In equation (13), is the Grey relational coefficient, w (k) is the proportion of the number k influence factor to the total influenceindicators.Thesumof w (k) is100%.Theresultobtainedwhenusing(12)canbeappliedtomeasurethequality ofthelistedsoftwareprojects.
Volume: 09 Issue: 05 | May 2022 www.irjet.net p ISSN: 2395 0072 © 2022, IRJET | Impact Factor value: 7.529 | ISO 9001:2008 Certified Journal |
(6)
International Research Journal of Engineering and Technology (IRJET) e ISSN: 2395 0056
Volume: 09 Issue: 05 | May 2022 www.irjet.net p ISSN: 2395 0072
Step 6
After optimal combinationof processparametersarefoundout, the nextstepisverytheimprovementof grey relational gradethroughconductingconfirmatoryexperiment.Thepredictedvalueofgreyrelational gradeforoptimal level canbe obtainedasfollows, 0 1 im i
Where m is the total mean grey relational grade, i is the mean grey relational grade at the optimal level of each parameter,andthenumberofthesignificantprocessparameters(Sahoo&Sahoo,2013).
The predicted optimumvaluesarelistedinTable 5.9. Thevalue of iscalculated0.4413fromabove equation.Tocheck thereliabilityofpredictedGRG,ConfidenceInterval(CI)isalsodeterminedusingEquation(7)(Çaydaş&Hasçalık,2008; Ju Long,1982).
5.1. Implementation of methodology to find multi response parametric optimization
Step 1
The experimental data have been normalized for Material removal rate (Gm. /Min), Total metal removed presented in Table 5.1 called grey relationalgenerations.Pre processing is important in GRA because the data sequences that will be compared have different ranges and units. Therefore, all data sequences must be standardized between the same lower andupperlimits.Theyaredefinedhereas 0and1.ForLargertheBetterCharacteristics(e.g.MRR), theinputquantityis normalized using equation (1). For Larger the Better characteristics (MRR), equation (2) is used. These equations are takenfrom[3].
Table 5.4 grey relational grade (GRG)
Experinat No. Hardness Normalization Deviation sequence Grey relation coefficient GRG RANK 1 79.8333 0.621 0.379 0.569 0.284 2 2 77.3333 0.448 0.552 0.475 0.238 3 3 72.5 0.115 0.885 0.361 0.180 8 4 85.3333 1.000 0.000 1.000 0.500 1 5 72.6667 0.126 0.874 0.364 0.182 7 6 75.6667 0.333 0.667 0.429 0.214 4 7 73.3333 0.172 0.828 0.377 0.188 6 8 70.8333 0.000 1.000 0.333 0.167 9 9 74.6667 0.264 0.736 0.405 0.202 5
MIN 70.833 2.06939E 05 0 MAX 85.33 1.000227633 1.000206939
Table5.4showstheevaluatedrelativecloseness(Ci)andRankofTOPSIS.Thebestcombinationofmachiningparameters in turning can be arranged as 1 2 3 5 6 4 8 7 9 through TOPSIS.Results of analysis of variance for the grey relational gradeareshownin
2022, IRJET | Impact Factor value: 7.529 | ISO 9001:2008 Certified Journal |
International Research Journal of Engineering and Technology (IRJET) e ISSN: 2395 0056
Step 4
ProcessParameter
Greyrelationgrade Rank
Level1 Level2 Level3 Max Min
Too Rotation Speed (rpm) 0.2342 0.2988 0.1858 0.1130 3
Tool Travel Speed (mm/min) 0.3242 0.1955 0.1990 0.1287 2
No. of passes 0.2218 0.3133 0.1836 0.1297 1
Meanvalueofgreyrelationgrade=114.05
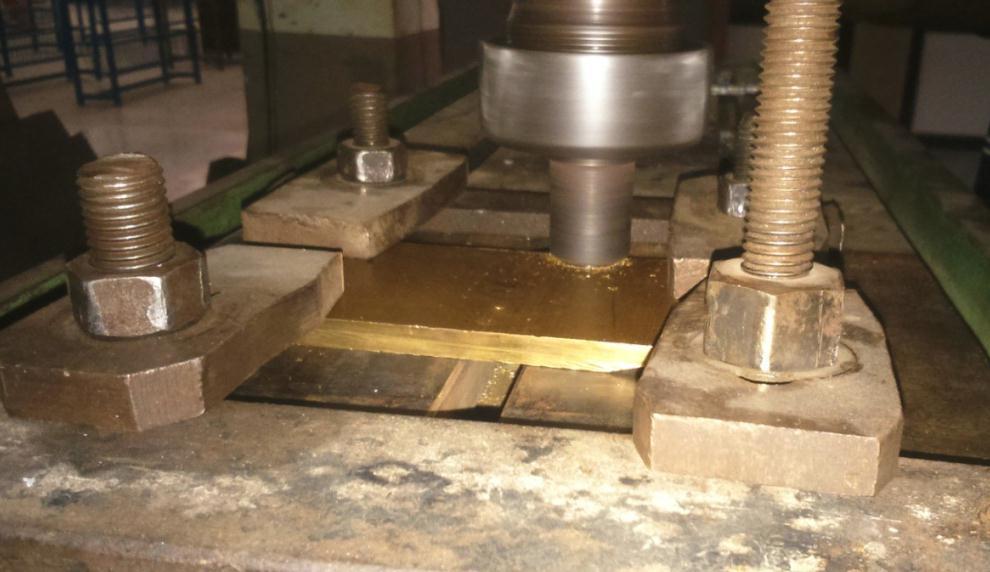
Average value of grey relational grade = 0.239In Table 5.6, the bold letter indicates the optimum value of the grey relationalgradeFromTable5.6,theidentifiedoptimalsettingofprocessparametersforattainingmaximumvaluesofthe hardnessisA2B1C2.
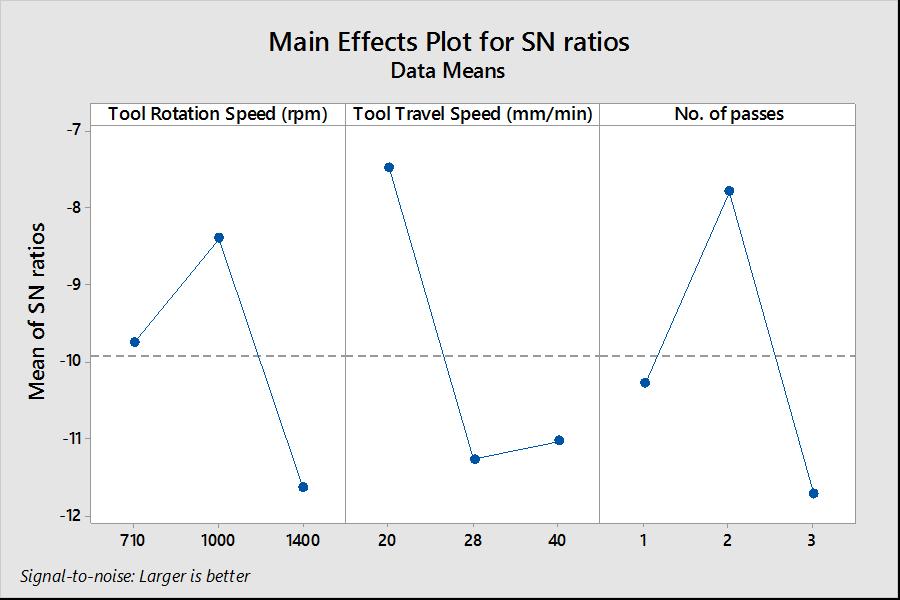
Fig.5.1MaineffectplotforSNratio
Fig.5.2Maineffectplotformeans
Volume: 09 Issue: 05 | May 2022 www.irjet.net p ISSN: 2395 0072 © 2022, IRJET | Impact Factor value: 7.529 | ISO 9001:2008 Certified Journal |
International Research Journal of Engineering and Technology (IRJET) e ISSN: 2395 0056
Volume: 09 Issue: 05 | May 2022 www.irjet.net p ISSN: 2395 0072
Table 3.3: Significant parameters of FSW technique and their levels for Brass
Level A B C
ToolRotationSpeed(rpm) ToolTravelSpeed(mm/min) No.ofpasses 1 710 20 1 2 1000 28 2 3 1400 40 3
Step 5
Next, analysis of variance (ANOVA) table is formulated considering grey relational grade value which has been shown in Table5.Thistablegivesthe significanceofprocessparametersonmulti responses. FromtheANOVAtable,itisrevealed thatfeedisthesignificantprocessparametersaffectingmultiresponsesasitsp valueislessthan0.05at95%confidence level.Cuttingspeed,depthofcutandfeedratearesignificanceonallthreeresponsessimultaneously.Itmaybenotedthat cuttingspeedmighthaveaneffectonsomeperformancecharacteristicsindividuallyanditseffectisprobablysignificant, whenallresponsesareconsideredtogetherasithasbeenobservedinpresentedresearch.
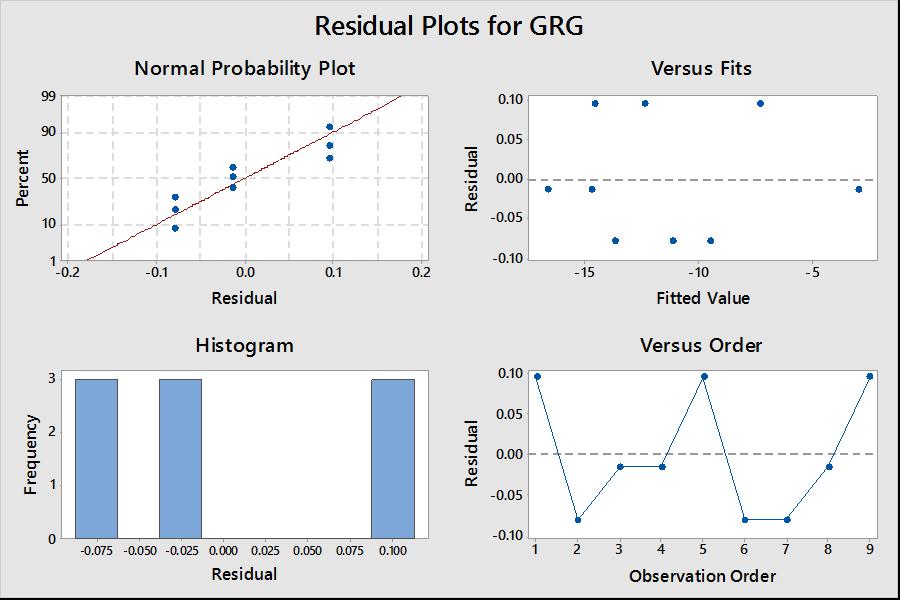
Table 5.8 Analysis of Variance
AnalysisofVarianceforTransformedResponse
Source DF SeqSS Contribution AdjSS AdjMS F Value P Value
ToolRotationSpeed(rpm) 2 36.682 25.00% 36.6819 18.3410 785.73 0.001 ToolTravelSpeed(mm/min) 2 54.689 37.27% 54.6887 27.3444 1171.43 0.001 No.ofpasses 2 55.324 37.70% 55.3242 27.6621 1185.04 0.001 Error 2 0.047 0.03% 0.0467 0.0233 Total 8 146.741 100.00%
International Research Journal of Engineering and Technology (IRJET) e ISSN: 2395 0056 Volume: 09 Issue: 05 | May 2022 www.irjet.net p ISSN: 2395 0072
ModelSummaryforTransformedResponse S R sq R sq(adj) PRESS R sq(pred) 0.152783 99.97% 99.87% 0.945379 99.36%
Confirmation test: Theobjectiveoftheconfirmationatoptimumlevelsistovalidatetheconclusionsdrawnduringtheanalysisphase.Once theoptimallevelofprocessparametersisselected,thenextstepistoverifythe improvementinresponsecharacteristics usingoptimumlevelofparameters.Confirmatorytestsfortheoptimallevelwereperformedtoverifytheenhancementin themachiningperformance.Theestimatedgreyrelationalgradecanbecalculatedas:Aconformitytestisconductedusing thefollowingequation: ed Aclearcomparisonbetween
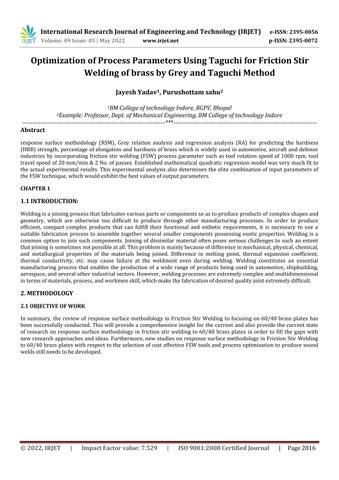
Experiments were conducted for various combinations of tool rotational speed and welding speed at three levels in Taguchi’sorthogonalarray.Thestrengthofthejointswasanalyzedbyhardnesstest.
International Research Journal of Engineering and Technology (IRJET) e ISSN: 2395 0056
Thefollowingobservationsweremadefromthestudies:
1.Taguchi'sorthogonalarrayhasbeensuccessfullyusedtodeterminetheoptimallevelofprocessparametersetting.
2. The optimum process parameter levels discovered to achieve greater hardness are as follows: Maximum hardness valuesareobtainedbyaveragingthemeasuredvaluesforToolRotationSpeed(rpm)A2 1000rpm(b)ToolTravelSpeed (mm/min),B120mm/min(c)No.ofpasses.
3.HardnessANOVAresultItisdiscoveredthatToolTravelSpeed(mm/min),(P=0.015)(66.94percent),andNo.ofPasses (P=0.015)(64.02percent)havethegreatestinfluenceonhardness,followedbyToolRotationSpeed(rpm)(A)(P=0.023) (42.13percent).Inthecurrentstudy,parametersplayasignificantroleinhardness.
4.Contourplotsarecreatedtoinvestigatetheinteractioneffectofweldingspeed.
5. Grey relational grade improves by 0.33 from the initial parameter combination (A1 B1 C1) to the optimal parameter combination(A2 B31C2).
[1] W.M. Thomas, E.D. Nicholas, J.C. Needham, M.G. Murch, P. Templesmith, C.J. Dawes, G.B. Patent Application No. 9125978.8(December1991).
[2]C.Dawes,W.Thomas,TWIBulletin6,November/December1995,p.124.
[3]C.HofmannDouglas,S.VecchioKenneth,Thermalhistoryanalysisoffrictionstirprocessedandsubmergedfrictionstir processedaluminium,Mate.Sci.Eng.(2007)165 175.
[4]R.S.Mishra,Z.Y.Ma,Frictionstirweldingandprocessing,Mater.Sci.Eng.:R:Rep.50(1 2)(2005)1 78.
[5] Gemme F, Verreman Y, Dubourg L, Jahazi M. Numerical analysis of the dwell phase in friction stir welding and comparisonwithexperimentaldata.MaterSciEngA2010;527:4152 60.
[6]MishraRS,MaZY.Frictionstirweldingandprocessing.MaterSciEngR:Rep2005;50:1 78.
[7]HeX.Numericalstudiesonfrictionstirweldingoflightweightmaterials.AdvMaterRes2013;743:118 22.
[8]R.S.Mishra,Z.Y.Ma,Frictionstirweldingandprocessing,Mater.Sci.Eng.:R:Rep.50(1 2)(2005)1 78.
Volume: 09 Issue: 05 | May 2022 www.irjet.net p ISSN: 2395 0072 © 2022, IRJET | Impact Factor value: 7.529 | ISO 9001:2008 Certified Journal