International Research Journal of Engineering and Technology (IRJET) e ISSN:2395 0056

Volume: 09 Issue: 05 | May 2022 www.irjet.net p ISSN:2395 0072
International Research Journal of Engineering and Technology (IRJET) e ISSN:2395 0056
Volume: 09 Issue: 05 | May 2022 www.irjet.net p ISSN:2395 0072
1
1College of Computer and Information Technology, China Three Gorges University, Yichang, Hubei, China ***
Abstract - Detectionandclassificationof braintumorsis an important task in the medical imaging and over time, there have procedural development and extensive research. The complexity of the brain as a diagnosable organ, the presenceof noise,poorcomparisonand depthheterogeneity within images, efficient features extraction, and the right type necessitates the development of efficient techniques for the detection and classification of brain tumor. We employed number of computerized algorithms for categorization and detection, including the k means clustering set of rules for pre processing brain tumor magnetic resonance images (MRI). Detection is accomplished the usage of marker controlled watershed transform and grey level co occurrence matrix (GCLM) is employed to extract features. To categorize, we employ the Support Vector Machine (SVM) and Artificial neural network (ANN). Implemented using various supervised mastering models, with the comparison between them proving more accurate results in less time, is being widely used
Key Words: BrainTumor;MRI;Gray LevelCo Occurrence Matrix;ANN;SVM;WatershedTransform
Tumor detection and classification is a method that has undergone continuous development and research throughout time, with its importance in cancer classification and therapy, and the identification of brain tumors presenting new challenges for organ complexity. Sincetumorsmustbeclassifiedbyseveralcriteriasuchas size, density and location, this increases the potential for errorsandtherisk ofpoor accuracy.Thiscomplicatesthe task even more as it is likely to generate noise in the magnetic resonance image and lacks specific limitations such as low, dementia and limitations. Consequently, a cost effectiveandefficientapproachisrequired.
Theformationofadditionalcellsinthebrainisknownasa braintumor.Inordertogrow,somecellsdivideandform additionaltissuethatisnotneeded.Thisiscalledatumor. Tumor cells multiply and eat away at the brain tissue. There are two kinds of brain tumors: benign and malignant. Benign tumors develop slowly, but malignant tumors grow extremely rapidly and spread to the brain, where they can press on the brain in the skull, killing healthy brain cells. To identify the location, form, and amount of brain tumor tissue, an MRI scan of the brain is necessary. To assess the kind, location, and volume of
braintumortissue,anMRIscanofthebrainwasrequired. MRIisasophisticatedtechnologyformedicalimagingthat generates high pixel images with very good quality of organs in the human body, and is used to select appropriate diagnoses at the right time for brain tumor diseasepatientsisimportanttoprocess[1].
The purpose of our effort was to build an automated process for the identification and classification of brain tumors that would be better to present methods. In contrast to the previously used K means clustering method for principal segmentation, we used the latest version K means clustering approach to substantially increase the pre processing of the MRI image [2] [3]. K means clustering and watershed segmentation are techniques that are widely used for cancer detection [4]. Furthermore, from a technical point of view, K means clusteringislesscomplex,andsegmentationcan be easily constructed by comparing desirable features to the brain architecture. Traditional k means had problems with sensitivity to outliers and noise, as well as poor scaling overtime;Theupdatedversionaddressedtheseandmany other concerns. Morphological techniques using marker andmaskprocessesareusedtoimproveimagestoreduce noise, blurring, and scan uniformity. Watershed segmentation with linked component labeling technology provides superior segmentation results, with perimeter, area, entropy, and singularity with value. All parameters characterizing tumor size and other features were extractedusingthecreatedmethod[5].
Pre processing compensates for the lack of over segmentation induced by the specified technology and considerably boosts the resilience of the procedure. We wish to refine and optimize the whole automated classificationanddetection process by extractingfeatures withtheaidofgray scaleco occurrencemetrics[6].
There are a variety of approaches and strategies for classifyingbraintumors.Weusedtwodifferenttechniques in our study: a support vector machine and an artificial neuralnetwork[7][8].Thesemethodshavebeenshownto bemoreaccurateandeffective.SVMstandsforSupervised Learning. It is a great tool for classifying and analyzing data. Even with large amounts of data, the SVM classifier learns quickly. SVM is used in the classification of two or more classes [9] [10]. Backpropagation network training involves supervised learning and is an excellent method for non linear transformations such as sigmoid transfer functions[11][12][13].
International Research Journal of Engineering and Technology (IRJET) e ISSN:2395 0056
Volume: 09 Issue: 05 | May 2022 www.irjet.net p ISSN:2395 0072
Inthispaper,analgorithmtodifferentiatebetweenbenign andmalignanttumorsispresented.Watershedalgorithms areusedtosegmentbraintumors.Forclassification,GLCM featuresareretrievedfromMRIofthetumorandsupport vector machines, and an artificial neural network is employed. The rest of the paper is arranged as follows. The methodology is described in Section II. The experiment is in Section III, while the conclusion is in SectionIV.
Toeliminatenoiseandundesireddistortioninthephotos, before putting them into segmentation, we examine the images at the lowest point in this stage and filter them according to the appropriatecriteria. Wecan either apply ameanfiltertotheimageorusecontrastenhancementto draw the boundaries of the image more clearly [14]. Our usualproposedmethodisoffered.K meansclusteringhas been researched and used for primary segmentation, and because it subsequently reduces the potential for noise andincreasesthedetectionprocesstoasignificantdegree [15]. Each picture is separated into K groups, which may be readily identified owing to their closeness to the architecture of the human brain. Clusters are formed by studying each image and employing all points to build a new mean. By specifying K clusters for all sample spaces, the entire data set is rearranged. Clusters occupy all the data points and cover the complete data space. The Euclidean distance of each data point is now computed from its mean. If the known distance is the shortest feasible distance or is already closest to its mean, we continue. This process continues until all the data points are in their nearest cluster and their transfer is less than thepreviouslydefinedcut offnumber.Theuseofk means to pre process the images greatly assists in overcoming theover segmentationissueofthewatershedapproach.
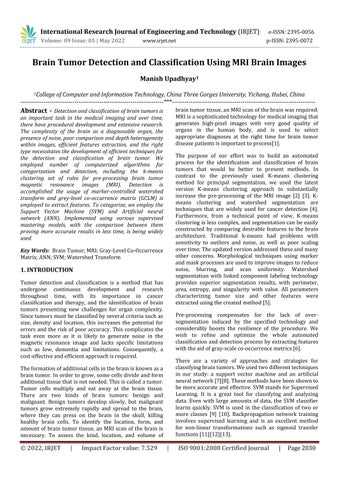
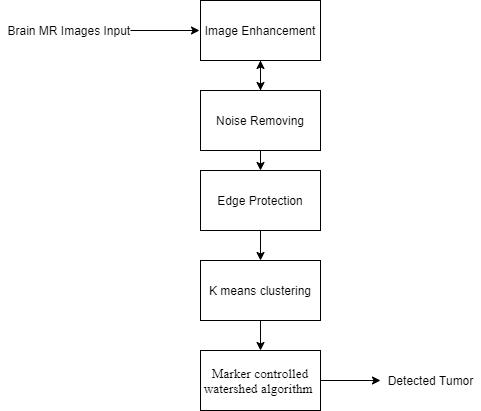
process is shown in Figure 1 from start to finish. Because the morphological formation is a structural form, as a reference for erosion, we construct a disc shaped structure. The picture is converted to grey, then opened morphologically after a variable separation. If the difference is less than the threshold, the limit function convertsasegmentedimagewithameaningfulchangetoa pixelvalueof0,and255ifthedifferenceislarge.Thenext step istheduplication reduction processthatoccurs after thisgraytransitiontoa complete binary image.When the image is reconstructed using an image mask, the foregroundandbackgroundobjectsappeartobedifferent. The black streaks and stem marks disappear when the bottles are opened one by one. To find the relevant previous tags, the distribution is now calculated by re sizingtheimageandcomputingtheregionalmaxima.After that, we overlay this pre image marker and clean the border and marking blocks, as well as any missing pixels, using repeated closures and erosions. We must first computetheEuclideanrangetransformofagrayorbinary picture. We needto splitit into watersheds. Furthermore, theSobelfunctiongavebetterresultsforedgerecognition anddiscriminationthantheCannyvariant,thusSobelwas selected.
Before identifying tumors, we must now perform morphological enhancements on the first segmented imageproducedbypre processingtheimages.Addingand removing pixels, as well as contrast changes known as dilationanderosion,arethemostbasicsteps.Byreplacing the markers in the foreground image, we use several rounds of masking and marking to identify. The whole
Tumor identification is a strategy that has gained a considerable lot of interest in the last several years, and the most optimal method is to use a marker controlled conventional watershed transformation. Denoising techniqueshaveevolvedovertimeandcanbeemployedin combination with conventional filters, offline filters, and nonlinear anisotropic separation. They are used in the Markov field approach [16], the wavelet based approach [17], and the analytical correction process. Water separation is a 92.76 percent better classified technique that gets its name from the natural process of collecting waterinreservoirsandtheintroductionofgrayimagesas geographicsites. When submergedin water,local minima are thought to resemble holes in which they raise the water level and bring it closer to the surface. Water is collected in vessels equal to the water flow of the earth's surfacebytheflowatthebottomofitsslopes.Adamisthe widest point or intersection of two bodies of water, and these dams or water lines divide the picture into several groups. This is a water separation procedure where the MRI is completed and the gray image images are filled with linear lines that distinguish between different dimensions as a boundary. Dehydration is a popular method because it can also dissociate noncancerous body tissues.
Toseparatetheimage,wefirst"mark"theobjectsinfront as described above, and then use a canal and a water line (the point where two bodies of water meet) to split the image.Let'stry(the boundarywheretwobodiesofwater meet) Let's see how it goes. Find and label the objects in thefront,suchasaplantin it,andcountthemarksonthe
International Research Journal of Engineering and Technology (IRJET) e ISSN:2395 0056
Volume: 09 Issue: 05 | May 2022 www.irjet.net p ISSN:2395 0072
back, which are part of the dark area that should be separated.Boundariesatboththefrontandbackmarkers are necessary to create water flow, so the transition process can begin now. In order to enlarge the tumor furtherandproduceacleardistinctionbetweentumorand brain,weperformwatershedsegmentationasecondtime. We can now view the tumor as the original black and whiteimagebecausethethresholdwas255forthetumor and 0 for the rest. We were able to identify the markers anddefinetheboundariesaccuratelybyreconstructionby repeated opening and closing, ensuring that there was no disaggregation. Superimposition was employed [19] to enhance contrast and ensure that borders were not highlightedwithclear tumorsvisibleagainstapitch black background.
The border method and regional approach are the two major techniques of segmentation. Watershed segmentation combines these two methods to provide a robust tool to quickly locate edges and areas. Watershed transformation is a segmentation method based on morphologicalgradient[20].
Featuresarethecharacteristicsofimagessothattheycan be retrieved to make a meaningful analysis using them. Theyattempttodescribeimagesinacollectionofspecific features called features that serve as inputs to classification systems. Watershed features are not adequate and additional may be required for a particular categorization. Much effort has been done in reviewing and comparing alternative MRI image extraction techniques, and we have landed on GLCM [21] for our approach. Using this, the following characteristics are retrieved, which are subsequently utilized for classification Correlation, Symmetry, Mean Entropy, RMS, Variance, Contrast, Kurtosis, Skewness IDM, Area, MajorAxis, MinorAxis, Eccentricity, Solidity, Equi diameter, circumference, Energy, SD, Energy, circularity, Smoothness,square,density[22][23].
These are just a few variables. Additional features may also be discovered. As the name indicates, the co occurrence matrix is used to quantify and analyze the distance and relative adaption between two pixels of different intensities. This cohesive matrix will be used to determinetheir 'd'distance andsizeifwehave pixel 'i'in theimagesampleatfullresolutionandanotherpixel 'j'at different intensities. We utilize the angles between the datafordirectedanalysis.Wehaveloweredtheamplitude and increased the number of gray levels since it is particularlysensitivetotheamplitudeofthesample.
International Research Journal of Engineering and Technology (IRJET) e ISSN:2395 0056 Volume: 09 Issue: 05 | May 2022 www.irjet.net p ISSN:2395 0072
known object. We will use the same strategy to locate a large number of neurons in the hidden layer of the same analysisgivenarestrictedamountofrepeats.
The excel sheet prepared during feature extraction is supplied as input to the neural network. Therefore, the input would be a 250*22 matrix where 250 are the numberofsamplesand22arethenumberoffeatures.Our target would be given as a 250*2 matrix where the representation will be combination of 0 and 1. For exampleBenignwillbe10;Malignantwillbe01.
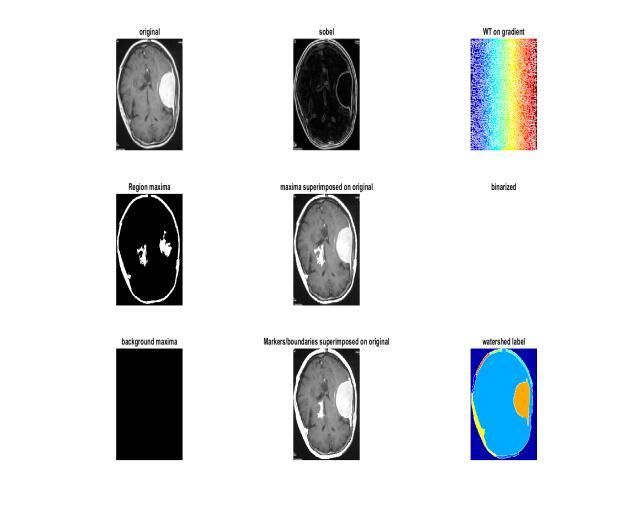
The training strategy modifies the weight and bias values according to Levenberg Marquardt optimization. It minimizes a mix of squared errors and weights and then picks the ideal combination to form a network that generalizes effectively. The process is dubbed Bayesian regularization.
Homogeneity a number that measures the closeness of thedispersionofitemsintheGLCMtotheGLCMdiagonal.
Compactness The smoother and rounder a tumor's surfaceis,themorebenignitis,andthemorecomplexthe tumor surface is, the more malignant it is. C may be used toanalyzethisfeature.andcanbedefinedas:
The training and testing data are broken in the ratio of 80:20
Validationstopsaredisabledbydefault(maxfail=inf)so that training may continue until an appropriate mix of mistakesandweightsisfound.”
Thenetworkarchitectureis:
P signifies the circumference of the lesion area, which is equal to the sum of the number of pixel points at the tumor's edge; A denotes the area of the wound region, whichisequaltothetotalofallpixelsatthewound'sedge; and A denotes the area of the wound region, which is equaltothetotalofallpixelsatthewound'sedge[22].
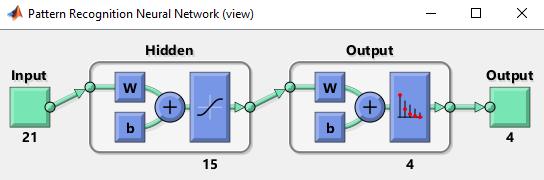
Separation is one of the mostpowerful areas for research and applications for artificial neural networks (ANNs). ThereisabranchofArtificialIntelligencecalledANN.The back distribution method was used to train the neural network[24]. A neural network is a mathematical model for processing information that is derived from human systems(suchasa brainornervecell)andallowsneutral networks to be taught and studied in the same way that the human brain is. During the training time, the weight will be adjusted and some formulas will be used for learning. Back extension network is one of the most popular neural networks. This mesh has been used in various applications. First, the classification of special things,whichseparatesjustonepieceofknowledgefroma
Theperformanceplotis:
International Research Journal of Engineering and Technology (IRJET) e ISSN:2395 0056
Volume: 09 Issue: 05 | May 2022 www.irjet.net p ISSN:2395 0072
SVM[25]isatechniqueofevaluatingdataanddiscovering patterns in computer science and statistics. It is a supervised learning approach that may be used for regression as well as classification. The aim of SVM is to construct hyperplane and group data. The actual data is converted to a high dimensional feature space using kernelfunctions,andthedecisionhyperplaneisgenerated. Magnetic resonance image analysis has previously made significant use of SVM [26]. Support vector machines provideexcellentresultsinbothlargeandsmalldatasets. However,astheamountofthedatasetrises,theSVMgets morecomplex.Atthesametime,thekernelfunctionsused.
We did the image enhancement using the MATLAB function imadjust. Removing noise from the image by applying the Normal Shrink Denoising algorithm. The binomial filter technique was then used to perform edge protection on the denoised output. There are different segmentationmethodsavailableinimageprocessingsuch asedge based,threshold basedandclustering based.With asetnumberofrepetitionsandkvalues,weconstructeda k means clustering method. The output picture generated after using the k means clustering method for tumor identification is subjected to the marker controlled watershedtechnique.
Unlike depth reading, machine learning does not employ the initial picture in the classification process, instead extracting characteristics from the training set. The classifier then uses the collected features to train and classifythetestset.
We developMATLABGUIforclassification.The technique for the classification experiment is as follows: to begin with, over 250 magnetic resonance images classified as malignantorbenignweredividedintotwogroups:testing and training. Second, distinct characteristics were retrieved from each image depending on the manually created tumor shape, which we detected using the detection method in the previous section, and modified theROIto128x128sizetoextractdifferentfeaturesitwas done. The normalization applies to all extracted features. The SVM classifier and the ANN are trained using the featurevectorsandsampletagscorrespondingtoallofthe pictures generated from the training set. Finally, by reading the feature vectors of the test set samples, computing the related prediction tag results, and comparing it to the actual test sample tags, the trained classifierassessestheclassificationaccuracy. 1
Here, iY is the thi sample's input vector, id is the thi sample's intended output, and N is the sample size. The database included more than 250 samples, with 80% to trainthemodeland20%samplesbeingusedfortesting.
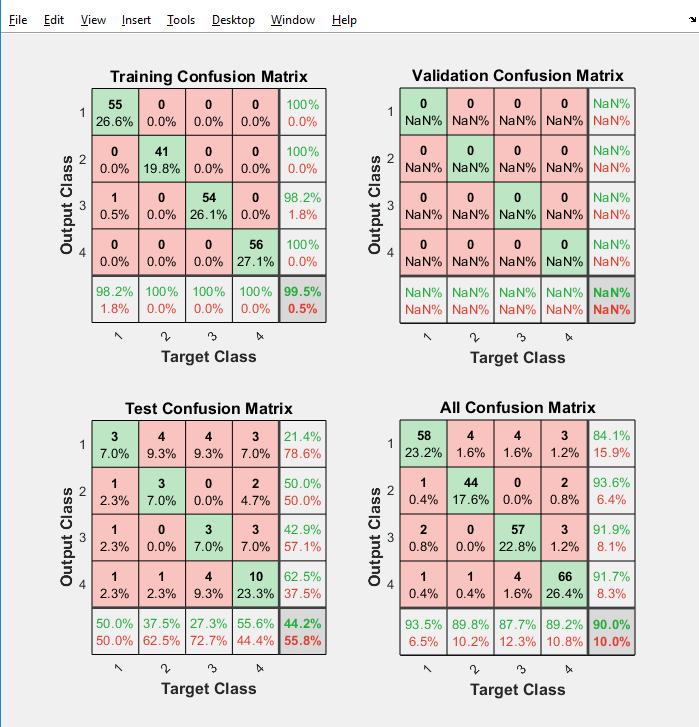
When diagnosing a brain tumor for specific cancers, this regionisreferredtoasanFN(falsenegative)ifthesystem identifies the tumor as benign. If the algorithm classifies the tumor as malignant then the area is called TP (True Positive). When a benign tumor is mistaken as malignant by the diagnostic system, it is termed FP (false positive). When the algorithm diagnoses a tumor as benign, it is referred to as a TN (true negative) [5]. We calculate accuracyonthis. 100%
The ROC curve of the subject'soperational characteristics was developed to more thoroughly assess the system's performance. The ROC curve is constructed by adding these coordinate points, with TPR (true positive rate) as thecoordinate(y axis)andFPR(falsepositiverate)asthe abscissa.
TheaccuracyofbothANNandSVMcomeclosetoeach within the range of 95 to 99 percentage. As a result, this detection and classification technique based on several features may be deemed acceptable for use in the detectionandclassificationofbraintumors.
International Research Journal of Engineering and Technology (IRJET) e ISSN:2395 0056 Volume: 09 Issue: 05 | May 2022 www.irjet.net p ISSN:2395 0072
Table 1: Accuracy
Method Accuracy
SupportvectorMachine(SVM) 95.86% ArtificialNeuralNetwork(ANN) 97.15%
Table -2:SVMAlgorithmclassificationeffect
Falsenegative 01 Falsepositive 00 Truenegative 10 Truepositive 49 Sensitivity(%) 98% Specificity(%) 100% Accuracy(%) 95.86%
This article proposes a technique to detect and classify malignant and benign brain tumors based on various characteristics. The tumor part was sectioned using a marker controlled watershed algorithm. The tumor portionofthebrainMRIis usedtoextractGLCMfeatures, which are then input into a feed support vector machine and ANN for classification. With the provided database, the two tumor types benign and malignant were effectively classified using the suggested method with a classificationaccuracyofover95%.Thesuggestedmethod can be used to classify additional tumor types such as medulloblastoma, lymphoma, and astrocytoma, and the accuracyofthesystemcanbeincreasedifalargedatabase of these tumor types is provided. The purpose of this technologyistogivedoctorsmorediagnosticinformation.
[1]N.VarunaShreeandT.N.R.Kumar,“Identificationand classification of brain tumor MRI images with feature extraction using DWT and probabilistic neuralnetwork,” BrainInformatics,vol.5,no.1,pp. 23 30,2018,doi:10.1007/s40708 017 0075 5.
[2] J.H.Kim,S.Lee,G.S.Lee,Y.S.Park,andY.P.Hong, “Using a Method Based on a Modified K Means ClusteringandMeanShiftSegmentationtoReduce File Sizes and Detect Brain Tumors from Magnetic Resonance (MRI) Images,” Wirel. Pers. Commun., vol. 89, no. 3, pp. 993 1008, 2016, doi: 10.1007/s11277 016 3420 8.
[3] R. Nevatia, “Image Understanding Systems.,” Proc. IEEE Conf. Decis. Control, p. 591, 1984, doi: 10.1109/cdc.1984.272070.
[4] M. A. Almahfud, R. Setyawan, C. A. Sari, D. R. I. M. Setiadi, and E. H. Rachmawanto, “An effective MRI brain image segmentation using joint clustering (K means and fuzzy C means),” 2018 Int. Semin. Res.Inf.Technol.Intell.Syst.ISRITI2018, pp. 11 16, 2018,doi:10.1109/ISRITI.2018.8864326.
[5] P.Dhage,M.R.Phegade,andS.K.Shah,“Watershed segmentation brain tumor detection,” 2015 Int. Conf. Pervasive Comput. Adv. Commun. Technol. Appl. Soc. ICPC 2015, vol. 00, no. c, 2015, doi: 10.1109/PERVASIVE.2015.7086967.
[6] L. Van Gool, P. Dewaele, and A. Oosterlinck, “Texture analysis anno 1983.,” Comput. Vision, Graph. Image Process., vol. 29, no. 3, pp. 336 357, 1985,doi:10.1016/0734 189X(85)90130 6.
[7] V. J. Frp, “% RXQGDU \ ’ HWHFWLRQ,” vol. 6, pp. 713 718,2019.
[8] A.E.Babu,A.Subhash,S.DeepaRajan,F.Jacob,and P. A. Kumar, “A Survey on Methods for Brain Tumor Detection,” Proc. IEEE Conf. Emerg. Devices Smart Syst. ICEDSS 2018, no. March, pp. 213 216, 2018,doi:10.1109/ICEDSS.2018.8544353.
[9] M.C.Tu,D.Shin,andD.Shin,“Acomparativestudy of medical data classification methods based on decisiontreeandbaggingalgorithms,” 8thIEEEInt. Symp. Dependable, Auton. Secur. Comput. DASC 2009, pp. 183 187, 2009, doi: 10.1109/DASC.2009.40.
[10] ParveenandA.Singh,“Detectionofbraintumorin MRI images, using combination of fuzzy c means and SVM,” 2nd Int. Conf. Signal Process. Integr. Networks, SPIN 2015, pp. 98 102, 2015, doi: 10.1109/SPIN.2015.7095308.
[11] H. E. M. Abdalla and M. Y. Esmail, “Brain Tumor DetectionbyusingArtificialNeuralNetwork,” 2018 Int. Conf. Comput. Control. Electr. Electron. Eng. ICCCEEE 2018, pp. 1 6, 2018, doi: 10.1109/ICCCEEE.2018.8515763.
[12] Virupakshappa and B. Amarapur, “An Automated Approach for Brain Tumor Identification using ANN Classifier,” Int. Conf. Curr. Trends Comput. Electr. Electron. Commun. CTCEEC 2017, pp. 1011 1016,2018,doi:10.1109/CTCEEC.2017.8455154.
[13] I. Journal et al., “International journal of engineering sciences & research technology brain tumor detection in mri using morphological
© 2022, IRJET | Impact Factor value: 7.529 | ISO 9001:2008 Certified Journal | Page2035
International Research Journal of Engineering and Technology (IRJET) e ISSN:2395 0056
operations based image segmentation,” vol. 5, no. 4,pp.280 285,2016.
[14] E. Arias Castro and D. L. Donoho, “Does median filtering truly preserve edges better than linear filtering?,” Ann.Stat.,vol.37,no.3,pp.1172 1206, 2009,doi:10.1214/08 AOS604.
[15] P. Wang and H. L. Wang, “A modified FCM algorithm for MRI brain image segmentation,” Proc. 2008Int.Semin.Futur.Biomed.Inf.Eng.FBIE 2008, no. 3, pp. 26 29, 2008, doi: 10.1109/FBIE.2008.12.
[16] T. K. Mudgal, A. Gupta, S. Jain, and K. Gusain, “Automated system for Brain tumour detection and classification using eXtreme Gradient Boosted decision trees,” 2017Int.Conf.SoftComput.its Eng. Appl. Harnessing Soft Comput. Tech. Smart Better World, icSoftComp 2017, vol. 2018 Janua, pp. 1 6, 2018,doi:10.1109/ICSOFTCOMP.2017.8280091.
[17] S. S. and C. R., “An Efficient MRI Noise Removal TechniqueusingLinearandNonlinearFilters,” Int. J. Comput. Appl., vol. 179, no. 15, pp. 17 20, 2018, doi:10.5120/ijca2018915777.
[18] N. Baraiya and H. Modi, “Comparative study of different methods for brain tumor extraction from MRI images using image processing,” Indian J. Sci. Technol., vol. 9, no. 4, pp. 1 5, 2016, doi: 10.17485/ijst/2016/v9i4/85624.
[19] M. Padlia and J. Sharma, “Brain tumor segmentation from MRI using fractional sobel mask and watershed transform,” IEEE Int. Conf. Information, Commun. Instrum. Control. ICICIC 2017, vol. 2018 Janua, pp. 1 6, 2018, doi: 10.1109/ICOMICON.2017.8279121.
[20] T. A. Jemimma and Y. Jacob Vetharaj, “Watershed algorithm based DAPP features for brain tumor segmentation and classification,” Proc. Int. Conf. Smart Syst. Inven. Technol. ICSSIT 2018, no. Icssit, pp. 155 158, 2018, doi: 10.1109/ICSSIT.2018.8748436.
[21] A. Sarkar, M. Maniruzzaman, M. S. Ahsan, M. Ahmad, M. I. Kadir, and S. M. Taohidul Islam, “Identification and classification of brain tumor from MRI with feature extraction by support vector machine,” 2020 Int. Conf. Emerg. Technol. INCET 2020, vol. 2, pp. 9 12, 2020, doi: 10.1109/INCET49848.2020.9154157.
[22] M. Wei, Y. Du, X. Wu, and J. Zhu, “Automatic Classification of Benign and Malignant Breast Tumors in Ultrasound Image with Texture and
Volume: 09 Issue: 05 | May 2022 www.irjet.net p ISSN:2395 0072 © 2022, IRJET | Impact Factor value: 7.529 | ISO 9001:2008 Certified Journal | Page2036
Morphological Features,” Proc. Int. Conf. Anti Counterfeiting, Secur. Identification, ASID, vol. 2019 Octob, pp. 126 130, 2019, doi: 10.1109/ICASID.2019.8925194.
[23] Y. K. Dubey, M. M. Mushrif, and K. Pisar, “Brain tumor type detection using texture features in MR images,” IEEE Reg. 10 Humanit. Technol. Conf. R10 HTC, vol. 2018 Decem, no. c, pp. 1 4, 2019, doi: 10.1109/R10 HTC.2018.8629800.
[24] A. Bharathi and E. Deepankumar, “Natural object classificationusingartificialneuralnetwork,” Int.J. Appl. Eng. Res., vol. 10, no. 20, pp. 16359 16363, 2015.
[25] C. C. Chang and C. J. Lin, “LIBSVM: A Library for support vector machines,” ACM Trans. Intell. Syst. Technol., vol. 2, no. 3, pp. 1 39, 2011, doi: 10.1145/1961189.1961199.
[26] A. Hussain and A. Khunteta, “Semantic Segmentation of Brain Tumor from MRI Images andSVMClassificationusingGLCMFeatures,” Proc. 2ndInt.Conf.Inven.Res.Comput.Appl.ICIRCA2020, pp. 38 43, 2020, doi: 10.1109/ICIRCA48905.2020.9183385.
[27] E. Hassan and A. Aboshgifa, “Detecting Brain Tumour from Mri Image Using Matlab GUI Programme,” Int. J. Comput. Sci. Eng. Surv., vol. 6, no. 6, pp. 47 60, 2015, doi: 10.5121/ijcses.2015.6604.