International Research Journal of Engineering and Technology (IRJET)

Volume: 09 Issue: 04 | May 2022 www.irjet.net
e ISSN: 2395 0056
p ISSN: 2395 0072
International Research Journal of Engineering and Technology (IRJET)
Volume: 09 Issue: 04 | May 2022 www.irjet.net
e ISSN: 2395 0056
p ISSN: 2395 0072
1, 2, 3Student, Dept of Electronics Engineering, Vidyalankar Institute of Technology, Mumbai, Maharashtra
4Professor, Dept of Electronics Engineering, Vidyalankar Institute of Technology, Mumbai, Maharashtra
***
Abstract - This paper aims at generating turbidity values by analyzing samples through the camera viewpoint of one’s smartphone. At present, India is water stressed and reported to have ‘critical’ or ‘overexploited’ groundwater level. The machine learning model is programmed to identify a set of weights and biases that, on average, result in low loss across all samples. In the end the app is based on this model using which users can just point their phone’s camera towards the water sample and get results about the turbidity of their sample. With this system we hope to solve the problem of consumption of unsafe water to an extent.
Key Words: Machine learning, Turbidity, Android App, CNN (Convolutional Neural Network), TensorFlow
Accesstocleandrinkingwaterisamatterofconcernto this day. There have been several recorded incidents of failure in purification plants as well as accidents while supplying through pipes. Turbidity of water has a close relation to potability of water, higher turbidity levels of a given sample of water translates to poor potability and viceversa. Turbiditycan be usedto evaluate the lookand acceptability of drinking water provided to customers, as wellasthesuccessofhouseholdwatertreatmentandsafe storage. We want to provide the consumers with an easy to useappwhichletsthemmeasuretheturbidityofwater athome.Thisprojectcouldbeusedbyanyindividualwho hasaccesstoasmartphone.Checkingtheturbiditylevelof watersuppliedtotheirhomewouldbeaseasyastakinga picture of the water through our smartphone app. To facilitate this easy to use application, we are using machine learning as access to turbidity sensors would neither be convenient nor cost effective for our targeted demographic.
Table 1: Reviewingturbiditytargets(Source:WHO)
Summary of Turbidity targets (Source: WHO)
Location Turbiditytargets Notes
Householdwater treatment and storage
Needstobe<5 For turbidities >1 NTU, it takes better purification to
value:
makeitpotable.
Aesthetic aspects Needs to be < 1 NTU “Crystal clear" water has a turbidity of <1 NTU; at 4 NTU andabove,water becomes visibly cloudy.
To understand the relation between turbidity and potability of water, WHO guidelines for purifying plants were used to set goals for this project. Targeting low turbiditylevelsoftentranslatestosafedrinkingwaterand removal of pathogens. Several incidents of increased turbidityhavebeencorrelatedtothespreadofdiseases.In afewstudiesreportsoftherelationshipbetweenturbidity and diseases have surfaced while some studies deny the correlation. Thus, although correlations may exist in individualdrinking watersupplies,auniformrelationship has not been set up. Hence, turbidity should not be the only parameter the water should be judged in, it instead shouldbeusedasaneasysigntodetectproblemsinwater purification, storage, or supply. Turbidity sensors based on ISO 7027 standards are readily available which are quite accurate and accessible for us to create datasets using it. The technique used to figure out turbidity involves measurement of incident light scattered at right angles from the sample. The LDR (photodiode) generates an electronic signal based on the amount of scattering light goes through, the signal is then mapped to correspondingturbidityvalue.
Collect water samples (pictures) and label them using the value (in NTU) given out by the turbidity sensor. Create a datasetusingthepicturesandlabels.Splitthedatasetinto train and test sets. Use the train dataset to train a model usingasupervisedlearningalgorithm.Usethetestdataset todeterminetheaccuracyofthemodel.Deploythemodel (.tflitefile)toanAndroidapp
Utkarsh Gupta, Omkar Kulkarni, Siddharth Abhyankar, Akshatha Bhat
International Research Journal of Engineering and Technology (IRJET)
Volume: 09 Issue: 04 | May 2022 www.irjet.net
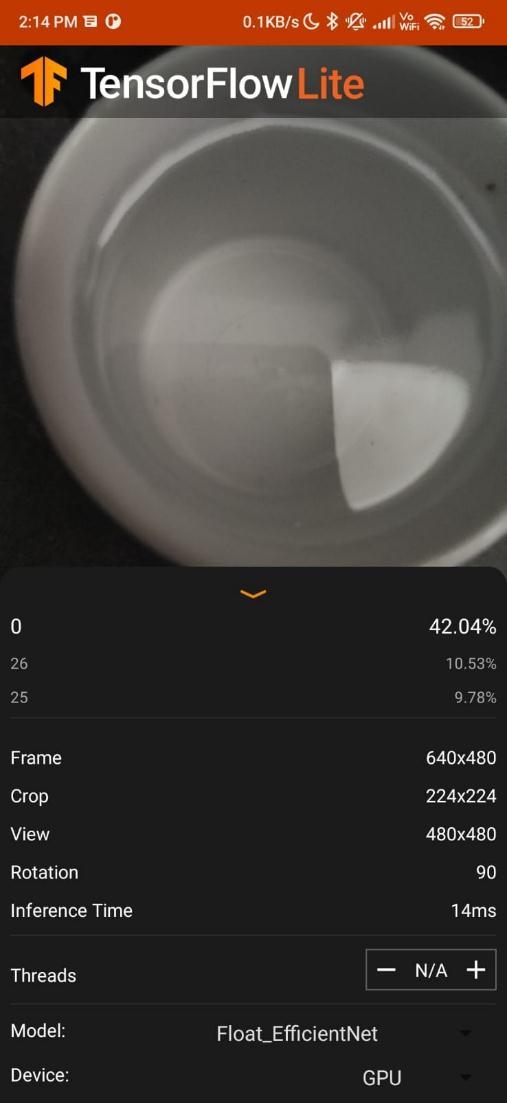
The following methodology describes how to get camera output,thismobileapplicationgetsthecamerainputusing the functions defined in the file CameraActivity.java. This file depends on AndroidManifest.xml to line the camera orientation.‘CameraActivity’alsocontainscodetocapture user preferences from the UI and make them available to otherclassesviaconveniencemethods.
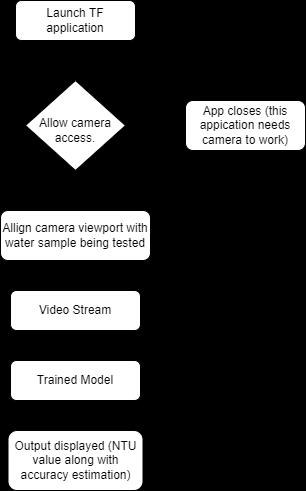
Chart -1:Flowchartfortestingwatersample
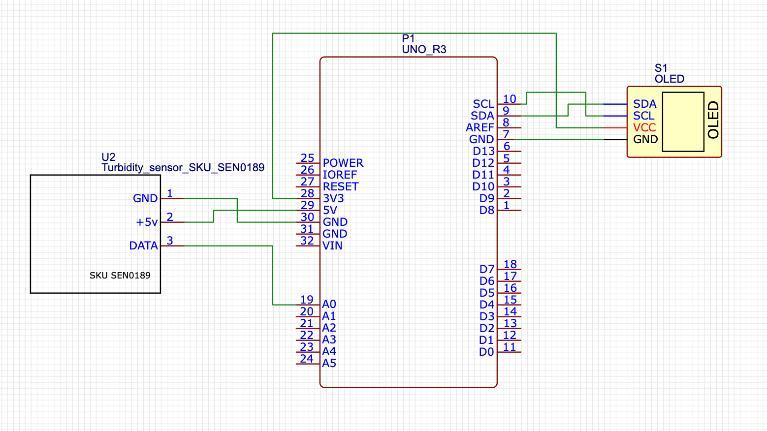
Theprojecthas3mainhardwarecomponentsviz:Arduino Uno,Turbiditysensor&anOLEDscreen.
Arduino Uno: The Arduino Uno may be a microcontroller boardsupportingtheATmega328microcontroller.Ithasa 16MHzresonator,aUSBconnection, aninfluencejack,an in circuit system programming (ICSP) header, and a push button. It has 20 digital input/output pins, a reset button andmanymore.Itcomeswitheverythingwewantoutofa microcontroller; it is as simple as plugging it into a computer with a USB cable, it can also be powered using an AC to DC adapter/battery. But it has an ATmega16U2 programmedasaUSB toserialconverter.
e ISSN: 2395 0056
p ISSN: 2395 0072
Turbidity Sensor: This is a Turbidity Sensor with Module, this module electronically monitors and is designed to work with the Arduino, Raspberry Pi, PIC, ARM, and AVR microcontroller platforms The Arduino TurbiditySensorishighlyefficient;itcandetectandverify thequalityofwaterbytakingturbiditymeasurementsand comparing the findings to digital or analogue signals connected to the respective pins in the accompanying electrical module. The Turbidity Sensor shinesan infrared light that is not visible to human vision and capable of detecting particles which are suspended in water, measuring the light transmittance and dispersion rate using an LDR, this changes in response to the amount of TSS (Total Suspended Solids), increasing the turbidity of the liquid as turbidity levels rise. In general, this turbidity Sensor is used in projects that monitor water turbidity in rivers, streams, lakes, and many other bodies of water, as well as research sites, laboratories, and water storage tanks. It has an end that is carefully designed for direct touch, as well as an electronic module that amplifies and sendsthedatareceivedtothemicrocontroller.Itsworking premise is based on the idea that when light passes throughasampleofwater,theamountoflighttransmitted throughthesampleisproportionaltotheamountofsoilin thewater.Theintensityofinfraredlightdiminishesas the amountofsuspendedsoilparticlesinthesampleincreases.
OLED screen: At the heart of this module is a powerful single chipCMOSOLEDdrivercontroller SSD1306.Itcan communicate with the microcontroller in multiple ways includingI2CandSPI(SerialPeripheralInterface).Thanks to the SSD1306 controller’s versatility, the module comes in varied sizes and colors: for example, 128x64, 128×32, with white OLEDs, Blue OLEDs, and Dual Color OLEDs. OLED displays use organic particles which emit light on passingcurrentthroughthemandthereforedonotrequire a backlight for their operation. Therefore, the display has suchsharpcontrast,extremelywideviewingangleandcan display deep black levels. Absence of backlight significantly reduces the power needed to run the OLED. This OLED module consumes 20mA current (varies dependingontheareaofdisplaybeinglitandthecolorthat isbeingdisplayed).SSD1306worksinthevoltagerangeof 1.65V and 3.3V, though the panel itself requires a supply voltage of 7V to 15V. All these different power requirements are sufficed using internal charge pump circuits. This allows it to be simply connected to an Arduinoorany other5Vlogicmicrocontrollerwithout the needforalogiclevelconverter.
International Research Journal of Engineering and Technology (IRJET)
Volume: 09 Issue: 04 | May 2022 www.irjet.net
Fig 1:CircuitDiagram
This project has three main software components viz: TensorFlow,AndroidStudio&ArduinoIDE.
TensorFlow is an open source end to end platform that is madeandmaintainedbyGoogleformachine learning, the reasonwechoseitisbecauseithasalotoftools,libraries, and community resources as well that makes it easy to buildanddeploymachinelearningpowerapplications.We need to convert the model to a tflite file, and we use the inbuilt converter in TensorFlow to do that. Then we can deploy the model to a cloud based service. TensorFlow enables distributed strategy which allows us to run the model over multiple GPUs, this can drastically increase computational efficiency but is not a mandatory requirement.
Librariesused:
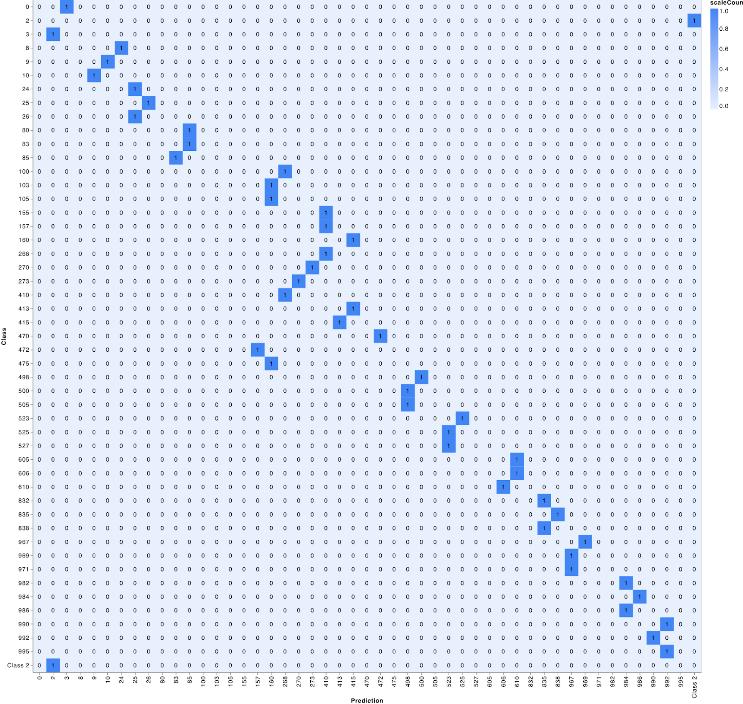
NumPy has been used to save images as a NumPy array. OpenCVhasbeenusedtoread,resizeimages. TensorFlow isbeingusedtocreateandtrainthemodel,aswellasrun predictions on it. Sklearn and matplotlib help in plotting theconfusionmatrixoncepredictionshavebeenmade.
ML(MachineLearning)Model:
Ittakes100x100imagesasinput.
Ithas2layerseachhaving128neurons. Outputcanbebetween0and1000(NTU).
Rectified Linear Unit is used as Activation Function (ReLU).
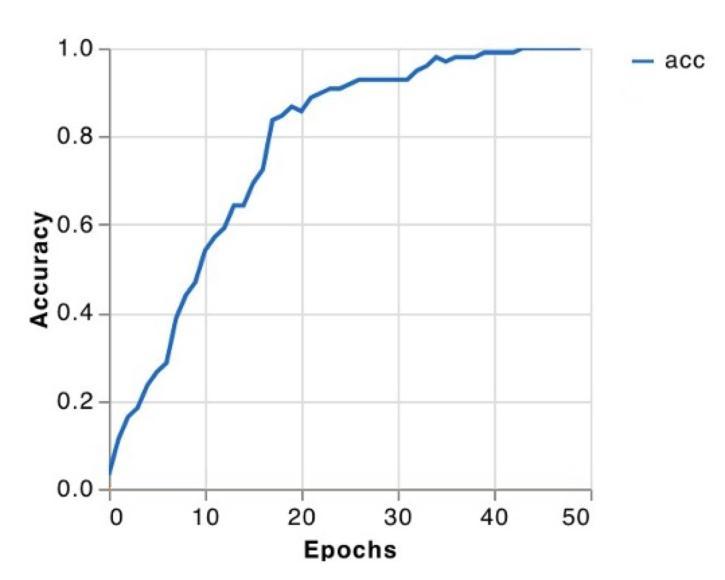
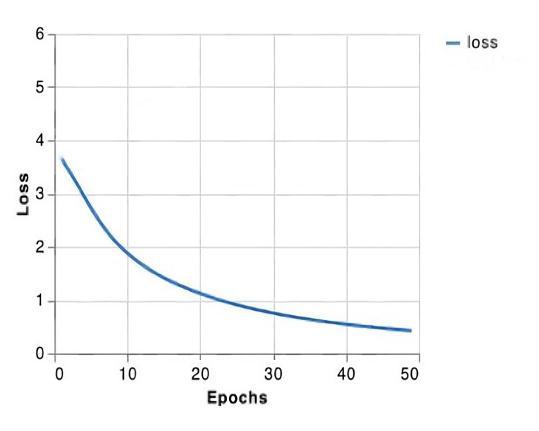
Model is fitted over 50 epochs with batch size of 16 and learningrateof0.001
In Arduino we have one analog pin which has 10 bit resolution.analogRead()isaninbuiltfunctionprovidedby
e ISSN: 2395 0056
p ISSN: 2395 0072
Arduino IDE. Max voltage output provided by Arduino is 5V.
ADCresolution=10bits =210 =1024
analogRead()Range=0to1023
Maxvoltage=5V
AnalogReadtoVolts=(analogRead*5)/1023 =’x’V
NTUtoVoltagerelation:
TurbidityRange=0to1000NTU
At0Vturbidity=0NTU
At5Vturbidity=1000NTU
When the sensor is completely blocked, we receive 0V whichis1000NTU.
International
Volume:
e ISSN: 2395 0056
p ISSN: 2395 0072
This project is a working prototype of turbidity detection using an android app. This application will help people find turbidity of their water samples in white/porcelain containers. Most of the goals set at the beginning have beenmet.Prospectsincludedetectingturbidityofsamples indifferent containerslike glass,steel, etc.Alsodeploying the model to different platforms like iOS, iPadOS, etc. would increase the reach and accessibility of our app. Futurerevisionscouldalsoincorporateanonlinedatabase tosavetheturbidityofwatermeasuredingeolocations.
This would help users as well as us to compare the data theyhavecollectedtothedataintheirlocality.Thiswould helpkeeptheaccuracyofthemodel incheck.Athreshold could be set for the turbidity and once it crosses a dangerous threshold for ‘n’ number of users, the local authoritiescouldbealertedaccordingly.
In successfully completing our project, we are indeed thankfultomanypeoplewhohaveencouragedandhelped us in a variety of ways. It is a privilege to express our gratitudetothepeopleinvolved.Ourprofoundandsincere thanks to Prof. Akshatha Bhat who consented to be our project guide. We have scarce words to express our courtesy towards her for their keen interest, valuable guidance, important judgment, and constant encouragement during the entire course of our study. Words in our lexicon fall short to express the feelings towards the Professor of the Electronics Department, Dr. Sangeeta Joshi for her timely and important help in completing this project report. Finally, we are sincerely thankful to Vidyalankar Institute of Technology who have supportedourproject.
[1] The World Health Organization (WHO) published a report in 2017. Review of turbidity in water quality and health: information for regulators and water suppliers WHO stands for the World Health Organization. https://apps.who.int/iris/handle/10665/254631. IGO's licenceisCCBY NC SA3.0.
[2]MartinAllen,RonaldBrecher,RayCopes,SteveHrudey, and Pierre Payment (2008). Drinking water turbidity and microbiologicalrisk
https://www.researchgate.net/publication/228605563_T urbidity_and_microbial_risk_in_drinking_water
[3]AJDeRoos,PLGurian,LFRobinson,ARai,IZakeri,MC Kondo Drinking Water Turbidity with Acute Gastrointestinal Illness: A Review of Epidemiological Studies Environmental Health Perspectives
International Research Journal of Engineering and Technology (IRJET) e ISSN: 2395 0056
Volume: 09 Issue: 04 | May 2022 www.irjet.net p ISSN: 2395 0072
125(8):086003; doi: 10.1289/EHP1090. Published online August17,2017.PMCID:PMC5882241;PMID:28886603.
[4]"Waterquality Determinationofturbidity Part2: Semiquantitative methods for assessing water transparency," according to ISO 7207. January of the next year
[5]https://docs.arduino.cc/hardware/uno rev3
[6] https://tensorflow.org/guide
[7] Prediction of water turbidity in a marine environment using machine learning: A case study of Hong Kong, LalitKumar,MohammadSaudAfzal,AshadAhmad
[8] ssd1306documentationrelease1.5.0 RichardHull
[9] Scikit learn:MachineLearninginPython,Pedregosa et al.,JMLR12,pp.2825 2830,2011.
[10] TensorFlow: Large Scale Machine Learning on HeterogeneousDistributedSystems
[11] A Comprehensive Guide to Convolutional Neural Networks the ELI5 way | by Sumit Saha | Towards DataScience
IRJET | Impact Factor value: 7.529 | ISO 9001:2008