Overview of Movie Recommendation System using Machine learning by R programming Concepts
Mallareddy Sai Prakash1 , Harwant Singh Arri2
1Student, Department of

Professor, Department
Science
Abstract - Now a days, in our daily lives, the usage of internet, along with that usage of the several apps is also increased. In that apps, several software’s are developed to keep the user engaged every time. In those software’s, Recommendation System is one of the main software. This system is used in apps like food, delivery, shopping, over the top (ott) platforms and so on to keep the user endorse to them. This paper represents the overview of Recommendation system using Collaborative filtering approach. This paper elaborates the technique and key conceptsinvolvedinthisapproach.
Keywords Recommendation system, IBCF, Collaborative filtering, Recommenderlab, K-means clustering,Normalization
I. Introduction
Recommendation system is a system which furnishes its users with numerous contents formed on their tastes, preferencesandattachments.Machinelearningalgorithms willbeusedtoimplementthisrecommendationsystem.
Recommendation system dispenses recommendations toitsusersbyafilteringprocesswhichwasbasedonuser likingsandhistorywhichtheyrecentlygonethroughorby searching This data about the user will be considered as aninput.Thisdatawhichcollectedreflectsthepriorusage of the application or product as well as the assigned reviewsorratingsexpressedwiththeusers.
Another consideration with the recommendation systemisitfindsasimilarconnectionbetweenthevarious products. Let’s consider example like Prime, Aha, Netflix, andZee5platformsprovidesoneuserwiththesuggestions of the movies that are similar to the other users that they havewatchedpreviouslyoronesearched.
Recommendation system are there of two types which are Content based recommendation system and Collaborativefilteringrecommendationsystem.
Engineering, Lovely Professional University, India.
Engineering, Lovely Professional University, India
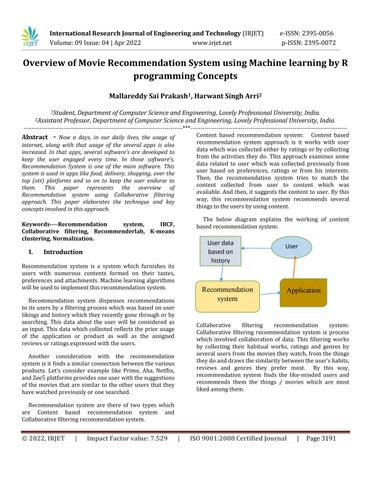
Content based recommendation system: Content based recommendation system approach is it works with user datawhichwascollectedeitherbyratingsorbycollecting from the activities they do. This approach examines some data related to user which was collected previously from user based on preferences, ratings or from his interests. Then, the recommendation system tries to match the content collected from user to content which was available.Andthen,itsuggeststhecontenttouser.Bythis way, this recommendation system recommends several thingstotheusersbyusingcontent.
The below diagram explains the working of content basedrecommendationsystem:
User data based on history
User
RecommendationApplication system


Collaborative filtering recommendation system: Collaborative filtering recommendation system is process which involved collaboration of data. This filtering works by collecting their habitual works, ratings and genres by severalusersfromthemoviesthey watch,fromthethings theydoanddrawsthesimilaritybetweentheuser’shabits, reviews and genres they prefer most. By this way, recommendation system finds the like minded users and recommends them the things / movies which are most likedamongthem.

II. Key Concepts:
Recommenderlabpackage:Recommenderlabisapackage which furnishes the framework to test and develop recommenderalgorithms.
It helps in creating recommendations for given data base which directly extracts ratings such as ratings from 1 to 5 in established area and evaluationenvironment.
This Package provides algorithms and helps the usertodesignandexecutetheirownalgorithmsin the framework through an uncomplicated procedure.
InR programming,Recommenderlabiscoinedas ‘recommenderlab’.
GGPlot2 package: Ggplot2 is a package of plotting that designedforplottingtherepresentationsfromdata.
GgPlot2 is a package that designed for plotting commands to design complicated plots from the datainadataframe.
This package has the graphics which boosts layer after layer by adding brand latest and crisp featurestoit.
ISSN:2395 0056
ISSN:2395
Thispackageplaysacrucialroleevenbyreducing the work for changing from one plot to other by makinglesseramountofadjustments.
Theselayershelpsforcustomizingtheplotsasper the user needs by using ample flexibility it provides.
In this package, we can the plot the data using ggplotfunction.
Syntaxofggplot: Ggplot(data,color,aes(x,y)).
Data. Table package: Data. Table package is a package where it provides to work with the tabular form of data.
Considerably, Data. Table package is a substitute package of R programming in built Data.Framepackage.
Main reason of this package being widely used is because of its speed. It handles the large amountofeasilyandrespondsinquicktime.
This package is also known fast reader package becauseoffastaccumulationoflargedatasets.
Reshape2 package: Reshape2 is a package of R written byHadleyWickham. Reshape2packagewas designedto allow one to transform the data easily into different typesofstructuresasonerequired.
Reshape2 is one of the package which uses for manipulating the data along with tidyr package to convert wider format data to the long format data.
Reshape2 is a very much fast version of reshape package. It was also more memory efficient.
In this new package, cast function is remodeled by two new functions which are ‘dcast’ and ‘acast’.
Dcastisforproducingthe data frames, whereas acastforproducingthearraysormatrices.


Melting and Casting are two important functions in reshape package. Melting uses to

International Research Journal of Engineering and Technology (IRJET) e ISSN:2395 0056
Volume:09Issue:04
Apr2022 www.irjet.net p ISSN:2395 0072
stretch the data in data frame by converting it into long format. Casting uses to convert long formatdatatoaggregatedformdata.
SyntaxofMeltandCastfunctions: Melt(data,na.rm,value.name) Cast(data,formula,fun.Aggregate)
Tstrsplit function: Tstrsplit function is literally a combinationfunctionofTransposeandstrsplitfunctions.
As, we can consider as Tstrsplit(x) is Transpose (strsplit(x)).
Tstrsplit is an appropriate wrapper function which uses the transpose to the function of splittingastring.
Wherexisvectororlistordataframe.
Sapplyfunction:SapplyfunctionisaninbuiltfunctioninR language. Sapply function takes all the inputs like vector, list or data frame as an input argument and returns a matrixorvector.
Sapply is a Wrapper class to Lapply in R where onlydifferenceisitreturnsinvector.
SyntaxofSapplyfunction: Sapply(x,fun) Wherexcanbevectororlistordataframe.
SyntaxofTstrsplitfunction: Tstrsplit(data,fill,type.Convert)
Recommender Registry: Recommender registry is a registrywhereitprovidestheregistrytomanagemethods fromtheRegistrypackage.
This Recommender registry helps users to add andspecifynewmethodstotheuser.
ThisRecommenderregistryisfromRecommender labpackage.
Recommenderregistry$get_entries()isafunction which was useful for getting the entries from the registry of recommender. This is also a part of recommenderlabpackage.
Item based Collaborative filtering (IBCF): Item based collaborativefilteringisoneofthe filteringmethodsinthe recommendation system. This collaborative filtering will searchforsimilardatabasedontheitemswhichuserhave likedorinteractedoftenwillbesuggested.
Item based collaborative filtering is a process wheretwoormoreuserswatchingsimilarkind of movieslikesamegenre,theme,language,actorand soonthenthemovieswhichwatchedbythemwill berecommendedtoeachoneofthem.
This approach is developed by Amazon in 1998 and from then it has been pivotal in many recommendationsystems.
Similarity&Cosinefunctions:
Similarity is the function which helps to find the similarities between the any documents and features.
Real Rating matrix is a matrix designed as it containingmatrixofratings ofuser oritembased whichareratedwithcertainratingsorstars.
Lapply function: Lapply is an inbuilt function in R language. Lapply function applies for list objects and returnssamelengthoflistobjects.
In Lapply, L means list, it returns output in only list.
LapplyfunctiontakesinputsofVector,listordata frameandreturnonlylistasoutput.
SyntaxofLapplyfunction: Lapply(x,fun)
Cosine similarity is the method of finding the similaritymeasurebetweenanytwovectorsinan innerproductspace.
FormulaforCosinesimilaritycalculationis“∑AiBi /(√∑Ai2 √∑Bi2)”
SyntaxofCosinefunction: Cosine(Data1,Data2)
Iftherearemorethan2datatofindthecosinewe use cbind to datasets and then we will find the Cosinefunction.
To find Cosine for a numeric value, we will use cos() function. As, we know Cos is an inbuilt mathematicfunctioninR.
International Research Journal of Engineering and Technology (IRJET) e ISSN:2395 0056
Volume:09Issue:04
2022 www.irjet.net
Geom_bar (): Geom_bar is a function used to create or draw a bar graph in R studio. Geom_bar is a package that comesunderGGplot2package.
SyntaxofGeom_bar(): Geom_bar(data,col)
Here the term Geom denotes that we want to createthebarplot.
Geom_text () is used to add the text to the representation.
Geom_label () is used to add the labels to the representation.So,thatmakestheusertoidentify theexactoutcomefromtherepresentation.
HeatMap:HeapMapisa datavisualizationtechniquethat produces the graphical representation of data. This Heat Map represents the values in a matrix as colors in the visualdiagram.
Shadingmatrixisanothertitleoftheheatmap.In this heat map, higher activity is represented by usingbrightercolorsandlesseractivityisbyusing darkercolors.
Syntaxofheatmap: Heatmap(data,col) Heredatamustbeinrowsandcolumns.
Quantile: Quantile is a generic function. Quantile is a function used to generate/ create sample quantiles with probabilitybetween0and1withinthedatapresent.
SyntaxofQuantilefunction: Quantile(data,probs,na.rm)
Hereprobsmeanstheprobabilities.
Qplot (): The function Qplot comes under the package of GGplot2. Qplot is the function similar to “Plot” function. This qplot() is used to create and combine different types ofplots.
Syntaxofqplot(): Qplot(data1,data2,geom)
Heregeomindicatesthetypeofrepresentation.
Normalization: Data Normalization is the one of the best methods in Data Science. Normalization makes sure that the data in customer database is well organized and can
ISSN:2395 0072
accessedin thesamekindofwayacross all the records in thedatabase.
This normalization is taken forward by standardizing the specific fields and records by transformingtheformatswithinthedatabase.
Normalize()isusedtoperformthisnormalization.
SyntaxofNormalize(): Normalize(data,method,range,margin)
Normalization is one best way to change a bad or average machine learning model to good learning modelbynormalizingthedata.
Forsuppose,ifwedonotnormalizethedata,then that makes the data clumsy which definitely effectsthemodelperformance.
Binarize function: The Binarize function is a function which collects data in numerical and categorical form and returnsthebinarydata.
Thisbinarizefunctionispartofapreparatorystep ofCorrelatefunction.
This binarize function converts normal form of matrixintobinaryformofmatrix.
Syntaxofbinarizefunction: binarize(data,threshold) Here threshold is default by NA which means medianisconsideredasthreshold.
KNN Algorithm: KNN algorithm means K Nearest Neighbors algorithm. K Nearest Neighbor algorithm is a supervised machine learning algorithm used for classificationandregressionconcepts.
KNN algorithm assumes the similarity among the new data and accessible cases. And compare, replace the case which is most similar to the availabledatacategories.
KNN collects all data and classifies new point ‘K’ based upon similarity. Then it is classified into anothercategoryusingthealgorithm.
KNNisknownasLazyLearneralgorithm.Because itdoesn’tlearnfromthedata.
International Research Journal of Engineering and Technology (IRJET) e ISSN:2395 0056
Volume:09Issue:04|Apr2022 www.irjet.net p ISSN:2395 0072
Insteaditstoresthedataandperformsthetaskof classifying.
StepsofKNNalgorithm:
Step1:Firstly, wehave toselect value‘K’, number ofneighbors.
Step2: By using distance formula, we have to find ‘K’nearestneighbors.
Step3: As, we know distance formula is ““√(X2 X1)2 +(Y2 Y1)2
Step4: In each category, count the number of neighbors.
Step5: Category which has maximum neighbors assignthenewdatapoint.
Train & Test: This Train and test is a procedure demands considering a dataset and then divide them into two subsets.
Trainingdataset:The1st subsetwhichdividedwas machine learning model which used to be fit in process.
Testing dataset: The 2nd subset was used in the process to evaluate the fit machine learning, then estimations are made and start comparing with theexpectedvalues.
By these steps, implementation of KNN algorithm iscompleted.
K Means Clustering Algorithm: K Means is an unsupervised machine learning algorithm used in data science and machine learning, groups the unlabeled data intodifferentclusters.
Main aim of this algorithm is minimizing the sum of distances b/w two data points among parallel clusters.
Mainly, these two are used to know the accuracy of data present. It is a technique to examine the performanceoftheMLalgorithm.
Thisisusedforanysupervisedlearningalgorithm andusedforregressionorclassification.
Recommender Algorithms: There are some recommender algorithms which helps while using recommender technique.
And there some algorithms which are specified according to the ratings from 1 to 5 stars which are helpful in Recommendationsystemswhichare:
In K Means algorithm, clusters are associated with a centroid, hence it is a centroid based algorithm.
UBCF:User basedcollaborativefiltering
IBCF:Item basedcollaborativefiltering
SVDwithcolumn meanimputation
In this algorithm, K indicates the count of pre definedclustersthatuserwanttomade,asifK=5, then there will be 5 clusters as it has similar propertieswithintheclusters.
SVDF:FunkSVD
ALS:AlternatingLeastSquares
LIBMF:MatrixfactorizationwithLIBMF
AR:Associationrule basedrecommender
POPULAR:Popularitems
K Meansalgorithmsteps:
Step1: Choosing the number K to decide the numberofclusters.
Step2:ChooserandomKcentroids.
Step3: Allocating each data point to their nearest centroid,whichcreatethepre definedKclusters.
Step4: Calculating the variance and putting a new centroidforeachnewcluster.
Step5: Repeat the third step, for newly created clusters.
Step6: If reallocation happens, then repeat the fourthstep,elsefinishthesteps.
RANDOM:Randomlychosenitemsforcomparison
RERECOMMEND:Re recommendlikeditems
HYBRIDRecommender:Hybridrecommendation
GetModel: GetModel is a type of model which returns the representation of the data. It elaborates the kind, propertiesofdata.ThisGetModelisusedforanalysisofthe datasetwhichpresent.
SyntaxofGetModel: X< data getModel(X)
By these steps K Means clustering implementationiscompleted.
This gets or retrieves all the model of data from theX.
International Research Journal of Engineering and Technology (IRJET)
09
Predict Function: The Predict function (Predict()) in R language
used to estimate/predict the values based on the
dataoccurredfromthedatapresent.
Predict is a generic function and it is a single method for ‘lm’ object. The lm method is present underthestatspackageinRstudio.
Syntaxofpredict: Predict(data,newdata,interval)
Interval in prediction is a range of values which arelikelytocontainofanewobservationforgiven specifiedthingsofpredictionsorpredictors.
III. Conclusion
Recommendationsystemplayedacrucialroleformanyin getting succeed. Generally, as a human beings, we recommend to others or we seek recommendation from others. Like us, applications also require to recommend their features to keep the user engaged while using their application. So, this recommendation system played a crucialfortheapplications.Thereismoretoexploreinthis recommendation system. In future, there will be eminent growthinthistopic. Inthis paper,Ihavementionedsome key concepts which I used in the movie recommendation system using machine learning algorithms in R programming.
IV.
www.irjet.net
ISSN:2395 0056
ISSN:2395 0072