
Design of Isolated DC Solar Powered Microgrid with Storage System
Zeina Bahij1, Abdulla Ismail2
1Graduate Student, Dept. of Electrical Engineering, Rochester Institute of Technology, Dubai, UAE
2Professor, Dept. of Electrical Engineering, Rochester Institute of Technology, Dubai, UAE

Abstract The use of green energy has been of wide interest in recent decades it limits emissions and produce cheap energy due to the fact that they depend on renewable energy resources that are available at no cost. However, these resources are intermittent and can not stand alone to support a Microgrid system to satisfy the demand. This can be solved by using an energy storage system. In this paper, an electrical model of the photovoltaic system is presented. Parameters from datasheet of a photovoltaic system, I(V) and P(V) characteristics plot are used to calculate the exact series and shunt resistances. The variable output power of the PV system was controlled by Boost converter that uses MPPT algorithm. Energy system used in this paper is the battery energy storage system (BESS) based on Lithium ion batteries controlled by Buck Boost converter that uses PID controller.
Key Words: Microgrid, Photovoltaic System, Battery EnergyStorageSystem.
I. INTRODUCTION
1.1 Photovoltaic Cell
Photovoltaiccellisadevicethatisusedtoconvert sunlight energy into power. It is becoming of wide interestworldwidesinceitusesarenewableenergy resource to produce green energy that will reduce emissions.
Solar cells consist of a p n junction fabricated in a thinwaferorlayerofsemiconductor.Inthedark,the I V output characteristic of a solar cell has an exponentialcharacteristicsimilartothatofadiode.
Whenexposedtolight,photonswithenergygreater than the bandgap energy of the semiconductor are absorbed and create an electron hole pair. These carriers are swept apart under the influence of the internalelectricfieldsofthep njunctionandcreate a current proportional to the incident radiation. Whenthecellisshortcircuited,thiscurrentflowsin the external circuit; when open circuited, this current is shunted internally by the intrinsic p n junction diode. The characteristics of this diode thereforesetstheopencircuitvoltagecharacteristics ofthecell.[1]
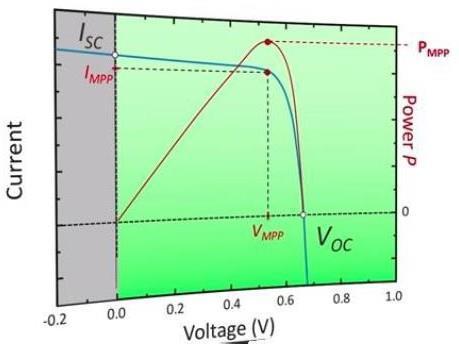
Theperformanceofasolarcellcanbedemonstrated bymeasuringitscurrentversusthevoltage.TheIV curveisthesuperpositionoftheIVcurveofthesolar
cell diode in the dark with the light generated current.Bothparameters,VOCandISC,definetheIV curve. The power of a solar cell is defined as the voltagemultipliedbythecurrentatanypointonthe IV curve. With the IV curve it is possible to determine the maximum power point (MPPT). In Figure 1, it is represented the power versus the current (red line). The current and voltage where the maximum power point is located are also two parameters that define the characteristics of the solarmodule.Thatpoweristheonedeliveredtothe rest of the PV system and eventually to the load. Therefore, it is essential that the solar module operatesatthemaximumpower.[2]
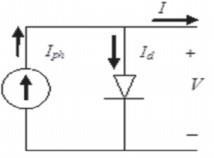
The simplest equivalent circuit of a solar cell is a currentsourceconnectedinanti parallelwaywitha light current source [3]. This model does not take intoaccounttheinternallossesofthecurrent.Figure 2showstheequivalentcircuit.
UsingKirchhofflawtocalculatetheoutputcurrent: I= Iph Id (1) whereIphisthephotocurrent. Idisthediodecurrentgivenby
theBoltzman
(1.602x10
C)
Ns is the number of PV cells connected inseries and A is the the ideality factor depends on PV Technology.
real
itisimpossibletoneglectcurrent
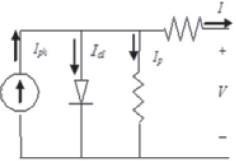
seriesresistanceRsandParallelresistanceRpare addedtothecircuit.Seriesresistancesarecausedby thecontactresistancebetweenthemetalcontactand the silicon, the movement of current through the emitter and the base of the solar cell and the resistanceofthetopandrearmetalcontacts.While shunt resistance causes significant power losses typically due to manufacturing defects rather than poorsolarcelldesign.Figure3showstherealcircuit ofasolarcell.
A. Battery Storage System
(ESS) have been used in
time.Withthe wideuseofsmartgrids,ESSarebecomingofmore
to the use of renewable
cannotsatisfytheloaddemandat all times due to their intermittency nature. Hence,
Figure 3 Real Life Equivalent Circuit of Solar Cell [3]
these resources must be stored when thegeneratedpowerexceedsthepowerdemand,so itcanbeusedlatertosatisfyloaddemand.ESSare of many types, compressed air, super capacitor, flywheel, pump storage and batteries. Selection of thesuitablebatteryenergystoragesystemdepends on many factors including capacity, performance and cost. The mostcommonly used energy storage systemisthebatteryenergystoragesystem(BEES) [4]. Batteries can convert electrical energy into chemical energy while charging, and convert back intoelectricalenergywhiledischarging. The rechargeable batteries have been enhanced from lead acid to nickel-based battery and then to lithium ion batteries. Lithium-ion battery is a relatively new technology that was first commercialized in 1991[5]. Lithium-ion batteries areknowntotheirfollowingadvantages:
1. High energy density: large scale ESS require the use of specific energy and energy density [6]. At earlystages,Li-ionbatterywereofenergydensityof order 200 Wh/L. In 2012, energy density was enhancedtoreachorderof725Wh/L.[7]
2. Long life time: Current Li-ion technology under test in-grid connected system is used. It has a lifetimeof20yearsat60%depthofdischarge(DOD) perday.At100%degreeofdischargethebatterycan operateover6000cycles.
3.HighEfficiency:94%efficientover100%Degree ofdischarge.Efficienciesof98%havebeenfoundfor small discharges in case the battery is close to full charge.91%isthemaximumefficiencydropowing tocells’age,whichismuchmoreefficientcompared toothertechnologies.[8][9]
2. MODELING
PV System Modeling
In order to find the best model, several parametershavetobecalculated.In[10],amodelof moderate complexity was used where the temperature dependence of the photo current IL, saturationcurrentofthediode
0.,seriesresistance RS were included, but effect of the shunt resistance wasneglected.
equations to describe the IV characteristics whereasfollows:
current:
[11] Iph, I0, RS, RP were calculated. Photocurrent is calculated assuming that when PV modelisshort circuited,Iph=ISCRef,whichistheshort circuitcurrentreference,calculatedatthestandard testconditions(STC).
ph,ref isthePhotocurrent(A)atSTC.
(A/K),
bythemanufacturer
the most remarkable points at standard test condition:
voltage at open circuit (I =0, V=
currentatshortcircuit(V=0,I=Isc,ref),and thevoltage(V
)andcurrent(Imp,ref)at maximum power,thereversesaturationcurrentis:
shunt
calculated at maximumpowerpoint,Rsisfirstsettozeroandthen
then
andtheoretical
is calculated using the
the
First, equations of
ofthediode from[11],whichdoesnotconsidershuntresistance,
usedtoplottheIVandPVcharacteristics.Then, series
pointisachievedatthemaximum
willbeincrementedfrom0tillthe maximum
at
toTable1.Shuntresistance is
calculatedusing
(17).
of the Battery System
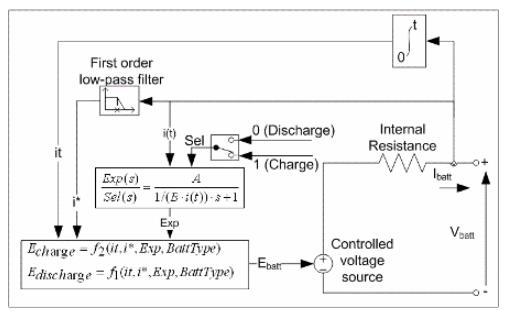
batterycurrent,inA.
maximumbatterycapacity,inAh.
theexponentialvoltage,inV.
:theexponentialcapacity,inAh−1
single battery of fully charged voltage of 4.2 V is not enough for a Microgrid modeling. Several batteries must be connected to increase capacity, nominalvoltage,fullychargedvoltageandnominal discharge current. Parameters of single Lithium battery were extracted from the datasheet and are shown in Table 2.For connected batteries, parameterswillbeasshowninTable3.
Panasonic Lithium Ion CGR18650AF Lithium Ion Batteryisused.36batteriesareconnectedinseries and125batteriesareconnectedinparallelherefor aratedcapacityof 800Ahandthenominalvoltage will be 130 V. BESS was summed to have initial chargeof100%.Temperatureeffectsareneglected inthisstudy,sincethedifferencebetweenmaximum andminimumtemperatureusedinthePVmodelin section3.3is90 .
Table 2 Extracted Parameters of the Panasonic Lithium Ion CGR18650AF
Parameter Value
NominalVoltage(c) 3.3V Rated Capacity 2.05Ah MaximumCapacity(d) 2Ah FullyChargedVoltage(a) 4.2V NominalDischargecurrent 1.95A Internalresistance(estimated) 16.5mΩ Capacityatnominalvoltage(c) 1.81Ah
Exponentialzone(b) [3.71V,0.6Ah]
Nominalambienttemperature 250C Secondambienttemperature 00C Maximumcapacityat00C(h) 1.78Ah Initialdischargevoltageat00C (e) 4V
Voltageat90%maximu capacityat00C(g) 3.11V
ExponentialZoneat00C(f) [3.8V,0.2Ah]
Thermalresistance,cell to ambient(estimated) 0.06
Thermaltimeconstant,cell to ambient(estimated) 1000
Table 3 Parameters of Connected Batteries
Parameter Value
NominalVoltage 1.18*Nb_ser Rated Capacity 6.5*Nb_par MaximumCapacity 7*Nb_par FullyChargedVoltage 1.39*Nb_ser NominalDischargecurrent 1.3*Nb_par Internalresistance (estimated) 0.002Nb_ser/ Nb_par Capacityatnominalvoltage 6.25*Nb_par Exponentialzone 1.18*Nb_ser, 1.3*Nb_par
3. CONTROL SYSTEMS
Converters are widely used to control the power flow, voltage, system balancing, maximum power pointtrackingandfaultprotection.[13]Converters switched mode power supplies, which can convert theDCvoltagefromoneleveltoanother. Itcanstep uporstepdownthedcvoltagesource.Steppingup the voltage means stepping down the current and viceversa. The dc dc converters are widely used for traction motorcontrolinelectronicautomobiles,trolleycars, marine hoists, forklift trucks, and mine haulers. They provide smooth acceleration control, high efficiency, and fast dynamic response. DC DC converterscanbeusedinregenerativebrakingofdc motors to returnenergybackinto the supply, than this feature results in energy savings for transportationsystemswithfrequentstops.[14]DC convertersareusedindcvoltageregulatorsandalso areusedinconjunctionwithaninductor,togenerate adccurrentsource,especiallyforthecurrentsource inverter.
B. Control of PV Model
PV module produces variable power depending on irradiance and temperature and it reaches maximum power point, productofVmpp andImpp, at specific irradiance and temperature. Maximum Power Point Tracking (MPPT) algorithm is used to extract maximum power from renewable energy resources like wind turbines and PV, under all conditions, since they produce variable power due to their intermittency nature [15][16]. Its main objective is to find the maximum power point and keep the load resistance, characterized by the I V curve, at that point. MPPT devices are integrated
into an electric power converter system that provides current or voltage conversion, regulation fordrivingvariousloads. Manyresearchershasproposeddifferentstrategies to extract maximum power form PV using MPPT algorithm. In [17] tracking maximum power point usinglinearrelationshipbetweenmaximumvoltage andopencircuitvoltage.In[18]theauthor useda look uptabletotracktechniqueswithmeasurement and comparison. The use of microcontrollers in power systems enables the implementation of AI techniques.In[19]ArtificalNeuralNetwork(ANN) MPPT controller was proposed based on fixed and variablestepsize,isproposed.Inthisworknumber of layers and neurons, parameters of training algorithim of the MPPT Controller were generated andthenusedinPVsystem.
Perturbation and Observation (P&O) technique is widely used. Its main advantage is that it is independent on PV generator characteristics, like solar intensity and cell temperature and can be implemented in analogue and digital circuits. It perturbs the operating point to let the voltage fluctuatearoundthemaximumpowerpointvoltage despite the variation of irradiance and temperature[20]. This strategy is widely used becauseofitssimplicityandefficiency.However,it lacks fast adaptability which is important to track fast transients under varying environment conditions[21 23]. In this research, incremental conductance MPPTis used. The IncCondmethodis the one which overrides over the aforementioned drawbacks. In this method, the array terminal voltage is always adjusted according to the MPP voltage. It is based on the incremental and instantaneous conductance of the PV module[24 27].
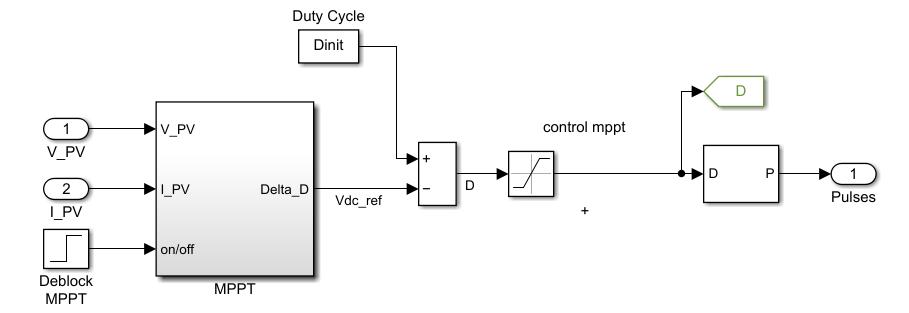
A boost converter of 5 kHz and 300 V reference is used tocontrol the outputof PV system, this boost converter is controlled by MPPT (incremental conductance+integralregulator).
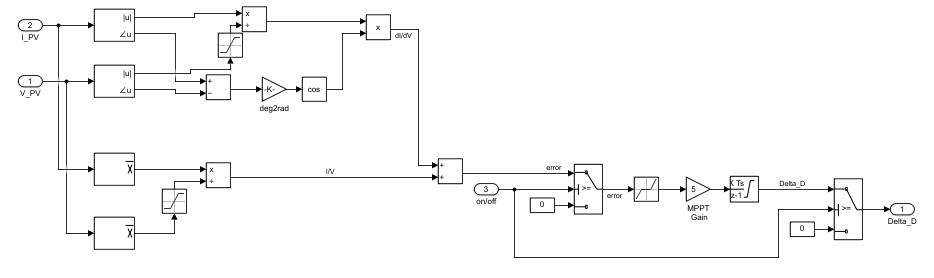
Figure5showstheMPPTusedforcontrolofboost converter. Output voltage and current of the PV system are the inputs to the MPPT subsystem. A Deblock is used to switch MPPT on or off. MPPT subsystemisshowninFigure6.OutputoftheMPPT
istheDCvoltagereferencesubtractedfromtheDuty cycleandthenusedtogeneratepulsesofthePulse Width Modulation of frequency 5 kHz and initial valueof0.25.DC DCconverterisshowninFigure7.
Figure 7 Boost Converter used to control PV system

Control of Charging ad Discharging of the Battery System
Figure6showstheincrementalconductanceMPPT subsystem used. Its inputs are the output voltage and current of the PV system. The array terminal voltage is always adjusted according to the MPP voltage. It is based on the incremental and instantaneousconductanceofthePVmodule.
The buck boost converter operation is a combination of the buckand boostconverter, it canlowerorhighertheoutputvoltageaccording to thedutycycle, itis lowerthan0.5 theoutput voltagewillbelessthantheinputvoltage,elseit willbemorethantheinputvoltage.Equation21 shows the relation between duty cycle and outputvoltage.
CharginganddischargingprocessesoftheBESS is controlled using boost buck converter as showninFigure8. AconstantvoltageattheDC bus is required 130 V is used as a voltage reference.
Figure 6 MPPT subsystem
Boostconverter(Figure7)boosttheoutputvoltage ofthePVsystemto300V.Whentheswitchisclosed the inductor store energy and there is no current delivered the diode, energywill be supplied bythe capacitorcharge.Energystoredintheinductorwill bedeliveredtotheloadtoboostoutputvoltageand recharge the capacitor when the switch is open. Inductor immediately reverse its electromagnetic field to opposes any drop in current. Voltage is controlled by varying the duty cycle that is pulses generatedfromtheMPPTsubsystem.
Figure 8 Boost Buck Converter Used to Control BESS System
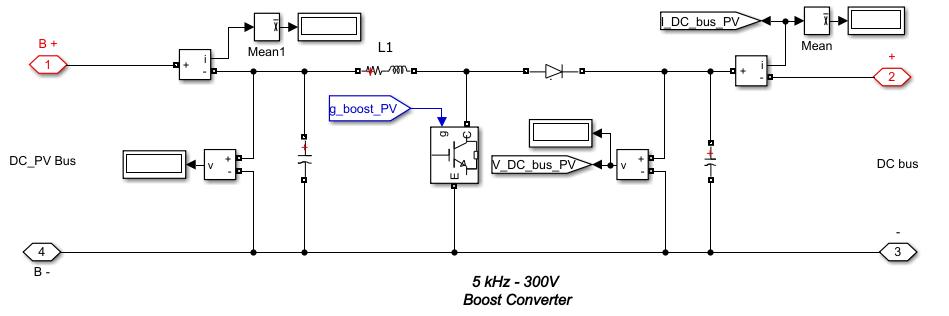
Capacitorofcapacitance100μFisusedasaDClink. Resistor of resistance 0.005 Ω and inductor of inductance5mHwasused.
A capacitor of capacitance 12 μ6 and resistor of resistance 0.1 Ω is used as DC link. Two IGBT transistorsareusedoneforcontrollingbuckandthe other for controlling the boost part. Inputs of the first switch are constants zero and 1, the switch outputistheinputofthebreakerusedforthebuck boostconvertershowninFigure9
The voltage of the DC bus is compared with a reference voltage of 130 V (nominal voltage of the battery).IfthevoltageoftheDCbusisgreaterthan the reference voltage the battery will be charging, hence the boost converter will be activated. Otherwise, the battery will be discharged and the buckconverterwillbeactivated.
Anerrorsignal,whichisthedifferenceoftheDCbus voltageandthevoltagereference,isusedforthePID controller.Figure10showsthePIDControllerused with Ki= 3 and Kp=0.02 for the Boost voltage Controller.Figure10showsthePIDControllerused with Ki= 110 and Kp=0.02 for the Buck voltage Controller.
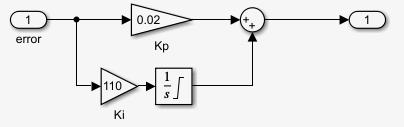
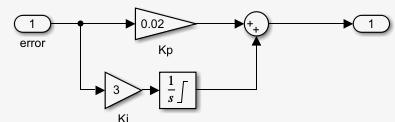
Figure 12 IV characteristics without Rp
Figure13shows the PVcharacteristicsinRsmodel without considering shunt resistance. As series resistance increases, maximum power point decreases and approaches the maximum power point (49 W). When Rs= 0.9 Ω, curve showed MPP maximumpowerat49W.Rpwasfoundtobe185Ω aftersubstitutingRsin(17).
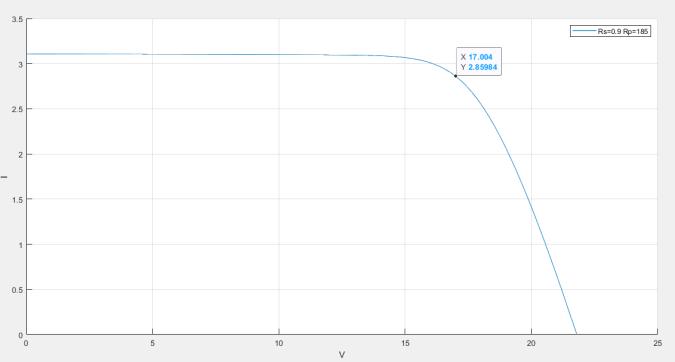
Figure 9 Voltage Controller of the Bidirectional Boost Buck Converter
Figure 10 PID Controller for the Boost Voltage Controller
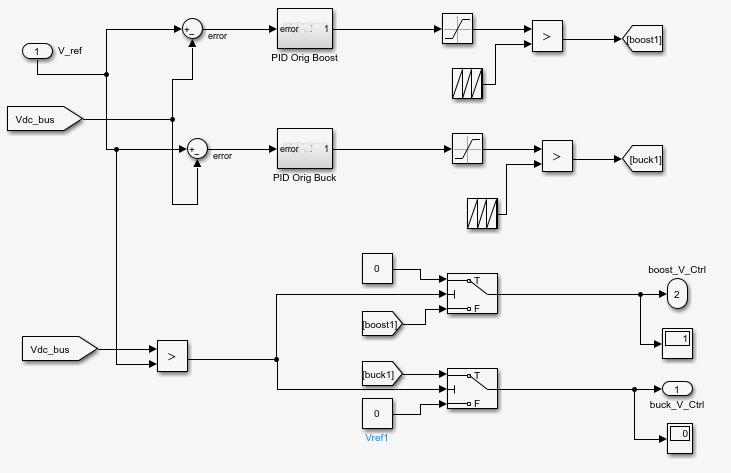
Figure 13 PV characteristics without Rp
Figure 11 PID Controller for the Buck Voltage Controller
4. RESULTS
4.1 Results of the PV Model
Figure 12 shows the IV characteristics in Rs model without considering shunt resistance. As series resistance increases, maximum voltage point decreases and approaches the maximum power point (17V). When Rs= 0.9 Ω, curve showed MPP maximumvoltagepoint.
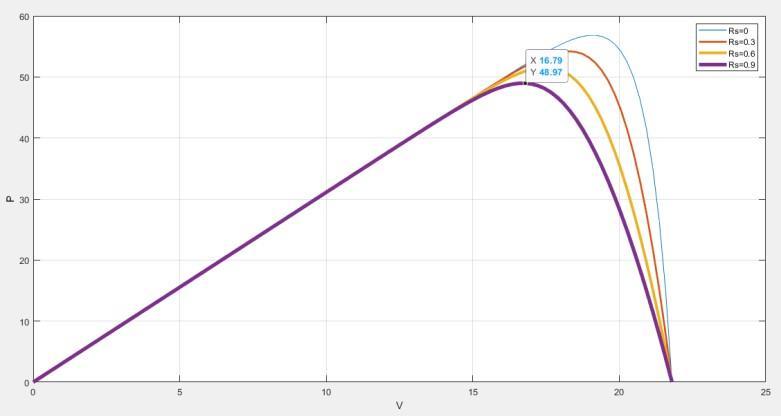
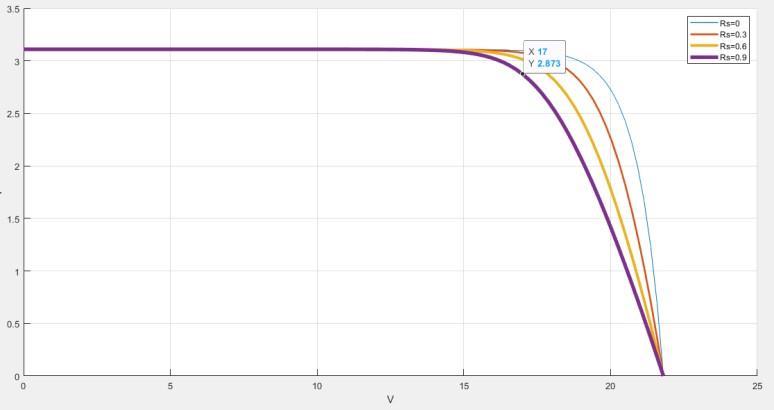
Figure 14 represents IV characteristics for the PV model using series and parallel resistances at STC. MPP and maximum current were achieved at 17 V andthatverifiedourmodel.Impwas2.85at17.004 V(Accuratevoltageandcurrentat17Vcouldnotbe measured due to the step size of the cursor in Matlab).
Figure 14 IV characteristics with series and parallel resistances
Figure 15 represents PV characteristics for the PV model using series and parallel resistances at STC. MPPand maximum current were achieved at 17 V and that verified our model. Pmp was 48.774 A at 16.7 V. (Accurate power and current at 17 V could notbemeasuredduetothestepsizeofthecursorin Matlab).
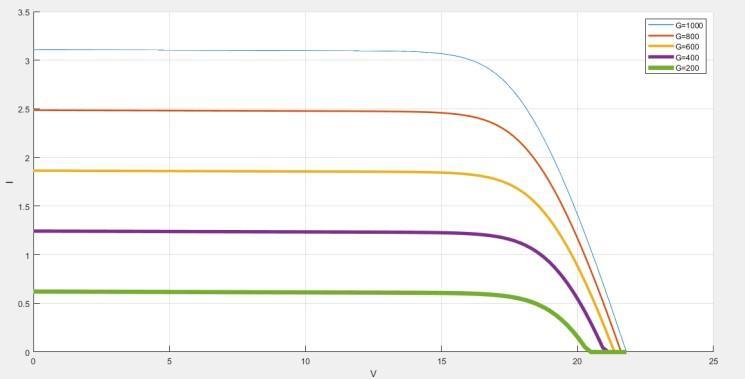
Figures 18 and 19 show IV and PV characteristics at temperature of 25 0C but differentirradiances.Atalowerirradiation,the short circuit current decreases approximately linearly with irradiation It reaches 0.6A at irradiance of 200 W/m2. The open circuit voltage does notdecrease as much until a very low irradiation. However, it is much more affected by the temperature of the PV cell.
Figure 15 PV characteristics with series and parallel resistances
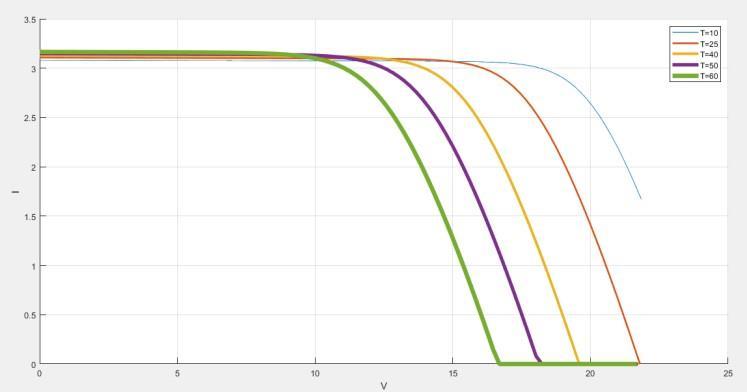
Figures16and17showIVandPVcharacteristicsat irradiance of 1000 W/m2 but different temperatures. At a higher temperature, the open circuit voltage decreases to 16.25 V at 600C. The phenomenon has quite a large impact and it decreasestheoutputpowerto34wastemperature increasesfrom250Cto600C.
Figure 18 IV characteristics at T=250C different irradiances
Figure 16 IV characteristics at G=1000 W/m2 different temperatures
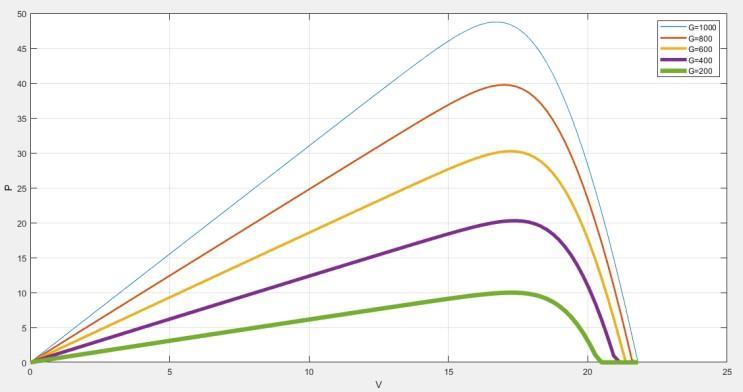
Figure 19 PV characteristics at T=250C different irradiances
Thecurrentisdirectlyproportionaltotheirradiance while the voltageincreases rapidly with increasing irradiance.However,afteraspecificirradiance,the voltage will be constant regardless of increasing irradiance.
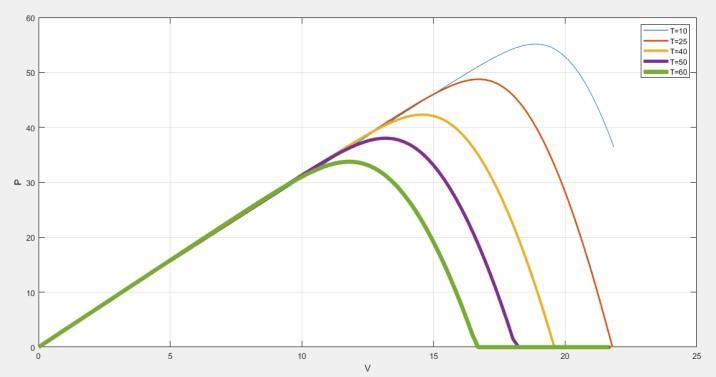
Figure 17 PV characteristics at G=1000 W/m2 different temperatures
Figure20showstheoutputcurrentpfthePVsystem beforecontrol.Currentchangesproportionallywith changing irradiance. When irradiance is zero, no output current from PV is generated. When irradiancestartedincreasinggradually,thiscurrent increases to reach a maximum value of 120 A. We have40parallelconnectedpanelsandeachonehas outputcurrentatmaximumpowerpoint2.88A.
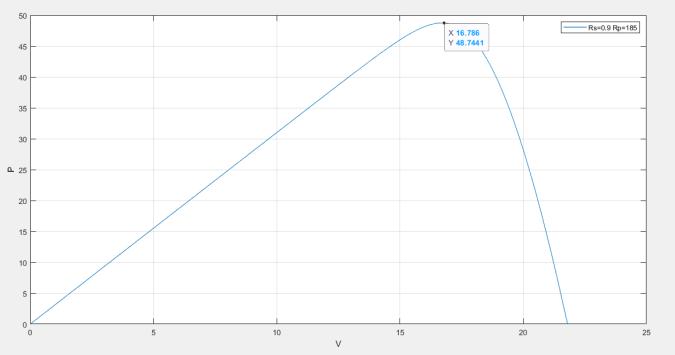
Figure 20 PV Output Current
Figure21showstheoutputvoltageofthePVsystem before control. The voltage is about 151 V when irradiance is zero. At maximum irradiance, the voltage reaches 153.45 V Irradiance effect on this voltage is weak compared to the effect on the current. This verified the PV model discussed in chapter3.Wehave10seriesconnectedpanelsand eachonehastheoutputvoltageatmaximumpower pointof17V.
4.3 BATTERY SYSTEM OUTPUT




Figure 23a shows the state of charge of the battery system, when no output power generated fromPVsystem,batterywilldischargetosupplythe loadtovalueof99.999%sincesimulationtimeis23 secondssinceMatlabtakeslongtimetosimulatea24 hourssystem.
BatterywillchargewhenthePVstartedsuppling currentandvoltage,whenthestateofchargereaches 100%itremainsconstantuntilPVcannotsupplythe demand,thenthebatterydischargedagain.
Figure 23 b shows the output current of BESS. During discharge the current is positive, while charging the current is negative it reaches 120 A whichisthesameasthePVsystembutwithopposite polarity.
Figure 23 c shows the output voltage of the battery,itisthesameoutputvoltageofthePV.
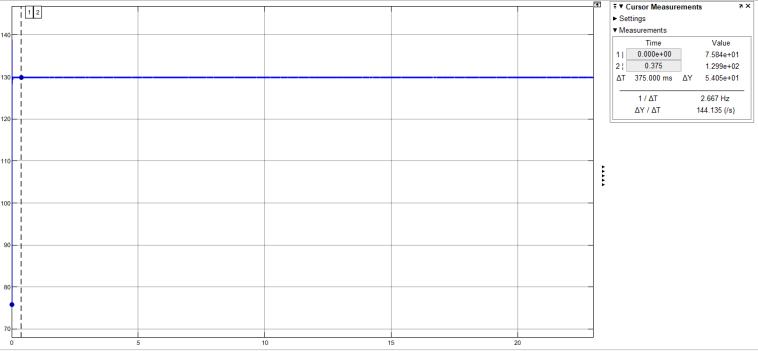
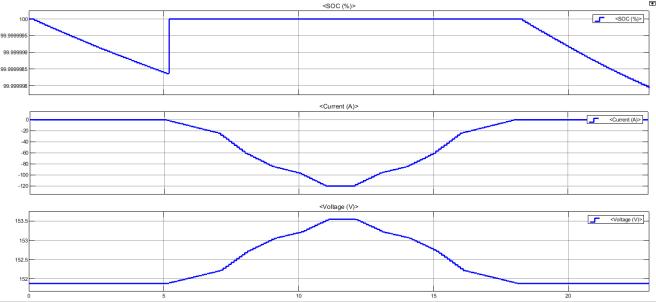
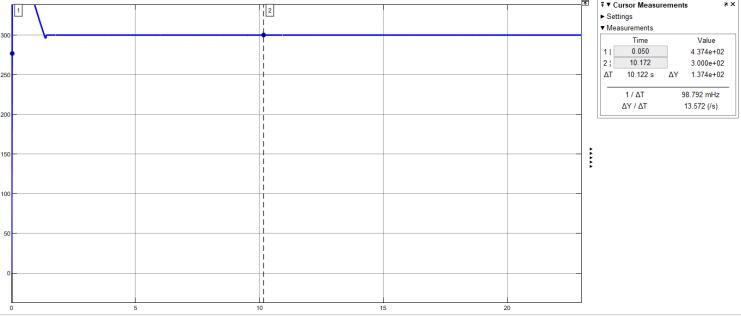
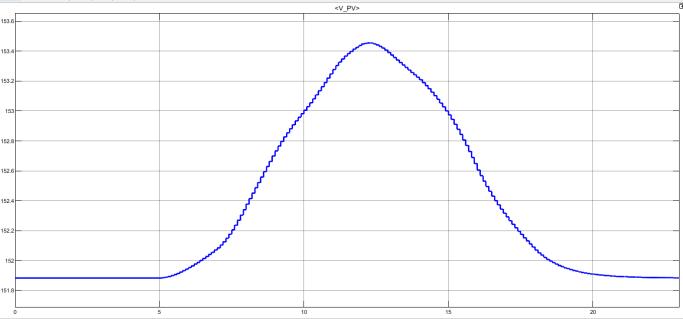
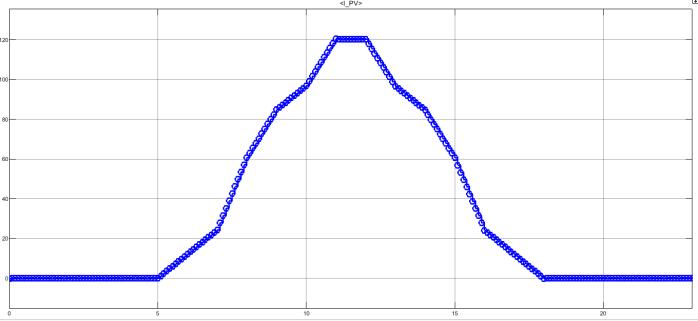
Figure 21 PV Output Voltage
4.2 Results of the PV Model Control System
Figure22showstheoutputvoltageofthePVsystem, wheretheoutputvoltageattheDCbusincreasesto reach437V. Thenitdecreasesto a constantvalue, for the rest of the day, at 300 V, which the DC bus voltagerequired.
Figure 23: SOC, Current and Voltage of battery system
4.4 Battery System Control
voltageattheDCbusofthebatteryreachesa constantvalueof130Vafterfewmillisecondsfor therestofthedayasshowninFigure24
Figure 22 DC Bus of the PV system
5. CONCLUSION
The presentedworkcalculated theexactseriesand shunt resistance of a PV model. It is implemented under MATLAB/Simulink environment; the most used software by researchers and engineers. MaximumPowerPoint(MPPT)parameters(current, voltage and power) have been taken from the datasheet and I(V) and P(V) characteristics curves were plotted at different resistanes until MPP was reaches. Then, relation between series and shunt resistances were used to calculate the shunt resistance
ItisimportanttocomputeRS,evenifitisgivenbya manufacturer because the experimental Maximum PowerPointdoesnotmatchwiththecomputedone Onlyonepairsatisfiestheconditionofmatchingthe modeledandtheexperimentalpeakpower.So,Rs is iteratively increased until satisfying the condition. TheproposedRp modelgave(Rs =0.9Ω,Rp =185Ω).
A boost converter was used to control PV system. This Boost converter was controlled with MPPT (incremental conductance)used for control. Output oftheMPPTistheDCvoltagereferencesubtracted fromtheDutycycleandthenusedtogeneratepulses ofthePulseWidthModulation.
TheoutputvoltageattheDCbusincreasestoreach 437V,thendecreasestoconstantvalue,fortherest of the day, of 300 V which is the DC bus voltage required.
Panasonic Lithium Ion CGR18650AF Lithium Ion Batteryisused.NominalVoltageandcapacitywere takenfromdatasheetofasinglebattery.36batteries are connected in series and 125 batteries are connectedinparallel, A bidirectional Boost Buck Converter was used to control the discharging and charging processes of the Battery System. Boost part controls the dischargingprocess andthe Buckpartcontrols the dischargingprocess.
VoltageattheDCbusofthebatteryincreasesfrom 75V to reach constant value of 130 V after few millisecondsfortherestoftheday.
II. REFERENCES
[1] WALKER,G.EvaluatingMPPTConverterTopologiesusinga
PVModel.UniversityofQueensland.Australia.
[2] S.MaLu“Modelling,ControlandSimulationofaMicrogrid basedonPVSystem,BatterySystemandVSC”January2018.
[3] H.Belliaa,*,R.Youcefb,M.Fatimab”Adetailedmodelingof photovoltaic moduleusing MATLAB” National Research Institute of Astronomy and Geophysics NRIAG Journal of AstronomyandGeophysicsApril2014
[4] Dabra, V. Paliwal, K. K. Sharma, P., Kumar, N.(2017) Optimizationofphotovoltaicpowersystem:Acomparative study.ProtectionandcontrolofModernPowerSystems2 (1),3.
[5] Kumari,J.S.,Babu,A.K.(2012).DesignandAnalysisofP&O and IP&o MPPT techniquies for photovoltaic system. International Journal of Modern Engineering Research, 2(4),2147 2180
[6] Xuebing,H.;Minggao,O.;Languang,L.Acomparativestudy of commercial lithium ion battery cycle life in electrical vehicle: Aging mechanism identification. // Journal of PowerSources,251,(2014),pp.38 54
[7] Sikkabut,S.; Mungporn,P.; Ekkaravarodome,C.; Bizon,N.; Tricoli,P.; Nahid Mobarakeh,B.; Pierfederici,S.; Davat,B.; Thounthong, P. Control of High Energy High Power Densities Storage Devices by Li ion Battery and Supercapacitor for Fuel Cell/Photovoltaic Hybrid Power Plant for Autonomous System Applications. // IEEE Transactions on Industry Applications, 52, 5(2016), pp. 4395 4407.
[8] Sera, D., Teodorescu, R., Hantschel, J. & Knoll, M. (2008). Optimizedmaximumpowerpointtrackerforfastchanging environment conditions. In Industrial Electronics, 2008. ISIE 2008. IEEE International Symposium on (pp. 2401 2407).IEEE.
[9] Faruk, A Yazmadi, A, : “Energy Storage Technologiws for Grid Connected and Off Grid Power System Applications Electrical Power and Engery Conference (EPEC), 2012 IEEE,Publicationyear:2012Page:303.310
[10] Tremblay, O.; Dessaint, L.-A. Experimental Validation of a Battery Dynamic Model for EV Applications. // World ElectricVehicleJournal,3,(2009),pp.289-298.
[11] F. Mohammed “MICROGRID MODELLING AND SIMULATION”EspooMarch2016
[12] Geurin,Scott,O:Bames,Arthur:SmartGridApplicationsfor Selected Eneegry Technologies Innovative Smart Grid Technologies (ISGT), 2012 IEEE PES. Publication Year: 2012,Pages:1 8
[13] Muhammad H. Rashid, “Power Electronics: Circuits, Devices,andApplication”.THIRDEDITION
[14] DesignandsimulationofdcMicrogridinbelize D.W.Hart, Powerelectronics.TataMcGraw HillEducation,2011.
[15] Masoum, M.A.S.; Dehbonei, H.; Fuchs, E.F. Theoretical and experimental analyses of photovoltaic systems with voltage and current based maximum power point tracking.IEEETrans.EnergyConvers. 2002,17,514 522.
[16] Ram,J.P.,Babu,T.S.,Rajasekar,N.:‘Acomprehensivereview on solar PV maximum power point tracking techniques’, Renew.Sustain.EnergyRev.,2017,67,pp.826 847
[17] Kumar, D., Chatterjee, K.: ‘A review of conventional and advanced MPPT algorithms for wind energy systems’, Renew.Sustain.EnergyRev.,2016,55,pp.957 970
[18] Yamashita, H.; Tamahashi, K.; Michihira, M.; Tsuyoshi, A.; Amako,K.;Park,M.AnovelsimulationtechniqueofthePV generation system using real weather conditions. In ProceedingsofthePower
[19] Conversion Conference, Osaka, Japan, 2 5 April 2002; Volume2,pp.839 844.
[20] Messalti,S.;Harrag,A.;Loukriz,A.Anewvariablestepsize neural networks {MPPT} controller: Review, simulation and hardware implementation. Renew. Sustain. Energy Rev.2017,68,221 233.
[21] M.A.Elgendy,B.Zahawi,andD.J.Atkinson,“Assessmentof perturb and observe MPPT algorithm implementation techniques for PV pumping applications,” IEEE TransactionsonSustainableEnergy,vol.3,no.1,pp.21 33, 2012.
[22] H. Malek and Y. Chen, “BICO MPPT: a faster maximum power point tracker and its application for photovoltaic
panels,” International Journal of Photoenergy, vol. 2014, ArticleID586503,9pages,2014.
[23] Dabra, V., Paliwal, K. K., Sharma, P., & Kumar, N. (2017). Optimizationofphotovoltaicpowersystem:Acomparative study. Protection and Control of Modern Power Systems, 2(1),3.
[24] F.Liu,S.Duan,F.Liu,B.Liu,andY.Kang,―Avariablestep size INC MPPT method for PV systems,‖ IEEE Trans. Ind. Electron.,vol.55,no.7,pp.2622 2628,Jul.2008
[25] K. H. Hussein, I. Muta, T. Hoshino, and M. Osakada, ―Maximumphotovoltaicpowertracking:Analgorithmfor rapidlychangingatmosphericconditions,‖Proc.Inst.Elect. Eng. Gener,Transmits.Distrib.,vol.142,no.1,pp.59 64, Jan.1995.
[26] B. Liu, S. Duan, F. Liu, and P. Xu, ―Analysis and improvementofmaximumpowerpointtrackingalgorithm based on incremental conductance method for photovoltaic array,‖ in Proc. IEEE PEDS, 2007, pp. 637 641.
[27] Y. C. Kuo, T. J. Liang and J. F. Chen, ―Novel maximumpower pointtracking controller for photovoltaic energyconversionsystem,‖IEEETrans.Ind.Electron,vol. 48,no.3,pp.594 601,Jun.2001.