Volume: 09 Issue: 04 | Apr 2022 www.irjet.net
(IRJET)

e ISSN:2395 0056
ISSN:2395 0072

Volume: 09 Issue: 04 | Apr 2022 www.irjet.net
(IRJET)
e ISSN:2395 0056
ISSN:2395 0072
1PG Scholar, 2Professor and Head, 3Assistant Professor 1,2,3 Department of Mechanical Engineering, Vidyavardhaka College of Engineering Mysuru karnataka ***
Abstract:
Arrhythmia identification plays an important role in treating cardiovascular diseases. Electrocardiogram is used tostudytheheartbeatsclinically.ECGsignalsacquired may contain noise in them which misleads the identification of arrhythmia. In this work, an automatic signal denoising method using denoising autoencoders based on long short termmemorynamedLDAEisproposedtoremovethenoise fromsignals.ThecollectednoisyECGsignalsandprocessed clean signals are used to train the denoising model to reconstruct the input signals without noise. Then the reconstructed ECG signals are given as input to deep multilayer perceptron algorithm to identify different types ofarrhythmias.Rootmean square errorandsignal to noise ratioareusedtoevaluatetheperformanceofreconstructed signals. An average SNR and RMSE of 27.5 and 0.037, respectively was achieved. Results indicate that for MLP, accuracy, precision, recall, and F1 score obtained are 98%, 98.57%,97.25%,and97.45%,respectively.
Keywords: Arrythmia,denoising,electrocardiogram(ECG), classification, autoencoder, long short term memory, deep learning
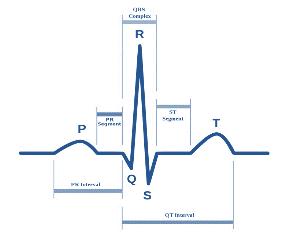
Numerous cardiovascular diseases (CVDs) are growing, especially after being infected with the COVID 19, becoming the leading cause of death globally, constituting around32%ofallglobaldeaths[1].Aspertheworldhealth organization (WHO), 7.5 million people are killed in 2015 due to CVDs, and most of the deaths occurred in underdeveloped counties [1] [5]. The best way to manage risk factors associated with these CVDs is to monitor the heart rhythms. The vital diagnostic tools used to monitor heart rhythms are tracing the heart's electrical activity known as electrocardiography (ECG) waveform. Tracing a typical ECG signal for each cardiac cycle generally consists of tracing P wave, a QRS complex, and a T wave representing atrial depolarization process, ventricular depolarization process, and ventricular repolarization, shown in Fig. 1. The remaining portions of the ECG signal include the ST, PR, and QT intervals. Abnormal cardiac rhythms known as arrhythmias occur due to a strange sequence of heart electrical impulses. These irregular sequences can be observed in ECG change in the waveform
sequence [6], [7]. Four general types of arrhythmia are supraventricular tachycardia, extra beats, bradyarrhythmia, and ventricular arrhythmias [8] [10]. The ECG signals of differentcardiacarrhythmiaconditionsareArrhythmiasmay occur in any heart chambers, atriums, and ventricles. This fatal CVD, Arrhythmia, may lead to sudden cardiac arrest, bradycardia, or tachycardia leading to death [1], [5]. Hence frequent monitoringofarrhythmiaplays a significantrolein CVDsdiagnosisandprevention.
The classification of arrhythmias based on ECG signals' varying and complex nature amid different subjects is time consuming and challenging [11]. The rapid advancement of deep learning algorithms and the wide availability of digital ECG data presents improvements in automated ECG classification. The neural network (NN) outperformed various applications and is more widely used in automated ECG classification. Research on automated ECG classification with NNs is presented in [12] [22]. Various classifying algorithms are proposed and implemented by researchers for the classification of ECG signals with high accuracy support medical professionals. Kiranyaz et al. [12] fused the classification process and feature extraction by implementing 1 D Convolutional neural networks (CNNs). This fusion resulted in better efficiency in both computation andspeed,whichcanbebeneficial.Byusingempirical mode decomposition(EMD)anddiscretewavelettransform(DWT) features and radial basis function neural network (NN) classifier,theaccuracyof99.88%wasreportedbyShaooSet al.[13]inclassifyingsixtypesofECGsignals.
Issue:
|
F Khalaf et al. [14] proposed an SVM classifier and a CAD system based on principal component analysis (PCA) using statistical features and spectral correlation. An accuracy of 98.61% in spectral correlation classifying five beat types is obtained. Geometry based features resulted in improved accuracy.Analgorithmwithanaverageaccuracyof95.91% for detecting shockable rhythms using the Support vector machine(SVM)model ispresentedbyMNguyen etal. [15] A powerful computerized system using a composite dictionary (CD) is introduced by M Raj et al. [16]. This CD consists of the sine, Stockwell, and cosine analytical functions to efficiently show ECG signals. This approach decomposed the ECG signal into non stationary and stationary components with a high detection accuracy of 99.23%. A novel three layer deep genetic ensemble of classifiers (DGEC) is proposed by Pławiak et al. [17] to detect 17 types of ECG arrhythmia using cardiac ECG signals. The proposed model obtained an accuracy of 99.38%. This DGEC model has a complex structure and requires features extraction compared with other deep learning models. Tuncer et al. [18] employed a novel hexadecimal ternary pattern method to detect heart arrhythmia. Seventeen types of ECG arrhythmia are classifiedusingmultilevelwaveletfeatureextraction,andan accuracyof95%onECGsignalisachieved.
A novel principal component analysis network (PCAN) system with a linear SVM method is proposed for classification by W Yang et al. [19]. The novel classifier systemidentifiedheartbeatswithanaccuracyof97.78%.M Rai et al. [20] presented a hybrid feature extraction technique using multiresolution DWT and multilayer probabilistic neural network (PNN) classifier in detecting only right bundle branch block (RBBB) and the left bundle branch block (LBBB) types of arrhythmias. The proposed systemshowed99.07%overallaccuracy.UsingtheMIT BIH arrhythmia database and employing nonlinear morphological features and a voting based scheme known as ICEEMED, Kandala R et al. [21] presented a method for feature extraction and classification of cardiac ECG signals differentclassesofcardiacarrhythmia.Theproposedmodel achieved a classification accuracy of 100.00% and 90.40% on unknown and fusion classes. However, the performance ofafewheartbeatslikeanaberratedatrial,atrialpremature contraction, junctional premature beats class, and supraventricular is still low compared to the other classes where the improvements are to be done. A novel deep genetic ensemble of classifiers (DGEC) with a three layer is designed by Pławiak et al. [22] to detect heart arrhythmia using ECG signals. The developed model obtained an accuracy of 99.38% with classification in detecting seventeen types of ECG arrhythmia. The disadvantages of this DGEC model are its complex structure and require features extraction compared to the other deep learning models.
Most of the studies from the existing literature needs prior domain knowledge and are mathematically extensive. Such methods depend on the parametric inputs
given by the user and are prone to errors. A well developed automatic noise reduction method can overcome these limitations. Thus, the novelty of the work is to develop an automatic signal denoising method using denoising autoencoders (DAE) based on long short term memory (LSTM) named LDAE to remove the noise from the ECG signals. First, the collected noisy ECG signals and processed clean signals are used to train the denoising model. Upon training, the proposed denoising model will be able to reconstruct the input signals without noise. Then the reconstructed ECG signals are given as input to the deep learningclassificationalgorithmtoidentifydifferenttypesof arrhythmia. Finally, the denoising and classification performancesarereported.
In this work, a methodology is proposed to denoise thenoisyECGsignalsandclassifythenormalandarrhythmic ECGsignals.TheECGsignalsareacquiredfromdifferentage groups using 12 leads. A public data set from Chapman university and Shaoxing hospital [23] is used in this work. The ECG recording are obtained from 10,646 subjects, of which55.95%males,from4to98agegroups.TheECGsare recorded for 10 seconds at 500 Hz sampling rate using 12 leadswith32 bit resolution overa 4.88mVrange.EachECG signal consists of 5000 samples. The acquired 12 dimension ECGs features 11 cardiovascular rhythms. Two licenced physicians independently annotate the datasets to make them more reliable for data driven studies. The 11 cardiovascular rhythms in the dataset are: atrial fibrillation (AFN), atrial flutter (AFT), atrial tachycardia (ATA), atrioventricular reentrant tachycardia (ART), atrioventricular node reentrant tachycardia (ANRT), sinus bradycardia (SBA), sinus irregularity (SIY), sinus rhythm (SRM), Sinus Tachycardia (STA), supraventricular tachycardia (ST), and sinus atrium to atrial wandering rhythm (SAAW). Since the dataset contains rare rhythms withlessdata[23],the11rhythmsaremergedinto4groups according to the guidelines [24] [26]. Table 1 gives the detailsofthemergedgroups.Butterworthlowpassfilterare usedinthisdatasettoobtaincleanECGsignals.
1. Detailsofmergeddata.
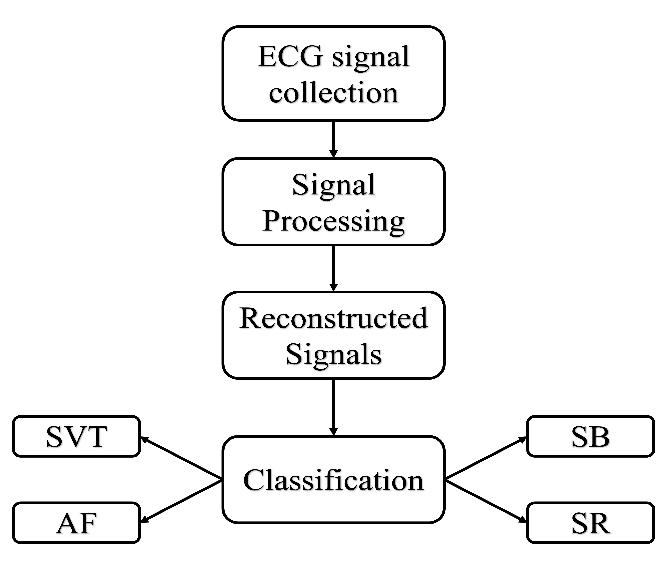
A signal denoising method using denoising autoencoders (DAE)isproposedtoremovethenoisefromtheECGsignals. First, the collected noisy ECG signals and processed clean signalsareusedtotrainthe denoisingmodel.Upontraining, theproposeddenoisingmodelwillbeabletoreconstructthe input signals without noise. The reconstructed ECG signals are given as input to the deep learning classification
ISSN:2395
algorithm to identify different types of arrhythmia. Fig. 2 representstheproposedmethodology.Thedetailedprocess ofsignaldenoisingisexplainedinthenextsection.
Fig. 2. Proposedmethodologyblockdiagram
The ECG signals acquired may contain noise due to noise sources like muscle contraction, electrode contact noise, baseline wandering, power interference, motion artifacts, and random noise. Noise in the signals lead to misclassification due to presence of unwanted peaks in the signals. In this work, a signal denoising method using denoising autoencoder based on long short term memory (LSTM) named LDAE is proposed. LDAE takes the corrupt signalasinputandgivesdenoisedsignalsasoutput. During training, both clean ECG signals and corrupted ECG signals are given as input to the LDAE. The clean ECG signals are generated using Butterwoth filtering with local polynomial regression smoother and non local means, detailed by Zheng et al. [23]. An autoencoder is an unsupervised artificial neural network model that consists of input layer, encoder,anddecoder layers.ECGsignalsare givenas input to the input layer. The encoder codes the inputs and at the sametimethedecoderlearnsthefeaturesfromtheencoded inputsandfurtherreconstructsthegivenoriginalinput.Fig. 3.givesthestructureofLDAEproposedinthiswork.
LDAE proposed in this work effectively learns the ECG time series characteristics and denoises the signals. LDAEconsists of inputlayer,encoder,anddecoder layersas shown in Fig. 3. The encoder consists of five layers of LSTM networks. The first LSTM layer is the input ECG signal transformation tensor with 1024 as the dimension of the hiddenlayer.ThedimensionofsecondLSTMlayerwassetto 512 and it is the transformation tensor of first LSTM layer output.Outputfromthesecondlayerisgivenasinputtothe thirdLSTMlayerandthirdlayers’outputisgivenasinputto the fourth LSTM layer. Each LSTM layer is a transformation tensor of output from its pervious layer and this process continuous till the fifth LSTM layer in the encoder. The dimensionsofthethird,fourth,andfifthLSTMlayersareset to 256, 128, and 64, respectively. An activation function is defined at each stage to sequentially process the input ECG signals.Thehiddenlayersreducethedimensionofthe input ECG signal data by compressing it and by extracting hidden time seriesfeaturesthroughLSTMnetwork.Thecompressed data from the fifth LSTM layer of the encoder is passed throughgatewayandisgivenasinputtothedecoder.
Table 2.DetailsofeachlayerofLDAE.
1 LSTM Tanh 1024
2 LSTM Tanh 512
3 LSTM Tanh 256
4 LSTM Tanh 128
5 LSTM Tanh 64 Decoder
6 LSTM Tanh 64
7 LSTM Tanh 128
8 LSTM Tanh 256
9 LSTM Tanh 512
10 LSTM Tanh 1024
11 Linear Tanh 1024*5000
The decoder part of LDAE contains six layers with five LSTM layers and a linear layer that are connected step by stepwitheachother.ThefiveLSTMlayersinthedecoder are the transformation tensors of their pervious layers and the sixth layer is a conversion tensor of the output from the fifth LSTM layer. The encoded data is decompressed in the decoder using LSTM layers and the linear layer transforms theoutputfromthefifthLSTMlayerintostandardECGsignal data.ThedetailsofthedifferentlayersintheLDAEaregiven in Table 2. As ECG signal consists of times series data, a single group of ECG data sequence with size of 1*5000 was givenasinputtotheLDAE.TheLSTMlayers,1 5,compresses the input data from 1*5000 to 1*64 and extracts and learns time series features from the data. Reconstruction of the compressed data to original size of 1*5000 is done using layers 6 11. The output of the LDAE is a denoised signal of the input ECG signal. The model parameters are updated using back propagation to reduce the error between input dataandexpandeddata.
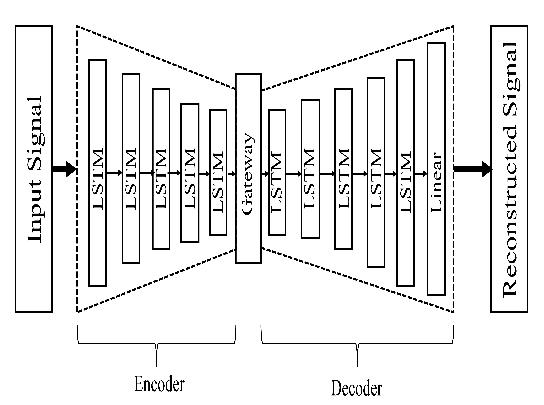
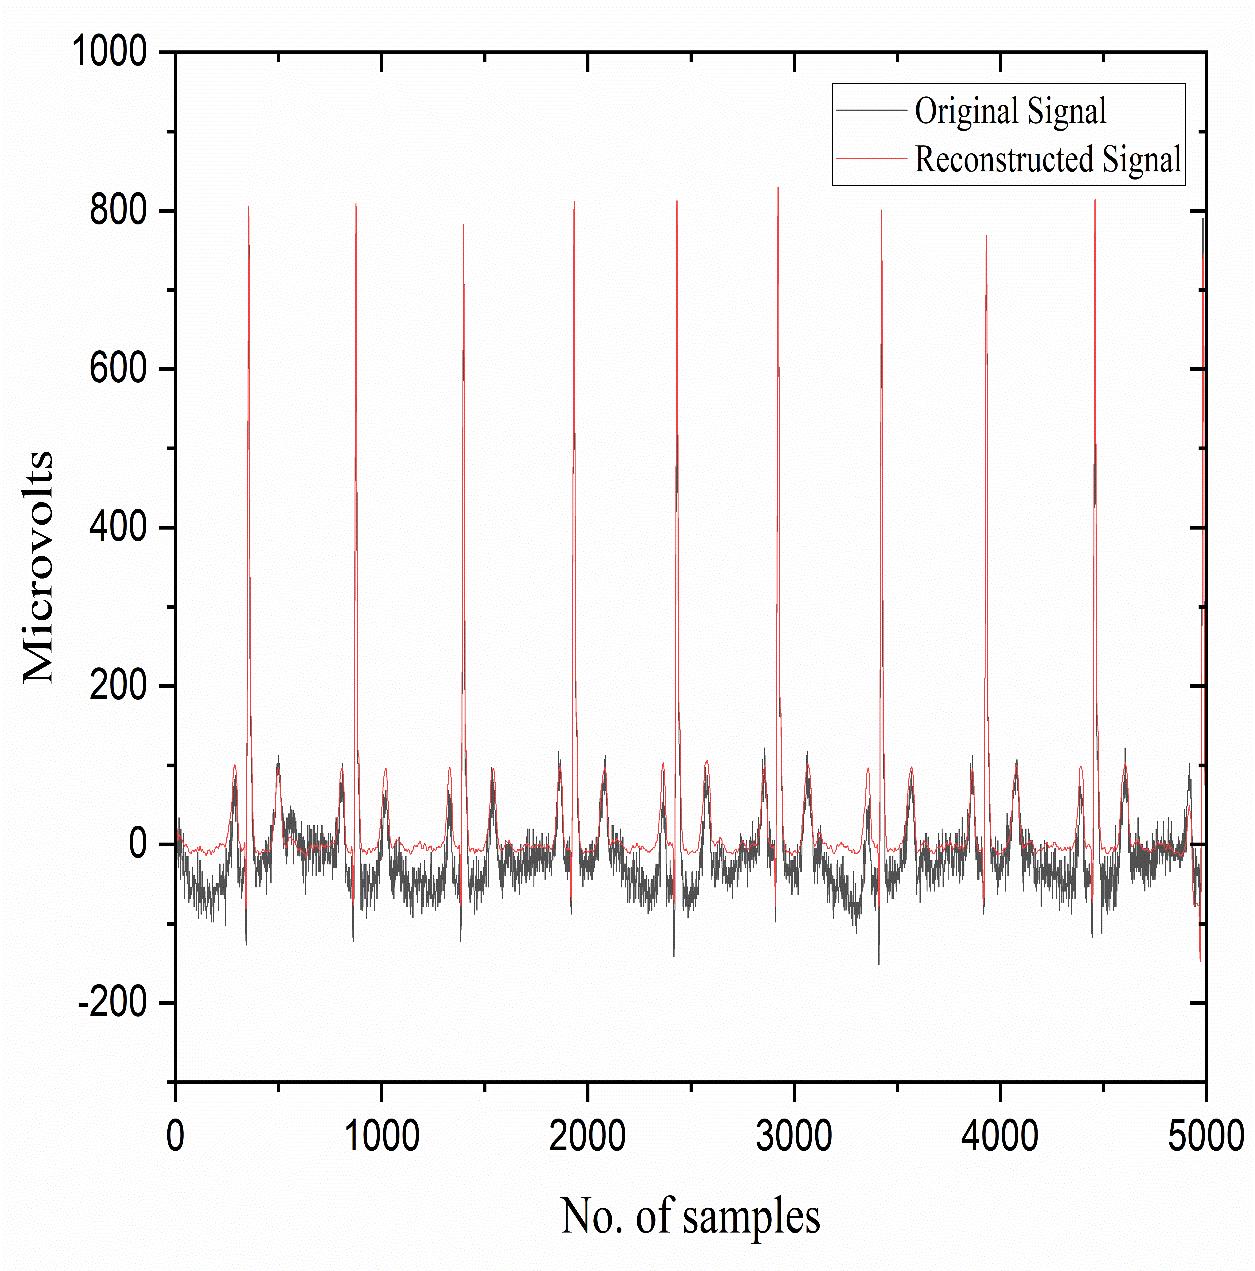
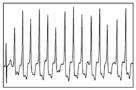
Fig. 4. ReconstructedsignalforECGwithhighandlow frequencynoiserecordno.100
decompression of the signal is given by SNR, Eq. 2, and is measured in decibels (dB). SNR greater than 1 represents more signal than noise. A higher value of SNR represents goodsignalquality.
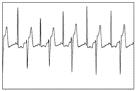
Fig. 5. ReconstructedsignalforECGwithbaseline wanderingrecordno.2000
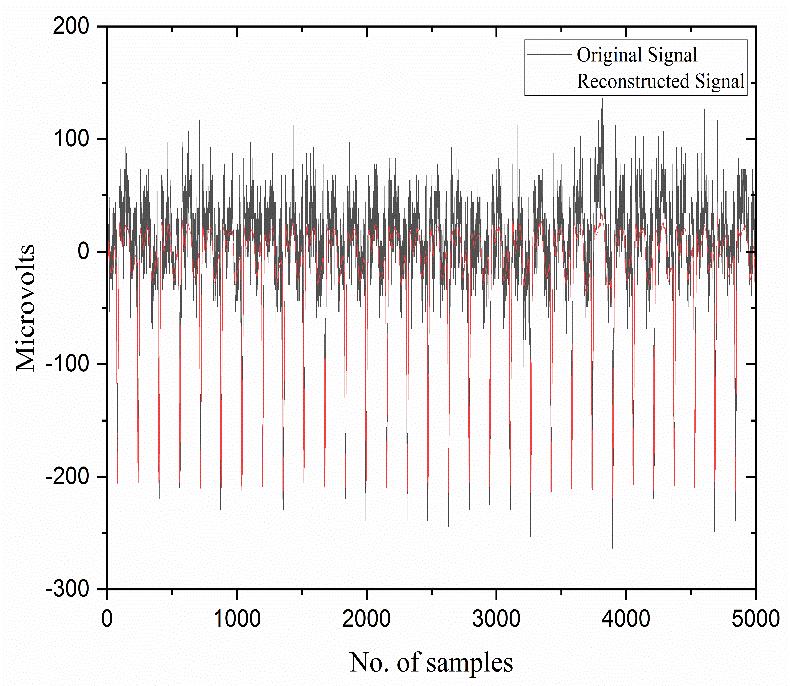
Thedenoising isperformed on10,646ECGrecords usingLDAEtogetthereconstructednoise freesignals.Asa representation,thereconstructedsignalsfortheECGrecord no. 100 and 2000 are shown in Fig. 4 and Fig. 5, respectively. ECG record no. 100 consists of both low and high frequency noise which is processed using LDAE to get thedenoisedsignal,Fig.4. Baselinewanderingisthesource of noise for ECG record no. 2000. The denoising performance of the proposed LDAE is evaluated using widely used performance metrics, root mean square error (RMSE)andsignaltonoiseratio(SNR)[27] [29].TheRMSE givesthevariancebetweenthemodeloutputandtheactual output, given by Eq. 1. A smaller value of RMSE represents better performance of the model. The amount of noise energy in the signal introduced due to compression and
where and represents the original signal and reconstructedsignalrespectively,and givesthemeanvalue oftheoriginalsignal.TheSNRandRMSEvaluesfordifferent ECG record numbers are given in Table 3. Later, these denoisedsignalsareusedtoclassifytheheartbeatconditions using deep learning algorithm that is discussed in the next section.
ECG record no. RMSE SNR (dB)
100 0.023 27.67
1000 0.036 22.31
2000 0.021 27.73
3000 0.029 26.54
6000 0.052 20.89
8000 0.047 21.07
10000 0.033 23.27
The reconstructed signals by LDAE through processingtherawECGsignalsareusedtoclassifythetypes of arrhythmia using a deep multilayer perceptron (MLP). MLPisanunsuperviseddeeplearningalgorithmandisafeed forward type of artificial neural networks (ANN). It has interconnected neurons that transfers information among eachother.MLPconsistsofaninputlayer,hiddenlayers,and outputlayer.Fig.6showsthearchitectureoftheMLPusedin thiswork.MLPproposedinthisworkconsistsoffourhidden layers. Each hidden layer has a fully connected layer with 100 nodes. Batch normalization is introduced in the first hidden layer of the MLP. Rectified linear activation unit (ReLu) is used as the activation function in each of the hidden layer. Hyperparameter tuning is the selection of optimal hyperparameters whose value controls the learning process.Itminimizesapredefinedlossfunctiontogivebetter results. The wrapper is used to connect the scikit learn python library to Keras for hyperparameters tuning, and GridSearchCV (10 fold cross validation) is used to find different hyperparameters. Dropout is a regularization technique of MLP to avoid overfitting, thus generalizing the model. Model is likely to result in better performance when dropout is used on a larger network, allowing the model to learn independently. Table 4 gives the values of the hyperparameters.
Arrhythmia classification is performed using the reconstructed signals obtained from the previous section using MLP algorithm. The classification algorithm is trained using80%data,andthe remaining20%isusedastest data. Training data (80%) is further divided into training and validation datasets, and the remaining 20% data is test data used to evaluate the performance of the trained model. The details of the dataset are given in Table 5. In the training process, k fold cross validation is used, so that model is trainedondifferentsubsetsoftraindata,resultinginamore generalized model further minimizing the chances of overfitting. In the present study, 10 fold cross validation is used on the data sets. In the MLP model, four hidden layers are present in between the input and output layers. Before trainingthemodel,GridSearchCVisusedtofindtheoptimum hyperparameters on the training data set. During training, the model is evaluated on a validation dataset after each epoch. If the performance of the model on the validation dataset starts to degrade (e.g., loss begins to increase or accuracy begins to decrease), then the training process is terminated at that point. Accuracy, precision, recall, and F1 score are used to evaluate the classification performance. Thehigherthevaluesofthesemetrics,thehigherwillbethe fault classification performance. For MLP, accuracy, precision, recall, and F1 score obtained are 98%, 98.57%, 97.25%, and 97.45%, respectively. Confusion matrix for the MLP that shows the classification accuracy among different classesisshowninTable6.
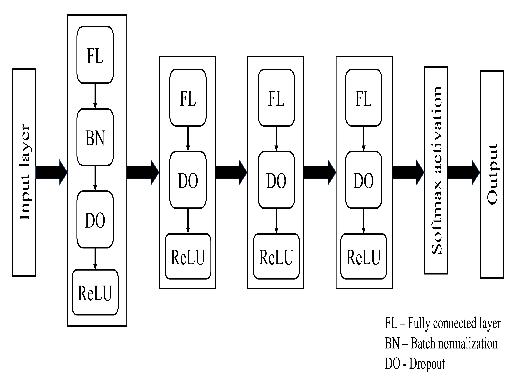
Table 6.ConfusionmatrixforMLP.
AF SB SR SVT
AF 10433 213 426 746
SB 107 10008 532 638
SR 0 105 9156 532
SVT 106 320 532 8730
Arrhythmia identification plays animportant rolein treating CVDs. ECG signals acquired may contain noise in themwhichmisleadstheidentificationofarrhythmia.Inthis work,anautomaticsignaldenoisingmethodusingdenoising autoencoders (DAE) based on long short term memory (LSTM) named LDAE is proposed to remove the noise from the ECG signals. First, the collected noisy ECG signals and processed clean signals are used to train the denoising model. Upon training, the proposed denoising model will be abletoreconstructtheinputsignalswithoutnoise.Thenthe reconstructed ECG signals are given as input to deep multilayer perceptron (MLP) algorithm to identify different types of arrhythmia. Root mean square error (RMSE) and signal to noise ratio (SNR) are used to evaluate the performance of the reconstructed signals. Reconstructed signalsshowedanaverageSNRandRMSEof27.5and0.037, respectively. Results indicate that for MLP, accuracy,
Volume: 09 Issue: 04 | Apr 2022 www.irjet.net
precision, recall, and F1 score obtained are 98%, 98.57%, 97.25%,and97.45%,respectively.
[1] S. Y. Lee et al., “Influence of EDTA in poly(acrylic acid) binder for enhancing electrochemical performance and thermal stability of silicon anode,” Appl. Surf. Sci., vol. 447, pp. 442 451, Jul. 2018, doi: 10.1016/J.APSUSC.2018.04.004.
[2] S.Yusuf et al.,“CardiovascularRiskandEventsin17 Low , Middle , and High Income Countries,” N. Engl. J. Med., vol. 371, no. 9, pp. 818 827, Aug. 2014, doi: 10.1056/NEJMoa1311890.
[3] R. Gupta, I. Mohan, and J. Narula, “Trends in CoronaryHeartDiseaseEpidemiologyinIndia,” Ann. Glob. Heal., vol. 82, no. 2, pp. 307 315, Mar. 2016, doi:10.1016/J.AOGH.2016.04.002/METRICS/.
[4] D. Prabhakaran, P. Jeemon, and A. Roy, “Cardiovascular Diseases in India,” Circulation, vol. 133, no. 16, pp. 1605 1620, Apr. 2016, doi: 10.1161/CIRCULATIONAHA.114.008729.
[5]
“Cardiovascular diseases (CVDs).” https://www.who.int/en/news room/fact sheets/detail/cardiovascular diseases (cvds) (accessedMar.08,2022).
[6] C. Van Mieghem, M. Sabbe, and D. Knockaert, “The Clinical Value of the ECG in Noncardiac Conditions,” Chest,vol.125,no.4,pp.1561 1576,Apr.2004,doi: 10.1378/CHEST.125.4.1561.
[7] T. Tse, M. Esposito, and K. Soufani, “Fast Expanding Markets: The Revolution of the Microeconomy,” Thunderbird Int. Bus. Rev., vol. 58, no. 1, pp. 5 11, Jan.2016,doi:https://doi.org/10.1002/tie.21738.
[8] C. A. Martin, G. D. K. Matthews, and C. L. H. Huang, “Suddencardiacdeathandinheritedchannelopathy: the basic electrophysiology of the myocyte and myocardium in ion channel disease,” Heart, vol. 98, no. 7, pp. 536 LP 543, Apr. 2012, doi: 10.1136/heartjnl 2011 300953.
[9] U.RajendraAcharya,J.S.Suri,J.A.E.Spaan,andS.M. Krishnan, “Advances in cardiac signal processing,” Adv. Card. Signal Process., pp. 1 468, 2007, doi: 10.1007/978 3 540 36675 1.
[10] D. Da Costa, W. J. Brady, and J. Edhouse, “Bradycardias and atrioventricular conduction block,” BMJ, vol. 324, no. 7336, pp. 535 538, Mar. 2002,doi:10.1136/BMJ.324.7336.535.
[11] W. Sun, N. Zeng, and Y. He, “Morphological Arrhythmia Automated Diagnosis Method Using
ISSN:2395
ISSN:2395 0072
Gray Level Co Occurrence Matrix Enhanced Convolutional Neural Network,” IEEE Access, vol. 7, pp. 67123 67129, 2019, doi: 10.1109/ACCESS.2019.2918361.
[12] S. Kiranyaz, T. Ince, and M. Gabbouj, “Real Time Patient Specific ECG Classification by 1 D ConvolutionalNeuralNetworks,” IEEE Trans. Biomed. Eng., vol. 63, no. 3, pp. 664 675, Mar. 2016, doi: 10.1109/TBME.2015.2468589.
[13] S.Sahoo,M.Mohanty,S.Behera,andS.K.Sabut,“ECG beat classification using empirical mode decomposition and mixture of features,” http://dx.doi.org/10.1080/03091902.2017.1394386, vol. 41, no. 8, pp. 652 661, Nov. 2017, doi: 10.1080/03091902.2017.1394386.
[14] A. F. Khalaf, M. I. Owis, and I. A. Yassine, “A novel technique for cardiac arrhythmia classification using spectral correlation and support vector machines,” Expert Syst. Appl.,vol.42,no.21,pp.8361 8368,Nov. 2015,doi:10.1016/J.ESWA.2015.06.046.
[15] M.T.Nguyen,A.Shahzad,B.VanNguyen,andK.Kim, “Diagnosis of shockable rhythms for automated external defibrillatorsusing a reliablesupportvector machine classifier,” Biomed. Signal Process. Control, vol. 44, pp. 258 269, Jul. 2018, doi: 10.1016/J.BSPC.2018.03.014.
[16] S. Raj and K. C. Ray, “Automated recognition of cardiacarrhythmiasusingsparsedecompositionover composite dictionary,” Comput. Methods Programs Biomed., vol. 165, pp. 175 186, Oct. 2018, doi: 10.1016/J.CMPB.2018.08.008.
[17] P. Pławiak and U. R. Acharya, “Novel deep genetic ensembleofclassifiersforarrhythmiadetectionusing ECGsignals,” Neural Comput. Appl.,vol.32,no.15,pp. 11137 11161, Aug. 2020, doi: 10.1007/S00521 018 03980 2/TABLES/8.
[18] T. Tuncer, S. Dogan, P. Pławiak, and U. Rajendra Acharya, “Automated arrhythmia detection using novel hexadecimal local pattern and multilevel wavelet transform with ECG signals,” Knowledge Based Syst., vol. 186, p. 104923, Dec. 2019, doi: 10.1016/J.KNOSYS.2019.104923.
[19] W. Yang, Y. Si, D. Wang, and B. Guo, “Automatic recognition of arrhythmia based on principal component analysis network and linear support vector machine,” Comput. Biol. Med.,vol.101,pp.22 32, Oct. 2018, doi: 10.1016/J.COMPBIOMED.2018.08.003.
[20] S. Raj, K. C. Ray,and O. Shankar, “Cardiac arrhythmia beat classification using DOST and PSO tuned SVM,” Comput. Methods Programs Biomed., vol. 136, pp.
9001:2008
Volume: 09 Issue: 04 | Apr 2022 www.irjet.net
163 177, Nov. 2016, doi: 10.1016/J.CMPB.2016.08.016.
[21] R. N. Kandala et al., “Towards Real Time Heartbeat Classification: Evaluation of Nonlinear MorphologicalFeaturesandVotingMethod,” Sensors ,vol.19,no.23.2019,doi:10.3390/s19235079.
[22] P. Pławiak, “Novel genetic ensembles of classifiers applied to myocardium dysfunction recognition basedonECGsignals,” Swarm Evol. Comput.,vol.39, pp. 192 208, Apr. 2018, doi: 10.1016/J.SWEVO.2017.10.002.
[23] J. Zheng, J. Zhang, S. Danioko, H. Yao, H. Guo, and C. Rakovski,“A12 leadelectrocardiogramdatabasefor arrhythmia research covering more than 10,000 patients,” Sci. Data, vol. 7, no. 1, Dec. 2020, doi: 10.1038/S41597 020 0386 X.
[24] C. T. January et al., “2014 AHA/ACC/HRS Guideline fortheManagement of Patients WithAtrial Fibrillation: A Report of the American College of Cardiology/American Heart Association Task Force on Practice Guidelines and the Heart Rhythm Society,” J. Am. Coll. Cardiol., vol. 64, no. 21, pp. e1 e76,Dec.2014,doi:10.1016/J.JACC.2014.03.022.
[25] R. L. Page et al., “2015 ACC/AHA/HRS Guideline for the Management of Adult Patients With Supraventricular Tachycardia: A Report of the American College of Cardiology/American Heart Association Task Force on Clinical Practice GuidelinesandtheHeartRhythmSociety,” J. Am. Coll. Cardiol.,vol.67,no.13,pp.e27 e115,Apr.2016,doi: 10.1016/J.JACC.2015.08.856.
[26] “Corrigendum to: 2016 ESC Guidelines for the management of atrial fibrillation developed in collaboration with EACTS,” Eur. Heart J., vol. 39, no. 13, p. 1109, Apr. 2018, doi: 10.1093/eurheartj/ehx039.
[27] P.Xiong,H.Wang,M.Liu,S.Zhou,Z.Hou,andX.Liu, “ECG signal enhancement based on improved denoising auto encoder,” Eng. Appl. Artif. Intell., vol. 52, pp. 194 202, Jun. 2016, doi: 10.1016/J.ENGAPPAI.2016.02.015.
[28] H.T.Chiang,Y.Y.Hsieh,S.W.Fu,K.H.Hung,Y.Tsao, and S. Y. Chien, “Noise Reduction in ECG Signals Using Fully Convolutional Denoising Autoencoders,” IEEE Access, vol. 7, pp. 60806 60813, 2019, doi: 10.1109/ACCESS.2019.2912036.
[29] E. Dasan and I. Panneerselvam, “A novel dimensionality reduction approach for ECG signal via convolutional denoising autoencoder with LSTM,” Biomed. Signal Process. Control, vol. 63, p. 102225, Jan. 2021, doi:
10.1016/J.BSPC.2020.102225.
ISSN:2395 0056
ISSN:2395 0072
© 2022, IRJET | Impact Factor value: 7.529 | ISO 9001:2008 Certified Journal