1. INTRODUCTION
Remote sensing (RS) and GIS are recognized as primarilyessentialandpowerfultoolsindetermining LULC changes at various spatial scales (Dewan & Corner, 2013). Land Use and Land Cover change detection has become a fundamentally important componenttounderstandtheextentofurbanizationin rapidlygrowingcities.LULCgeneratedinformationis utilizedbyresearchers,cityprofessionalsandplanners todeterminechangesinnaturalresourcesandevaluate thegrowthpatterns(Adeel,2010) It has been recognized that the growth and development of larger cities and its interaction with the neighboring areas is influenced by economic development, the intensity of trade growth, and motivationonthepartoftheadministrationaimedat bringing about development of the cities (Tabuchi, 2013). Nevertheless, Panvel tahsil, located on the periphery of Mumbai Metropolitan Region has been extensivelyinfluencedbythegrowthanddevelopment of its surrounding urabn areas The integration of Mumbai and its surrounding region into the global economy, is bringing radical changes in the socioeconomicandenvironmentsofthissurrounding region (Phadke, 2013). Such areas that are in proximity to the urban as well rural centres act as transitionaleconomicandsocialspaceswherechanges in the landuse result inseveral otherdynamics that resultin transition to a great extent (Varkey, 2019)
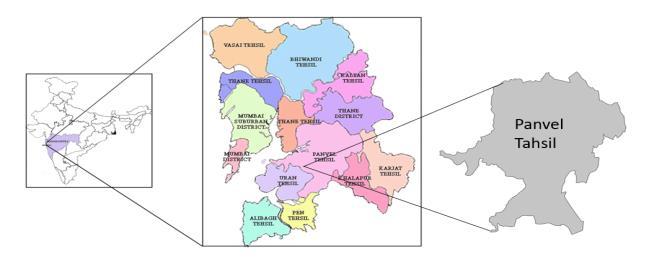
Fig 1: Location of Panvel Tahsil in context to MMR, Maharashtra.
International Research Journal of Engineering and Technology (IRJET) e ISSN: 2395 0056 Volume: 0 Issue: 0 | Jan 2022 www.irjet.net p ISSN: 2395 0072 © 2021, IRJET | Impact Factor value: 7.529 | ISO 9001:2008 Certified Journal | Page239 Analysis of Land Use Land Cover Change and Relative Growth in Social Amenities: Panvel Tahsil, Maharashtra Aradhana Tripathy1, Amruta Gandhi2 1Department of Architecture and Regional Planning, IIT Kharagpur 2Urban Planner, College of Engineering Pune *** Abstract - Panvelisafast growinglocalityadjacentto Navi Mumbai, and a growth hub in the Mumbai Metropolitan Region. Due to its proximity to Mumbai and Navi Mumbai, it is one of the few urban areas of Raigad district, and attracts migrants due to work opportunities and low cost of living, which has led to incredibly high speed to urbanization post 2000s. Through a series of land use and mapping studies utilizing aerial imagery and historical maps, this study aims to understand the pattern of Panvel’s rapid urbanization over the last 30 years, while also comparing the rate of growth of its social amenities, to compare the lag or the delay with which urban amenities are provided in rapidly growingcities. Lastly, the actual mapped amenities are compared with the relevant census populations and the recommended betweenonURDPFIstandardstounderstandthedegreeofpressureamenitiesduetothisurbanization,andthegaprecommendedstandardsandreallifecases.
2. STUDY AREA
PanveltahsilisapartofRaigaddistrictfallingwithin the peripheral limits of the Mumbai Metropolitan Region.Itluesapproximately30kmstothesoutheastof centralMumbai. LocatedtothesouthofThaneDistrict, PanvelTahsilissurroundedbyUranTahsilontheeast, Pen Tahsil on the south and Khalapur Tahsil on the west. Panvel City located in the tahsil is the first MunicipalCorporationofRaigaddistrict.Thetahsilhas close proximity to Mumbai as well Pune district. Accordingtothecensusreportof2011,PanvelTahsil hasrecordedhighestgrowthrateintheurbanareasof thedistrict.MMRRegionalPlan2036hasrecognized theareaaroundPanvelasanemerginggrowthcentre.
Keywords: Urbanization, Panvel, Urban amenities, Planning standards, social amenities
Themainobjectiveofthepaperistoidentifytheextent to which the changes in land use land cover have affectedthedevelopmentofsocialinfrastructureinthe selectedstudyarea.

7 3
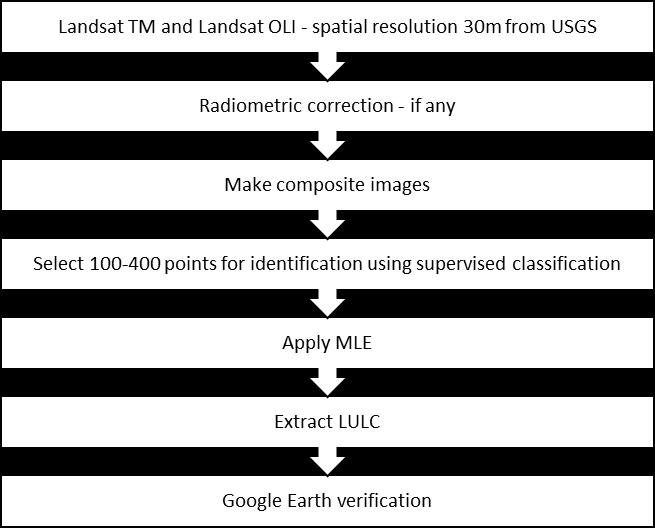
For analyzing land use land cover change, Landsat imageryhasbeenacquiredfromtheUSGSportal.After undergoingtherequiredcorrectionsandreferencing, theimageswereanalyzedand100 400identification pointswereselectedperlandusecategoryperdecade. Using MLE classification, the images were classified, andtheextractedimagewasverifiedusinghistorical GoogleEarthimageryandcensusmaps METHODOLOGY
Fig 2: Methodology
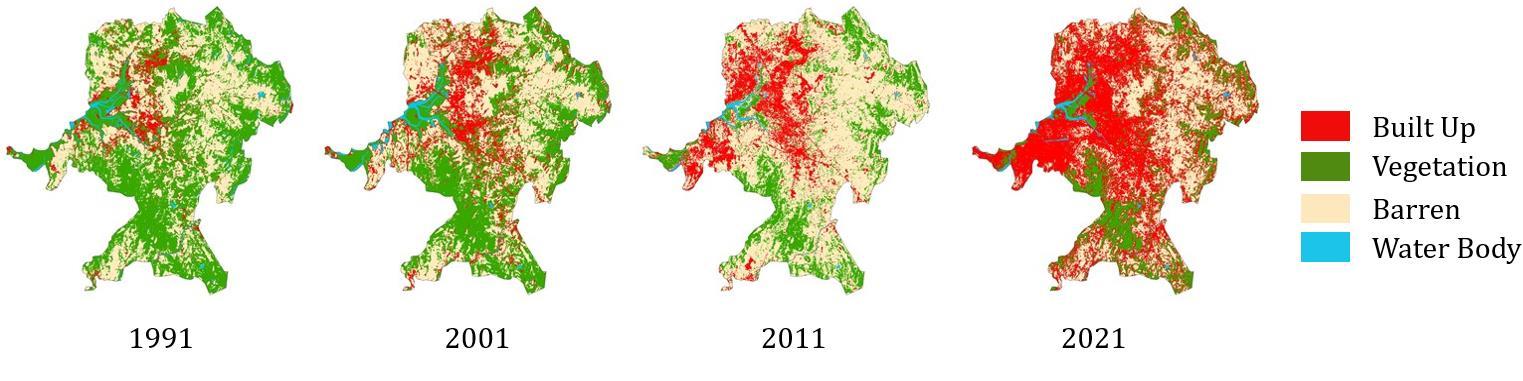
Theclassificationasseenfromthemapsindicatethat mostoftheareaundervegetationcoverhaschangedto barren land over the years. Thus, the percentage of barren land has increased over the period of three decades. The area under barren land has increased from251.65sq.kmsto378.08sq.kmsfrom1991to 2011.Thereisdecreaseintheareaunderbarrenland from2011(378.08sq.kms)to2021(208.95sq.kms). Thetrendintheclassificationmapindicatesthatthe barrenlandisfurtherbeingconvertedtobuiltuparea inthetahsil.Thelanduselandcoveranalysissuggests thatthetahsilisundergoingrapidurbangrowth.
CHANGE DETECTION
Theresultsfromtheclassificationsuggestthatthereis changeinthepatternoflanduseoverthefourdecades.
using
Table
ThetotalareaunderPanvelTahsilis642.90sq.kms.A significant increase in the built up land is seen from 1991to2021.Theyear2001and2021haveseenmore increaseinthebuilt uppercentage. Areaunderbuilt uplandhasincreasedfrom44.18sq.kmsto105.76sq. kms in 2001 and 117.01 sq. kms to 311.03 sq. kms respectively,coveringupto48.46%ofthetotalarea. Thisincreasingtrendinthebuiltupisindicativeofthe rapid urban growth occurring in areas under Panvel tahsil.Theareaunderwaterbodyhasshownagradual decreaseoveraspanofthesefourdecadeswithatotal decreaseintheareaunderwaterbodyby45.36%
ThetablebelowindicateslandusechangesinPanvel Tahsilfrom1991to2021.
type 1 1991 5 2
Imagery 4. LAND
To assess the pattern of LULC change, Landsat 05 imageof1991,Landsat07imageof2001and2011and Landsat08imageof2021wasusedfromUSGSportal. Theselectionofthelandsatimageswasbasedonthe image quality considering low cloud cover Different band combinations were used to proceed with the imageclassificationofLandsatimagery. 1: Land Sat Imagery acquired and analyzed as per decade S. No. Year Landsat 2001 2011 4 2021 8+OLI After undergoing the required corrections and referencing, the images were analyzed and 100 400 identification points were selected per land use categoryperdecade.Inordertofacilitatethechangein land use land cover of the study area, supervised classification(MaximumLikelihoodClassification)was conductedinArcGIS.Fourclassesviz.BuiltUp,Water Body,Vegetation(includesdensevegetationlikeforest cover,sparselyvegetatedareas,agriculturearea)and Barrenlandwereused. of LULC extraction Landsat USE LAND COVER
International Research Journal of Engineering and Technology (IRJET) e ISSN: 2395 0056 Volume: 08 Issue: 05 | May 2021 www.irjet.net p ISSN: 2395 0072 © 2021, IRJET | Impact Factor value: 7.529 | ISO 9001:2008 Certified Journal | Page240
3.
5
Theareaundervegetationhasalsoreducedfrom1991 to 2021.The areaundervegetationinthe year 1991 was331.31sq.kmscomprisingof51.5%ofthetahsil area which has further decreased to 113.50 sq. kms accountingto17.655oflandarea.Hence,itisinferred that the area under agriculture in the tahsil has also subsequentlyreduced.
International Research Journal of Engineering and Technology (IRJET) e ISSN: 2395 0056 Volume: 08 Issue: 05 | May 2021 www.irjet.net p ISSN: 2395 0072 © 2021, IRJET | Impact Factor value: 7.529 | ISO 9001:2008 Certified Journal | Page241 Fig -3:MapsindicatingLULCChangeinPanvelTahsil Table 2: LandUseLandCoverChangeDetection 5. PROVISION OF SOCIAL AMENITIES Civicandsocialamenitiesandfacilitiesprovidedtothe citizens at taxpayer’s cost. These encompass educational, medical, communication facilities and more.IntheIndianscenario,URDPFIguidelineslists down the hierarchy of social infrastructure developmentinAppendixNofVolumeof2ofURDPFI Guidelines2014. For thepurposeofthisstudy, the givenstandardsof education, medical and communication facilities like Post and Telegraph office and banks are compared withtherecordednumbersofsocialinfrastructureas extracted from District Census Handbook records of PanvelC.D.Block,Raigaddistrict.Intotal,withinthe three main categories, there are a total of 14 subcategories, dependent on available information fromvariousgovernmentrelatedsecondarysources. Table 3: URDPFIrecommendedvaluesofamenitiesforagivenpopulationofCDBlock URDPFI social amenity 1991 2001 2011 2021 Population 172217 218186 252477 304764 Recommendedvalues 1per EDUCATION 1 Primaryschool 5000 34 44 50 61 2 SeniorSecondarySchool 10000 17 22 25 30 3 Bank 15000 11 15 17 20 4 Dispensary 15000 11 15 17 20 5 College 100000 2 2 3 3 Land Use CoverLand Year 1991 2001 2011 2021 Areakm)(sq. % Areakm)(sq. % Areakm)(sq. % Areakm)(sq. % BuiltUp 44.18 6.87% 105.76 16.45% 117.01 18.20% 311.03 48.46% WaterBody 15.76 2.45% 12.09 1.88% 7.14 1.11% 8.61 1.34% Vegetation 331.31 51.53% 258.96 40.28% 140.67 21.88% 113.30 17.65% Barren 251.65 39.14% 266.09 41.39% 378.08 58.81% 208.95 32.55%
International Research Journal of Engineering and Technology (IRJET) e ISSN: 2395 0056 Volume: 08 Issue: 05 | May 2021 www.irjet.net p ISSN: 2395 0072 © 2021, IRJET | Impact Factor value: 7.529 | ISO 9001:2008 Certified Journal | Page242 6 Nursinghome/polyclinic 100000 2 2 3 3 7 Hospital 100000 2 2 3 3 8 college/TechnicalEngineeringcollege 1000000 0 0 0 0 MEDICAL 9 Dispensary 10000 17 22 25 30 10 Childandmaternity welfare 100000 2 2 3 3 11 Polyclinic 100000 2 2 3 3 12 IntermediateHospital 100000 2 2 3 3 13 Multi specialtyHospital 100000 2 2 3 3 14 Familywelfarecenter 50000 3 4 5 6 15 Diagnosticcenter 50000 3 4 5 6 COMMUNICATION 16 Subpostoffice 10000 17 22 25 30 17 Bank 10000 17 22 25 30 18 Telegraphbooking counter 100000 2 2 3 3 19 Postoffice 250000 1 1 1 1 ThevaluesofpopulationaretakenfromtheDistrict CensusHandbooksandthepopulationof2021is estimatedbasedonpreviousyears’growthrates. Forcomparingyear wisedataofavailablestatistics fromtheDHCB. Table 4: Comparisonofsocialamenities recommendedvsrealvaluestoshowdeficitinfactors 1991 2001 2011 S.no. Amenity recommenURDPFIdation ValueReal recomURDPFImendation ValueReal Growth% endationrecommURDPFI ValueReal Growth% Education 1 PrimarySchool 34 139 44 179 28.78 50 288 60.89 2 MiddleSchool NA 15 NA 55 266.67 NA 113 105.45 3 SecondarySchool NA 11 NA 21 90.91 NA 49 133.33 4 S.SecondarySchool 17 1 22 5 400 25 22 340 Medical facilities 5 PHC 2 0 2 5 500 3 5 0 6 Primarysubcenterhealth NA 4 NA 22 450 NA 26 18.18 7 Maternity/childwelfare 2 0 2 0 0 3 5 500 8 Polyclinic 2 0 2 0 0 3 5 500 9 Hospital 2 0 2 2 200 3 5 150 10 Dispensary 17 0 22 13 1300 25 5 61.54 Communication 11 Postoffice 1 25 1 26 4 1 25 3.85
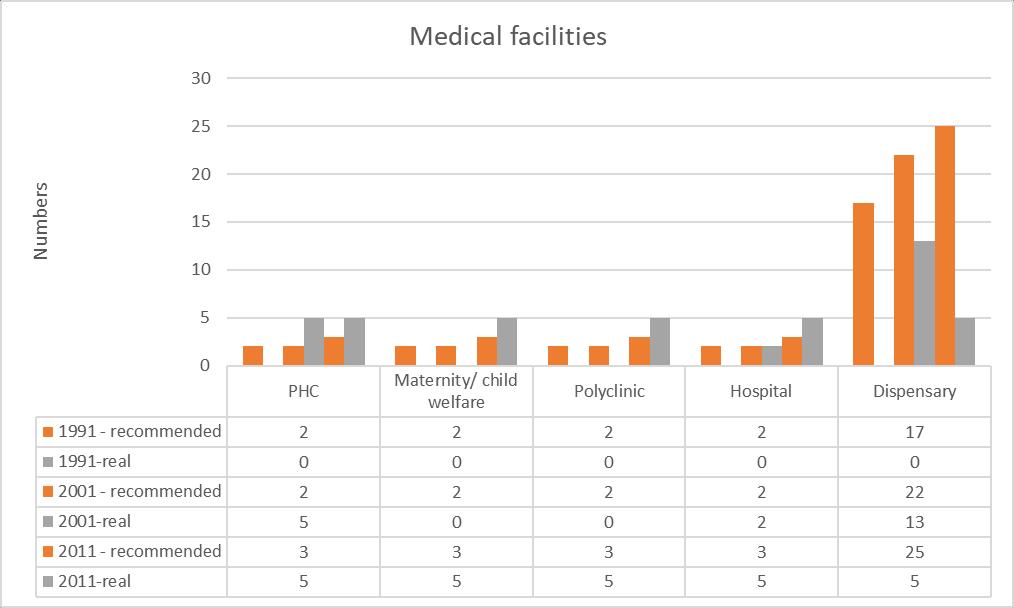
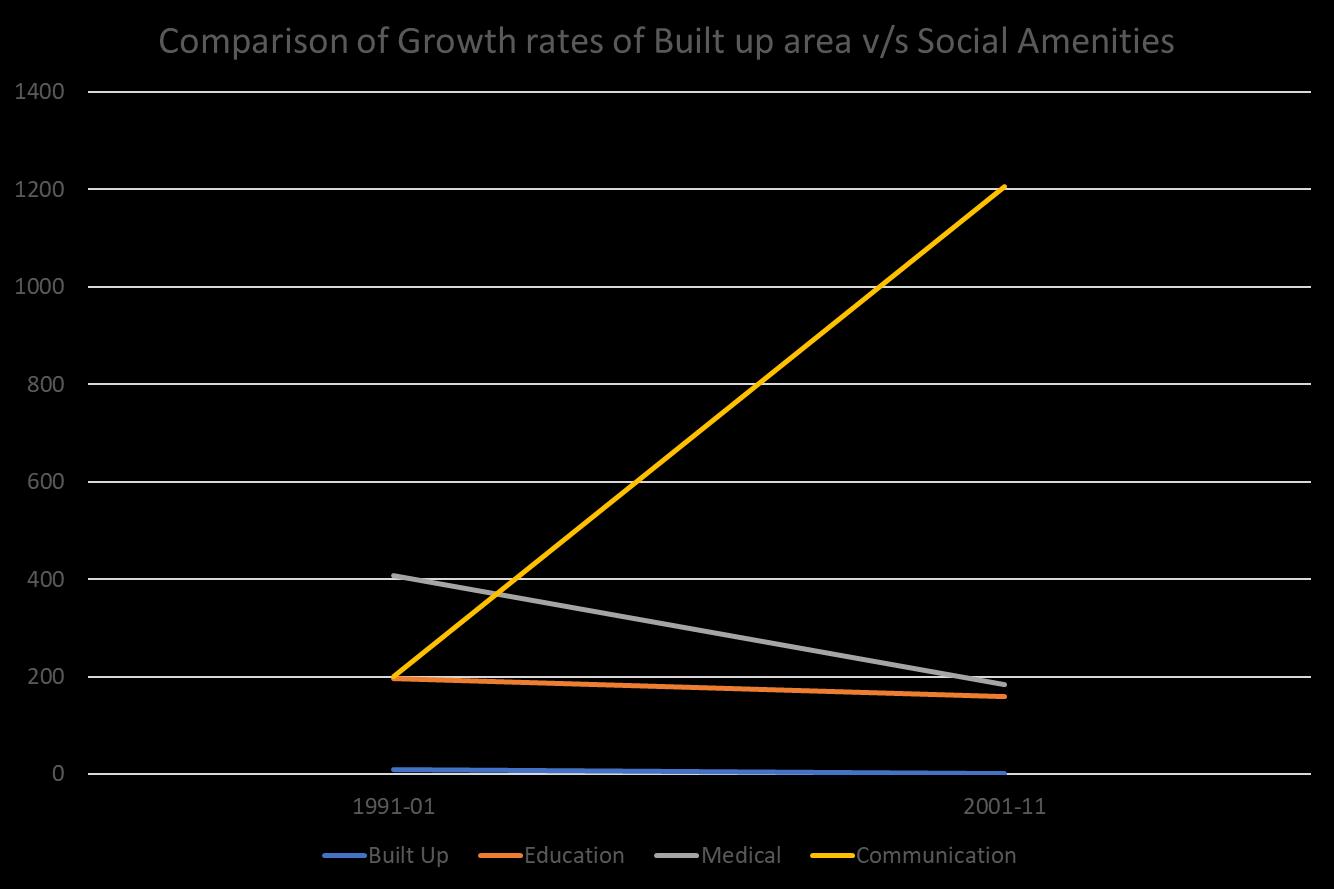
International Research Journal of Engineering and Technology (IRJET) e ISSN: 2395 0056 Volume: 08 Issue: 05 | May 2021 www.irjet.net p ISSN: 2395 0072 © 2021, IRJET | Impact Factor value: 7.529 | ISO 9001:2008 Certified Journal | Page243 12 SubPostoffice 17 0 22 0 0 25 22 2200 13 Postandtelegraph 2 0 2 0 0 3 25 2500 14 Commercialand coopbanks 17 NA 22 8 800 25 18 125 Net Deficit (number of factors) 9 7 4 Incomparisontotheurbanizationgrowthrateson 9.58%between1991and2001,and1.75%between 2001and2011,socialamenitiesintotalhavegrown onanaverageof288%and447%respectively.This shows thattherateofprovisionofamenitieshasfar exceededthelandconversionratestobuilt upland inthesedecades,thoughithasstillnotreachedthe recommendedlevels. Chart 1: Comparingrateofgrowthofbuilt upareav/ssocialamenitiesinPanvel(1991 2011)
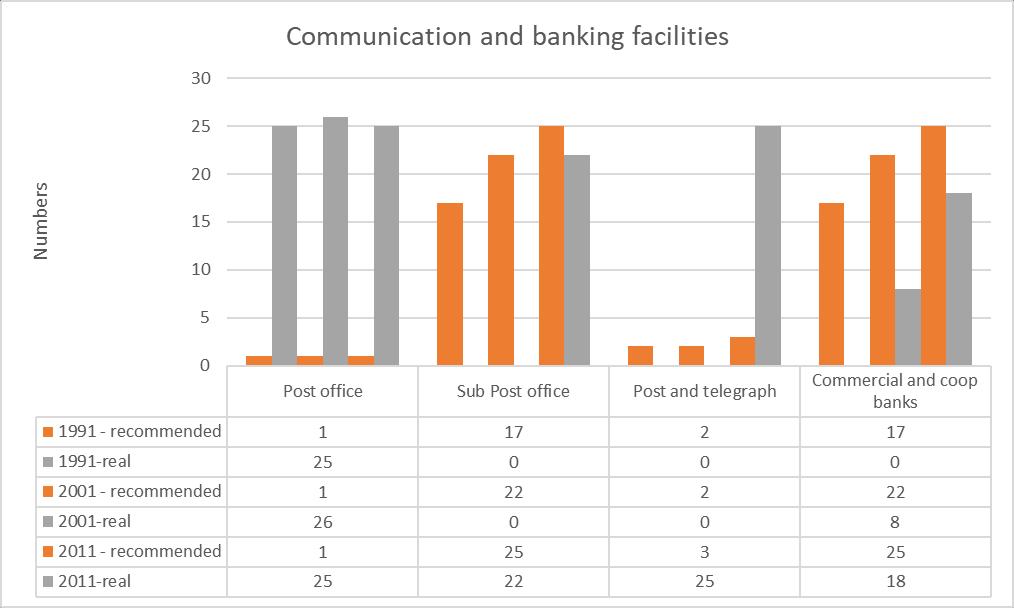
International Research Journal of Engineering and Technology (IRJET) e ISSN: 2395 0056 Volume: 08 Issue: 05 | May 2021 www.irjet.net p ISSN: 2395 0072 © 2021, IRJET | Impact Factor value: 7.529 | ISO 9001:2008 Certified Journal | Page244 Primary School S. Secondary School 1991 - recommended 34 17 1991-real 139 1 2001 - recommended 44 22 2001-real 179 5 2011 - recommended 50 25 2011-real 288 22 0 50 100 300250200150 350 Numbers Educational amenities Chart 2: ComparingrecommendedandactualnumbersofeducationalfacilitiesinPanvel(1991 2011) Chart 3: ComparingrecommendedandactualnumbersofcommunicationandbankingfacilitiesinPanvel (1991 2011)
6. CONCLUSION AsPanvelurbanizesatarapidrate,itishearteningto see the social amenities too have been growing at a rapid rate. While it still hasn’t reached the recommendedlevels,andwillneedmorefundingand execution to match a projected population in the future,itiswellontracktoachievetherecommended rates. Most parameters see a robust rate of growth exceedingtherateofurbanizationforthedecade.
Adeel, M. (2010). Methodology for identifying urban growthpotentialusinglanduseandpopulation data: A case study of Islamabad Zone IV. Procedia Environmental Sciences, 2 Dewan, A., & Corner, R. (2013). Dhaka Megacity: Geospatial Perspectives on Urbanisation, EnvironmentandHealth. SpringerNetherlands. Phadke, A. (2013). Mumbai Metropolitan Region: Impact of Recent Urban Change on the Peri urbanAreasofMumbai. Urban Studies. Tabuchi, T. (2013). Agglomeration in world cities. Procedia: Social and Beha ioral Sciences, 77 Varkey, A. (2019). An Analysis of LULC Change detectionusingGIS,Acasestudyofperiurban Bengaluru. InternationalJournalofScienceand Research, 8(1).
International Research Journal of Engineering and Technology (IRJET) e ISSN: 2395 0056 Volume: 08 Issue: 05 | May 2021 www.irjet.net p ISSN: 2395 0072 © 2021, IRJET | Impact Factor value: 7.529 | ISO 9001:2008 Certified Journal | Page245 Chart 4: ComparingrecommendedandactualnumbersofmedicalfacilitiesinPanvel(1991 2011) Ascanbeseenfromcomparativetrendsoverthelast3 decades (1991 2011), the gap of social amenity provision has been reducing. The 2021 DCHB is delayed due to the pandemic and hence its statistics couldnotbeincludedinthiscomparison.However,itis expectedthatthegapwillclosefurtherwhenthenew statisticsareout. As can be seen from Table 4, Higher schooling has laggedbehindprovisionofprimaryschooling.Medical facilities, which were lagging behind strongly, have caughtupandexceededrecommendedlevelsasPanvel transformsintoaneducationandmedicalhubforits neighboringruralandsemi ruralzones.
7. REFERENCES