International Research Journal of Engineering and Technology (IRJET) e-ISSN: 2395-0056

Volume: 09 Issue: 12 | Dec 2022 www.irjet.net p-ISSN: 2395-0072
International Research Journal of Engineering and Technology (IRJET) e-ISSN: 2395-0056
Volume: 09 Issue: 12 | Dec 2022 www.irjet.net p-ISSN: 2395-0072
1, 3, 4 Student, Dept of IT Engineering, Thakur College of Engineering and Technology, Mumbai, Maharashtra, India. 2 Student, Dept. of Information Technology, St. Francis Institute of Technology, Mumbai, Maharashtra, India ***
Abstract - The manufacturer sets the price of a new car in the industry, with the government incurring some additional expenditures in the form of taxes. Customers purchasing a new car may thus be sure that their investment will be worthwhile. However, due to rising new car prices and buyers' financial inability to purchase them, used car sales are increasing globally. As a result, a used car price prediction system that efficiently assesses the worthiness of the car utilizing a range of factors is required. The current system comprises a system in which a dealer decides on a price at random and the buyer has no knowledge of the car or its current worth. In reality, the seller has no clue what the car is worth or what price he should charge for it. To address this issue, we have devised a highly effective model. Regression algorithms are employed because they produce a continuous value rather than a classified value as an output. As a result, rather than predicting a car's price range, it will be feasible to estimate its real price. A user interface has also been created that takes input from any user and shows the price of a car based on the inputs.
Key Words: Used Car Price Prediction, Regression Algorithms, Machine Learning,LinearRegression,Ridge and Lasso Regression, Bayesian Ridge Regression, Decision Tree, Random Forest, XG Boost, Gradient Boosting.
Determining if the quoted price of a used car is fair is a difficult process owing to the numerous elements that influence a used vehicle's market pricing. The goal of this research is to create machine learning models that can properly anticipate the price of a used car based on its features so that buyers can make informed choices. We create and analyze numerous learning algorithms using a datasetthatincludesthesellingpricesofvariousbrandsand models. We will compare and choose the best machine learning algorithms such as Linear Regression, Lasso Regression, Ridge Regression, Bayesian Ridge Regression, Decision Tree Regression, Random Forest Regression, XG Boost Regression, and Gradient Boosting Regression. The priceofthecarwillbedeterminedbyanumberoffactors. Regression algorithms are used because they produce a continuousvalueratherthanacategorizedvalue,allowing ustopredicttheactualpriceofacarratherthantheprice range of a car. A user interface has also been created that takesinputfromanyuserandshowsthepriceofacarbased ontheinputs.
value:
[1] Variousstudieshavebeenconductedinordertopredict the price of used cars. Researchers regularly anticipate productpricesusingpastdata.Pudaruthpredictedcarprices inMauritius,andthesecarswerenotnew,butratherusedto predicttheprices,heemployedmultiplelinearregression,knearest neighbours, Naive Bayes, and decision tree techniques. When the prediction results from various strategieswerecompared,itwasdiscoveredthattheprices fromthesemethodsarequitesimilar.However,thedecision treetechniqueandtheNaveBayesapproachwereprovento be incapable of classifying and predicting numeric values. AccordingtoPudaruth'sresearch,thesmallsamplesizedoes notgivegoodpredictionaccuracy.
[2] Kuiper, S. (2008) demonstrated a multivariate regression model that helps in classifying and predicting valuesinnumericformat.Itdemonstrateshowtoapplythis multivariateregressionmodeltoforecastthepriceof2005 GeneralMotors(GM)vehicles.Thepricepredictionofcars does not require any special knowledge. So, the data availableonlineisenoughtopredictprices.Theauthorofthe article did the same car price prediction and introduced variableselectiontechniquesthathelpedinfindingwhich variablesweremorerelevantforinclusioninthemodel.
[3] In 2019, Pal et al discovered as a methodology for predictingusedcarspricesusingRandomForest.Thepaper evaluated usedcar price prediction using Kaggle data set whichgaveanaccuracyof83.62%fortestdataand95%for train-data. The most relevant features used for this predictionwereprice,kilometer,brand,andvehicletypeand identifiedbyfilteringoutoutliersandirrelevantfeaturesof the data set. Being a sophisticated model, Random Forest providedgoodaccuracyincomparisontopriorworkusing thesedatasets.
[4] Gegic,E.etal.(2019)demonstratetheneedtocreatea modeltoforecastthecostofsecondhandcarsinBosniaand Herzegovina.Theyusedmachinelearningtechniquessuchas artificial neural networks, support vector machines, and randomforests.However,theaforementionedmethodswere usedinconcert.Thewebscraper,whichwascreatedusing thePHPprogramminglanguage,wasusedtogatherthedata from the website autopijaca.ba for the forecast. Then, to determinewhichmethodbestsuitedtheprovideddata,the respective performances of various algorithms were compared.AJavaapplicationcontainedthefinalprediction
International Research Journal of Engineering and Technology (IRJET) e-ISSN: 2395-0056
Volume: 09 Issue: 12 | Dec 2022 www.irjet.net p-ISSN: 2395-0072
model. Additionally, the model's accuracy of 87.38% was determinedwhenitwasverifiedusingtestdata.Dholiyaet al.demonstratedamachinelearning-basedmethodforauto resalesin2019.
[5] ThegoalofthesystemthatDholiya,M.,etal.developed is to give the user a realistic estimation of how much the vehicle might cost them. Based on the specifics of the automobile the user is looking for, the system, which is a webapplication,mayalsooffertheuseralistofoptionsfor variouscarkinds.Itassistsinprovidingthebuyerorseller withusefulinformationonwhichtobasetheirdecision.This system makes predictions using the multiple linear regression algorithm, and this model was trained using historicaldatathatwasobtainedoveranextendedperiodof time. The raw data was initially gathered using the KDD (KnowledgeDiscoveryinDatabases)process.Afterward,it underwentpreprocessingandcleaninginordertoidentify patterns that are valuable and then derive some meaning fromthosepatterns.
[6] Richardson conducted his analysis under the presumptionthatautomakersaremoreinclinedtoproduce cars that don't lose value quickly. He demonstrated, in particular,thathybridcarsarebetterequippedtomaintain theirvaluethanconventionalvehiclesbyutilisingmultiple regression analysis. This is perhaps because there are increasingconcernsabouttheenvironmentandtheclimate, as well as because it uses less gasoline. In this study, the significanceofadditional variables includingage, mileage, make, and MPG (miles per gallon) was also taken into account. All of his information was gathered from several websites.
[7] Listianipublishedanotherstudythatiscomparableand uses Support Vector Machines (SVM) to forecast lease car pricing . This study demonstrated that when a very large data set isavailable,SVMis significantly more accurate at pricepredictionthanmultiplelinearregression.SVMisalso superiorathandlinghighdimensionaldataandsteersclear of both under- and over-fitting problems. Finding crucial featuresforSVMisdoneusingageneticalgorithm.However, themethoddoesnotdemonstratewhySVMissuperior to basic multiple regression in terms of variance and mean standarddeviation.
Pythonismainlyusedinthisprojecttoimplementmachine learningalgorithmssinceitcontainsalotofbuilt-inmethods in the form of packaged libraries and modules. During projectimplementation,Python,Pandas,NumPy,Matplotlib, Seaborn,Scikit-Learn,Plotly,andPicklelibrarieswereused.
The following technologies were used to build the web application:HTML,CSS,Flask,Jsonify,andRequests.
ThesourceofthedataisthewebportalKaggle.com,where vehicledatasetsareprovidedbyCardekhoforthesaleand purchase of cars. The dataset contained the following features: car name, year, selling price, present or current price, kilometres driven, fuel type: diesel, petrol, or CNG (compressednaturalgas),sellertype:dealerorindividual, transmission: automatic or manual, owner (number of previousowners).
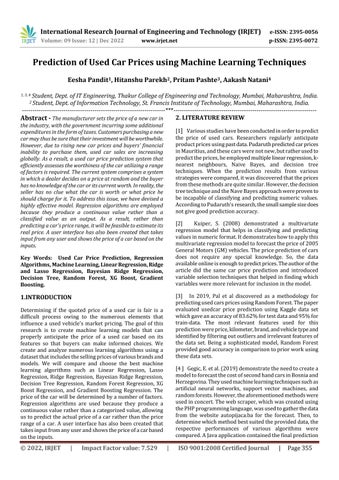
AnenvironmentiscreatedusingtheAnacondaprompt.This environmentwouldseparateourprojectareafromtheother default environment (base) or other previously created environments.Allthepackages,libraries,andmodulesthat we need can be manually installed in the environment createdinthisway,makingitanadvantageousstep.Insuch an environment, we can make changes according to our needs.
The first step is to import and read the csv file for the research. The dataset is extensively examined in terms of null values, shape, columns, numerical and categorical features, dataset columns, unique values of each feature, datainformation,andsoon.
Someofthedatafeatureswererenamedforclarity(Present Price=InitialPrice,Owner=PreviousOwners),andsome featuresthatwerenotimportantforanalysiswereremoved. Inexploratorydataanalysis,weusestatisticalgraphicsand other visualisation techniques to describe the important aspects of data. Top Selling Vehicles, Year vs. Number of AvailableVehicles,SellingPricevs.InitialPrice,VehicleFuel Type,TransmissionType,SellerType,Age,SellingPricev/s Age, Selling Price v/s Seller Type, Selling Price v/s Transmission,SellingPricev/sFuelType,SellingPricev/s PreviousOwners,InitialPricevsSellingPrice,SellingPrice v/s Kilometers Driven, pairplot, heatmaps, and other visualisations are used to gain a better understanding of data.FollowingEDA,OneHotEncodingapproachisusedto deal with the dataset'scategorical features.Afterthat, the dataset's correlation characteristics are generated and
International Research Journal of Engineering and Technology (IRJET) e-ISSN: 2395-0056
Volume: 09 Issue: 12 | Dec 2022 www.irjet.net p-ISSN: 2395-0072
thoroughlyanalysedbyvisualisingseveralplots.Thenthe featuresallocationofdataiswherethedependentfeature (Selling Price) and independent features (Initial Price, Kilometers Driven, Previous Owners, Age, and so on) are thenallocatedforfurtherprocessing.
Once the dependent and independent features have been assigned,weproceedwiththesplittingofthedatasetinto trainingandtestingdata.Weuse80%ofthedatatotrainour modeland20%totestit.
Following the Train-Test split, data modeling is complete, andtheprocessofbuildingthemodelbegins.Themodelis defined, along with a few parameters, for future implementation.Afterthemodelisbuilt,variousalgorithms areusedtocreatethefinalresults.Afterbuildingthemodel, thefollowingalgorithmsareusedforpredictiveanalysis.
Linear Regression: Itisalinearapproachinstatisticsfor modelingtherelationshipsbetweenascalarresponseand dependentandindependentvariables.Inlinearregression, relationships are modelled using functions such as linear predictor, and unknown model parameters are estimated fromdata.
Lasso Regression: Itisasortoflinearregressioninwhich the data values are shrunk towards a data point in the center,or,insimplerterms,themeanofthedata.TheLasso procedure supports simple and sparse models with fewer parameters. When a model has a high amount of multicollinearity,thisregressionprovidesthebestfitforthat model. This approach can also be used if some aspects of model selection, such as variable selection or parameter elimination,needtobeautomated.Theabbreviation'LASSO' standsforLeastAbsoluteShrinkageandSelectionOperator.
Ridge Regression: It is a regression approach used for tuning a model and analyzing multicollinear data. This functionimplementsL2regularization.Themulticollinearity ofthedataresultsinunbiasedleast-squares,ahugevariance, andhencethepredictedvaluesareconsiderablyfarfromthe actualvalues.
Bayesian Ridge Regression: This regression is used to estimate any probabilistic model of any regression issue using linear regression formulation with the use of probability distributors, providing a natural process that survivesdatainsufficiencyorpoordatadistribution.
Random ForestRegression: RandomForestisaSupervised Learning Algorithm that employs the ensemble learning approachforclassificationandregression.Randomforests aremadeupoftreesthatrunparalleltoeachotherandhave nointeractionwhiletheydevelop.RandomForestisameta-
estimator that aggregates the outcomes of several predictions.Italsoaggregatesnumerousdecisiontreeswith certainmodifications.
XGBoost Regression: XGBoostisaverypowerfultechnique for creating supervised regression models. XGBoost is an ensemblelearningstrategythatincludestrainingindividual models and then merging them (base learners) to get a singleprediction.
Gradient Boosting Regression: Thisisamachinelearning approach used to construct a prediction model for regressionandclassificationproblems.Thepredictionmodel generatesanensembleofweakpredictionmodels,whichare oftendecisiontrees.Thismethodoutperformstherandom forestmethodinmostcases.
AddinganewfeatureAge,whichdeterminesthenumberof yearsthevehiclehasbeenused,isstoredinthefinaldataset, andtheyearattributeisdropped.
Inthisstage,wesummarizethemajorcharacteristicsofdata using statistical graphics and other visualization tools. Various graphs and charts are plotted to gain a better understandingofthedatasetandtherelationshipsbetween itsfeatures.
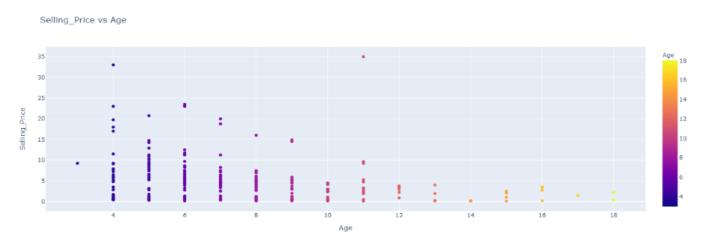
Vehiclecount in relationto vehicleage:Thefollowingbar graphdepictsthenumberofvehiclesofacertainage.
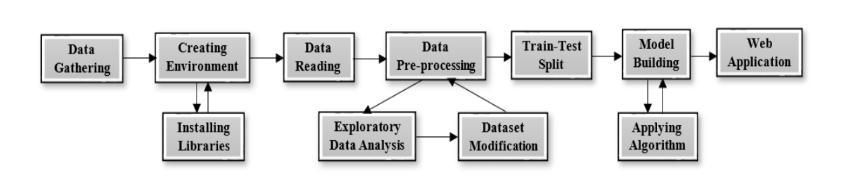
Comparisonofeachvehicle'ssellingpricevs.age:Thechart belowdepictsthesellingpriceandageofacertaincar.Andit iseasytoconcludethatthesellingpriceishighforacarofa youngage.
International Research Journal of Engineering and Technology (IRJET) e-ISSN: 2395-0056
Volume: 09 Issue: 12 | Dec 2022 www.irjet.net p-ISSN: 2395-0072
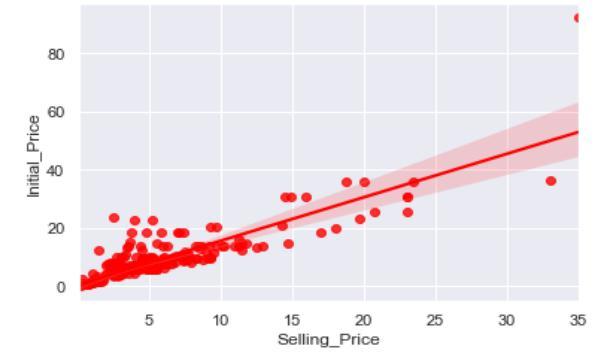
Comparison of Initial Price and Selling Price: The graph below demonstrates the direct proportionality between InitialPriceandSellingPrice,whichsuggeststhatahigher initialpricewillresultinahighersellingprice.
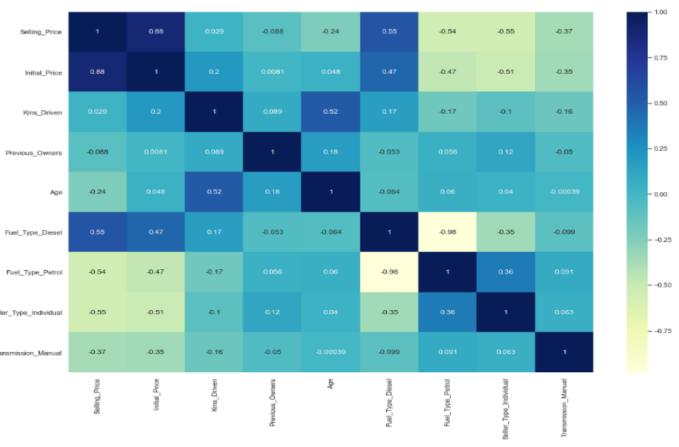
Heatmap of Correlation Features for the Final Dataset: A dataset'scorrelationfeaturesdefinehowclosetwovariables aretohavingalinearrelationshipwitheachother.Features with a high correlation are more linearly dependent and have the same effect on the dependent variable. If two variableshaveahighcorrelation,wecanalwayseliminate one of them. The heatmap of correlation is shown below, withdarkercolorsrepresentinghighcorrelationandlighter colorsrepresentinglowcorrelation.
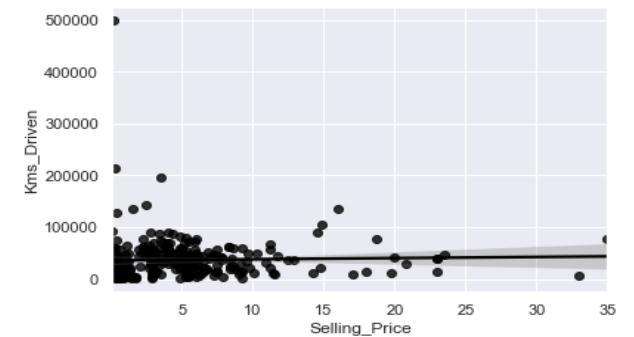
ComparisonofKilometersDrivenvs.SellingPrice:Thegraph aboveshowsthatavehiclewithahighnumberofkilometers drivenhasalowersellingpricethanonewithalownumber ofkilometersdriven.
The one hot coding approach is used to deal with the categorical variables in the dataset. It generates a sparse matrix or a dense array based on the parameters while creating a binary column for each category or parameter. Fuel Type, Seller Type, and Transmission were the three categorical variables in our dataset. Following one hot encoding,thesevariablesaregivenabinaryrepresentation, so that for a car with a Fuel Type of Diesel, the value of Fuel_Type_Diesel is a binary 1 and the value of Fuel_Type_Petrol is a binary 0. The same procedure is appliedfortheremainingcategoryvariables.
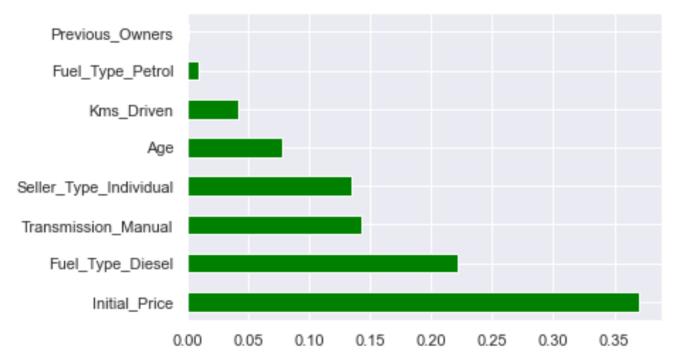
Feature Importance of dataset: The feature importance techniqueprovidesascoretofeaturesinafeaturesetbased ontheirusefulnessinpredictingthetargetvariable.Initial Price isthe most relevant featurein the provided dataset, whilePreviousOwnersistheleastimportant.
Afterthetrain-testsplitofthedataset,modelingiscomplete, and the process of building the model begins. For final implementation,themodeliscreatedwithafewparameters, suchasthealgorithm,xtrain,ytrain,xtest,andytest.After thecompletionofthemodel,variousalgorithmsareusedto generatethefinalresults.
International Research Journal of Engineering and Technology (IRJET) e-ISSN: 2395-0056
Volume: 09 Issue: 12 | Dec 2022 www.irjet.net p-ISSN: 2395-0072
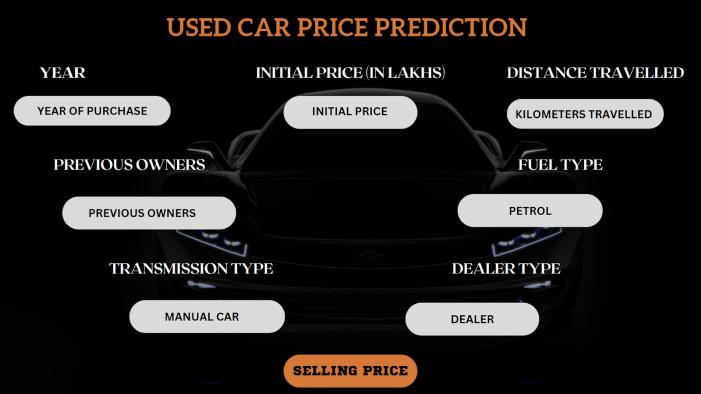
A web application is then made using HTML, CSS, and JavaScriptinthefrontendandusingtheFlaskFrameworkof Pythoninthebackend. Thiswebapplicationallowsanyuser toenterparametersandcalculatetheestimatedsellingprice ofausedcar.Toviewtheresults,theusermustentervalues forvariablessuchasyear,initialprice(inlakhs),kilometers driven, and previous owners, as well as select options for parameterssuchasfueltype,transmissiontype,andseller type.
TheDecisionTreeAlgorithmhasthebestr_2scoreof0.9544 when all regression methods' r_2 scores are compared, whichsimplyimpliesthattheDecisionTreeAlgorithmhas deliveredthemostaccuratepredictionswhencomparedto theotheralgorithms.
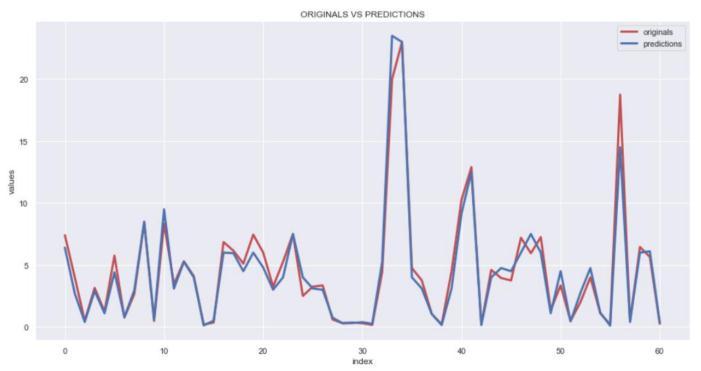
Table 1. EvaluationMetricsofAlgorithms
In the graph above, where the red line represents the original values of the dataset and the blue line shows the valuespredictedusingDecisionTreeRegression,wecansee thatbothlinesareprettyclosetoeachother,indicatingthat thepredictionsarehighlyaccurate.
Predictingusedcarpricesisadifficulttaskduetothelarge numberoffeaturesandparametersthatmustbeexamined inordertogetreliablefindings.Thefirstandmostimportant phaseisdatacollectionandpreprocessing.Themodelwas thendefinedandbuiltinordertoimplementalgorithmsand generate results. After executing various regression algorithmsonthemodel,itwasconcludedthattheDecision TreeAlgorithmwasthetopperformer,withthegreatestr2 score of 0.95, implying that it provided the most accurate predictions, as shown by the Original v/s Prediction line graph.Asidefromhavingthehighestr2score,theDecision TreealsohadthelowestMeanSquareError(MSE)andRoot MeanSquareError(RMSE)scores,indicatingthattheerrors
International Research Journal of Engineering and Technology (IRJET) e-ISSN: 2395-0056
in predictions were the lowest of all and that the results obtainedwereveryaccurate.
Thedevelopedmachinelearningmodelcanbeexportedasa "Pythonclass"anddeployedasanopensource,ready-to-use pricepredictormodel,whichcanthenbeeasilyintegrated with third-party websites. The model can be greatly optimised by using neural networks by designing deep learning network topologies, employing adaptive learning rates, and training on data clusters rather than the entire dataset.
[1] Pudaruth, S. (2014) ‘Predicting the Price of Used Cars usingMachineLearningTechniques’,InternationalJournalof Information&ComputationTechnology,4(7),pp.753–764. Availableat:http://www.irphouse.com.
[2]Kuiper,S.(2008)‘IntroductiontoMultipleRegression: How Much Is Your Car Worth?’, Journal of Statistics Education,16(3).doi:10.1080/10691898.2008.11889579.
[3] Pal, N. et al. (2019) ‘How Much is my car worth? A methodologyforpredictingusedcars’pricesusingrandom forest’,AdvancesinIntelligentSystemsandComputing,886, pp.413–422.doi:10.1007/978-3-030-03402-3_28.
[4]Gegic,E.etal.(2019)‘Carpricepredictionusingmachine learning techniques’, TEM Journal, 8(1), pp. 113–118. doi: 10.18421/TEM81-16.
[5]Dholiya,M.etal.(2019)‘AutomobileResaleSystemUsing Machine Learning’, International Research Journal of EngineeringandTechnology(IRJET),6(4),pp.3122–3125.
[6]Richardson,M.(2009)DeterminantsofUsedCarResale Value.TheColoradoCollege
[7]Listiani,M.(2009)SupportVectorRegressionAnalysis forPricePredictioninaCarLeasingApplication,Technology. HamburgUniversityofTechnology.
[8] https://www.jigsawacademy.com/popularregression-algorithms-ml/
[9] https://www.simplilearn.com/10-algorithmsmachine-learning-engineers-need-to-know-article
[10] https://www.javatpoint.com/machine-learning-lifecycle
[11] https://www.simplilearn.com/tutorials/machinelearning-tutorial/machine-learning-steps
Volume: 09 Issue: 12 | Dec 2022 www.irjet.net p-ISSN: 2395-0072 © 2022, IRJET | Impact Factor value: 7.529 | ISO 9001:2008 Certified Journal | Page360