International Research Journal of Engineering and Technology (IRJET) e-ISSN: 2395-0056

Volume: 09 Issue: 12 | Dec 2022 www.irjet.net p-ISSN: 2395-0072
International Research Journal of Engineering and Technology (IRJET) e-ISSN: 2395-0056
Volume: 09 Issue: 12 | Dec 2022 www.irjet.net p-ISSN: 2395-0072
 Abhishek Raj Nakarmi1, Basant Ale2, Dipesh Budhathoki3
Abstract - Electric vehicles showpromisingresults tolower carbon emissions in the world. However, electric vehicles are comparatively costly and have an issue of range anxiety. Electric vehicle conversion acts as a transition state before full electrification can be achieved in the automobile industry. In this paper, a MATLAB Simulink model is developed to estimate the total energy consumption and range of an electric converted safari vehicle. The model is used to select desired vehicle parameters like electric motor power and optimum gear ratio for desired top speed. Different blocks of the Forward Approach Model: longitudinal vehicle dynamics, powertrain system, battery model, and driver model are integrated with non-linear and dynamic characteristics, which resulted in accurate estimation of driving parameters. The results showed a 36% error in estimating starting motor torque which indicates that the converted vehicle had a lower gear ratio than the simulated model and unaccountedlosses were not present in the simulated model Similarly, the results showed a 1% fluctuation in SOC of the battery due to the intricacies involved in simulating the exact behavior of the provided battery.
Key words: Electric vehicle, Electric Conversion Process, ForwardApproach method,MATLAB Simulink,
In the context of Nepal, the share of fossil fuel vehicles is ontherise.From1990-2011,vehiclesinthecountryhave increased at an average growth rate of 14.32% [1]. With almostallofthe vehiclesrunningonpetroleumfuels,only amodicumportioncomprisesofanelectricvehicle.Nearly 76% of imported fuel energy is used for road transportation purpose. For the last 10 years, the importing trend of petroleum products is increasing at an averagegrowthrateof12.08%,asperthe2019/20report of Nepal Oil Corporation. Moreover, the burning of fossil fuels is the primary cause of climate change, altering the Earth’secosystemsandcausinghumanandenvironmental health problems. In 2020, the CO2 emission per capita for Nepal was 0.59 tons of CO2 per capita. CO2 emission per capitaofNepalincreasedfrom0.02tonsofCO2percapita in1971 to0.59tonsof CO2 per capita in 2020 growing at
an average annual rate of 8.18%[2] Based on these facts, electrificationofthetransportationsectorisimperativeto tackle global warming and economic import-export imbalance problems in developing countries like Nepal Considering thefinancial curbandtheavailablechoices of new vehicles, vehicle conversion becomes an effective investmentalternativeinlinewithvehicleutilitypurposes. The capital investment needed to convert an old petroleum-fueled vehicle into an EV of a specific performance is comparatively cheaper than buying a new EVofthesameperformance[3].
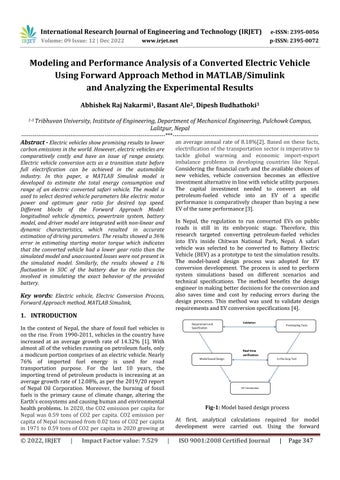
In Nepal, the regulation to run converted EVs on public roads is still in its embryonic stage. Therefore, this research targeted converting petroleum-fueled vehicles into EVs inside Chitwan National Park, Nepal. A safari vehicle was selected to be converted to Battery Electric Vehicle(BEV)asaprototypetotestthesimulationresults. The model-based design process was adopted for EV conversion development. The process is used to perform system simulations based on different scenarios and technical specifications. The method benefits the design engineerinmakingbetterdecisionsfortheconversionand also saves time and cost by reducing errors during the design process. This method was used to validate design requirementsandEVconversionspecifications[4]
At first, analytical calculations required for model development were carried out. Using the forward
International Research Journal of Engineering and Technology (IRJET) e-ISSN: 2395-0056
Volume: 09 Issue: 12 | Dec 2022 www.irjet.net p-ISSN: 2395-0072
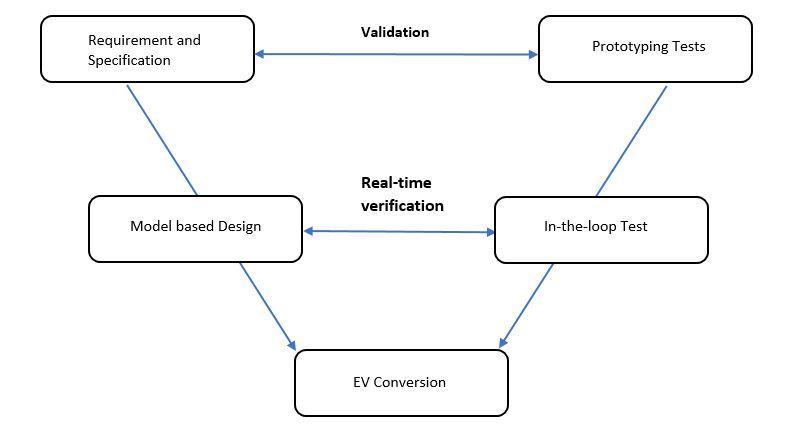
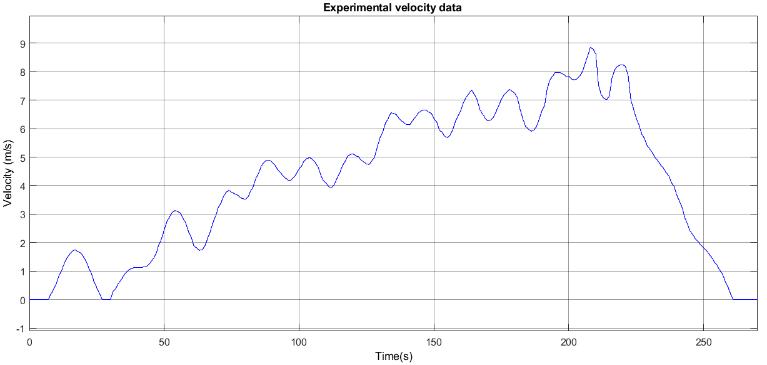
approach method, a mathematical model using MATLAB Simulink was developed. EVs are generally tested for WLTC Class 3a [5], but the model was tested with experimental data obtained through vehicle monitoring software. The cruising speed inside the national park is limited, so lower vehicle speed, like in experimental data, isviableforthesimulation.Themodelisusedtostudythe load capacity limit of the electric motor and the optimum gear ratio to be selected for desired top speed and acceleration. Different blocks of the forward approach model [6]; longitudinal vehicle dynamics, powertrain characteristics, regenerative braking, battery model, and driver model are integrated with non-linear and dynamic characteristics which contributed in the estimation of driving parameters. And finally, the model is applied in a prototype and the simulation and actual results were comparedanddiscussed.
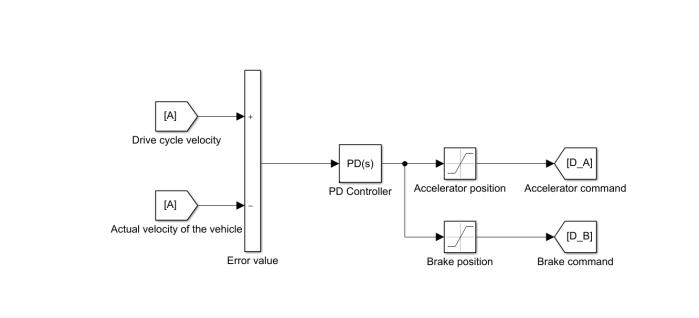
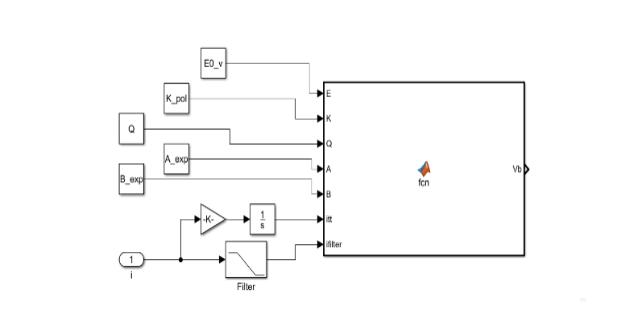
The Simulink architecture is based on the forward modelingapproach[6].Theforwardmodelapproachis an effect-causemethod:thedriverhastoaccelerateorhitthe brake to reduce the error between the actual speed and thedrivecyclespeed,whichisshowninthefigure2
Densityofair(ρ) 1.22kg/m3
Coefficientofdrag(Cd) 0.35
Slopeangle(θ) 0degree
Vehicleweight(Mvehicle) 1400 Rotaryinertiacoefficient(δ) 1.15
Radiusofwheel(Rwheel) 0.381m
Gearratio(G) 4.88
Transmissionefficiency(ηT) 0.85
Motorefficiency(ηM) 0.97
Inverterefficiency(ηI) 0.98
Auxiliarypower(Paux) 300W
Maxtorque(Tmax) 180Nm
Maxregenerativebraking power(Regenmax) 3000W
Cellnominalcapacity(Ccell) 2.5Ah Numberofcells(Ncell) 2400
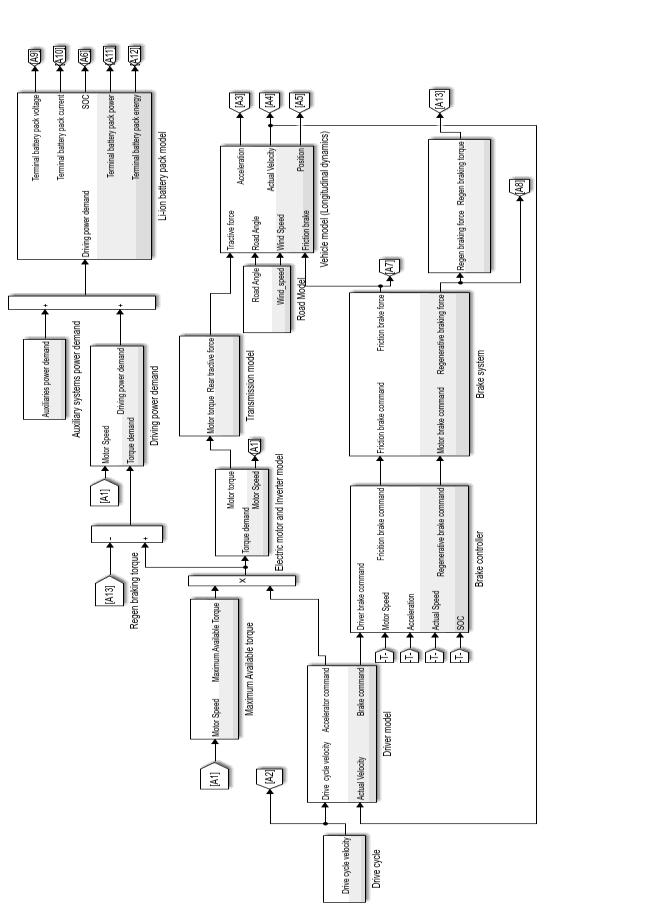
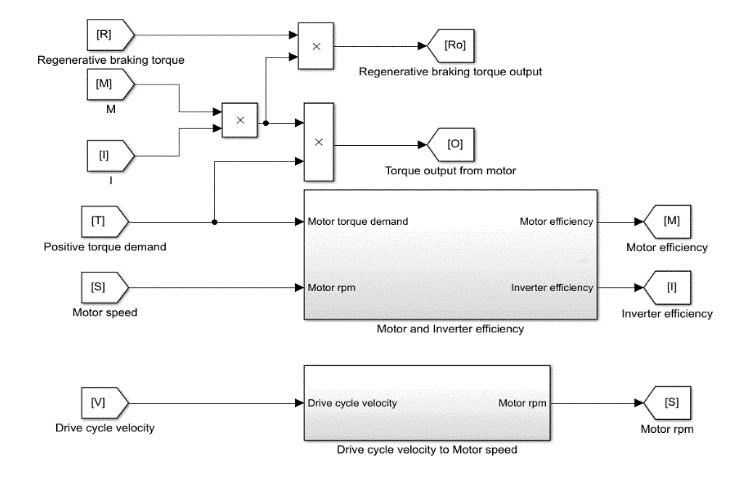
The vehicle system model is divided into 5 parts: Powertrain/Transmission model, Electric motor model, Vehicledynamicsmodel,Drivermodel,andBatterymodel. The input parameters used while developing the vehicle modelinMATLABSimulinkaregivenbelowintable1.
Adhesioncoefficient(φ) 0.85
Frontalareaofvehicle(Af) 2m2
Fig-3: SimulinkarchitectureoftheproposedEV
International Research Journal of Engineering and Technology (IRJET) e-ISSN: 2395-0056
Volume: 09 Issue: 12 | Dec 2022 www.irjet.net p-ISSN: 2395-0072
The converted vehicle is rear-wheel drive system in which a motor is coupled with a differential system. The torque is transferred from the motor to wheels through thetransmissionsystem.Inthemodel,drivecyclevelocity is the input, so motor rpm was calculated by using the equation:
(1)
Where, G is the final gear ratio of the vehicle and Rwheel is thedynamictireradiusin(m).
The tractive force was calculated from the following equation:
(2)
where FT is the tractive force in (N), Tmotor is the torque output in (Nm) from the motor, ηT is the transmission efficiencyofthepowertrain.
Torqueoutputfromtheelectricmotorisderivedfrom thelook-uptableforTorquevsMotorrpmgraphprovided bythemanufacturer. The energyflowfrom a batterypack to motor output is reduced due to losses present in the Electric motor and Inverter. Electric motor and Inverter efficienciesarefunctionsofmotorspeedandmotortorque [7]. Since actual efficiency map was not available, a constantmotorefficiencyof97%andinverterefficiencyof 98%areassumed.Efficienciesintractionandregenerative mode are different, but it is assumed to be equal in the study.
During the motion of the vehicle, different resisting forcesactonthevehicle[8].Aerodynamicdragoccursdue tofrictioncreatedbytheairaroundthevehicle’sbodyasit passesby.
Faero =0.5*Cd*Af*Vvehicle2 (3)
Where, Cd is coefficient of drag, Af is frontal area of the vehicleandVvehicleisvelocityofthevehicle.
Tire rolling resistance is created due to friction betweentiresandtheroad.
Frr =Crr*Mvehicle*g*cos(θ), (4) where Crr is the coefficient of rolling resistance, Mvehicle is thegrossweightofthevehicle,gistheaccelerationdueto gravity and θ is the road slope. Crr is dynamic and varies with vehicle speed and road quality [9]. For concrete roads, Crr can be approximated using equation (5) for speedsupto128km/h[10]:
( ) (5)
Gradient resistance is caused due to component of gravityactingonthevehiclebecauseoftheroadslope.
Fgrad =Mvehicle*g*sin(θ) (6)
To accelerate, the vehicle needs to overcome inertial force (IL) and rotary inertia of rotating parts (IR) in the vehiclesystem Totalinertialresistance(FI)isgivenbythe equation:
FI=IL+IR=Mvehicle*α*δ, (7)
Where, α is linear acceleration of the vehicle and δ is coefficient of rotary inertia which is assumed to be 1.15. The rotary moment of inertia canbeaccuratelycalculated usingthemethodmentionedin[11][12].
The electric motor needs to overcome the resisting forces for the vehicle to accelerate, so the total tractive force(Ft)isgivenbytheequation:
Ft =Faero+Frr+Fgrad+FI (8)
Thus, the acceleration of the vehicle is given by the equation: (9)
International Research Journal of Engineering and Technology (IRJET) e-ISSN: 2395-0056
Volume: 09 Issue: 12 | Dec 2022 www.irjet.net p-ISSN: 2395-0072
A PD controller is used for the accelerator and brake commands. The controller is fine-tuned with Simulink’s inbuilt tuner app for the least error between the drive cycleandactualvehiclespeed
=0, ifωmotor=0
Where ωmotor is the motor rpm. The available electric motor brake command (EMAvailable) is compared with the driver’s brake command (DB), to calculate the friction brakingforceandregenerativebrakingforce: , (13)
IfDB<EMAvailable:DRegen=DB, DFriction =0
IfDB≥EMAvailable:DRegen=EMAvailable,DFriction =DB -EMAvailable
Fig-5: PDcontrollermodel
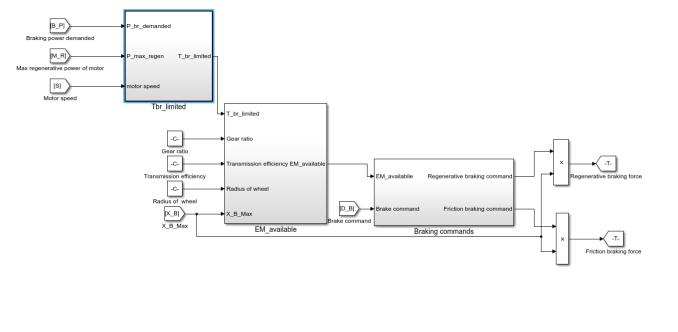
The braking strategy has a strong effect on both fuel economy and the performance of the converted vehicle [21].Sincethemodel employedaseriesbrakingsystemat therearaxle, themaximumavailablebrakingforce(XBMax) is distributed between friction braking force (XFriction) and regenerativebrakingforce(XRegen)[6][13].
XBMAX =φ*Mvehicle*g, (10)
Whereφistheadhesioncoefficientbetweenthe tiresand theroad.
XFriction =XBMAX*DFriction (11)
XRegen =XBMAX*DRegen (12)
WhereDFrictionisthefrictionbrakingcommandandDRegenis theregenerativebrakingcommand.
The demanded motor braking power PBr_demanded is compared to the maximum regenerative motor braking powerPMax_Regen toderivethelimitedmotorbrakingtorque TBr_Limited. PBr_demanded is the power required to decelerate the vehicle to a certain speed [14]. The algorithm for brakingisasfollows:
IfPBr_demanded>PMax_Regen:
,ifωmotor≠0
=0, ifωmotor=0
IfPBr_demanded ≤PMax_Regen:
,ifωmotor≠0
Thedrivermodelsimulatesthereactionofthedriverwhile accelerating or decelerating. The torque demand depends ontheacceleratorcommandfromthedrivermodel.
TDem =Tmax *DA (14) Where,TDemisthedemandedtorque,Tmaxisthemaxtorque output of the motor, and DA is the accelerator command fromthedriver’smodel.
There are different techniques to model Lithium-ion batteries: Mathematical modeling, Electrochemical modeling, and Equivalent circuit modeling [15] [16]. A generic battery model is used because the data sheets are readily available and it provides acceptable accuracy for battery parameter estimation. The components of the generic battery model include: Battery constant voltage (VOC),internalresistance(RO),exponentialzoneamplitude (A), exponential zone time constant inverse (B), filtered current(i*),current(i),actual batterycharge(it), battery capacity(Q)andpolarizationconstant(K).
Vbat = VOC– ( ) ( ) -Ro*i (15)
International Research Journal of Engineering and Technology (IRJET) e-ISSN: 2395-0056
Volume: 09 Issue: 12 | Dec 2022 www.irjet.net p-ISSN: 2395-0072
Fig-7: Genericbatterymodel
Table -2: BatteryparametersforLi-ioncell
Parameters Value
Voc 3.366 R0 0.01 A 0.26422 B 26.5487 K 0.0076
Single cell current demand (ICell) can be calculated usingtheequation[18]: √ (16)
Where,Pcell_demandisthesinglecellpowerdemand.
Single-cellpowerdemandiscalculatedbydividingthe netpowerdemandbythetotalnumberofcells(Ncell).
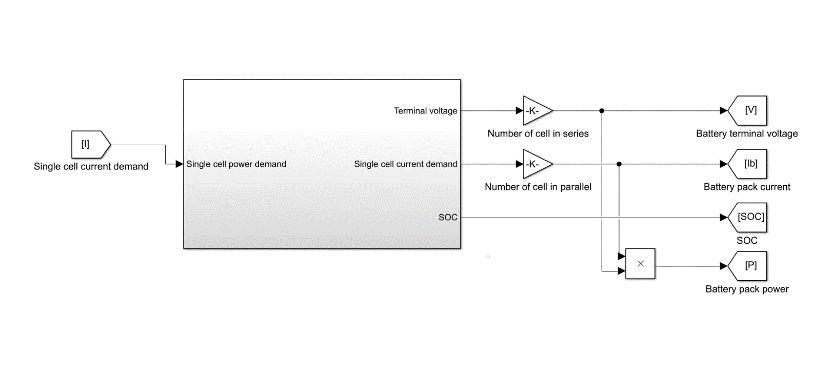
Terminalbatterypackvoltageandcurrentaregivenas:
VBattery_pack =VT*Nseries (17)
IBattery_pack =ICell*Nparallel (18)
Where, Nparallel is the number of cells in parallel inside the battery pack Nseries is the number of cells in series inside thebatterypack
The battery state of charge (SOC) is calculated using “Coulombcountingmethod”,givenbytheequationbelow: ( – ∫ ) (19)
Where,SOC0 istheinitialbatterystateofchargeandCcell is singlecellcapacity.
The cell data are extracted from [17] [22] for generic batterymodelingmethod.
Lithium-ionbatterypackhasastabledischargeperiod within the state-of-charge range of 20% to 80% [20]. But, 85%oftotalbatteryenergyisassumedinthestudy.
Batteryenergy=0.85*NominalBatt_V*NominalBatt_Ah (20)
Where, NominalBatt_V = 108 V,is the nominal battery pack voltageand NominalBatt_Ah =200Ahisthenominalbattery packcapacity.
So,Batteryenergy =18360Wh
Therangeofthevehiclemodeliscalculatedasfollows: (21) Where,
For ease of use, range for the vehicle is equals to (km)
The electric converted vehicle was tested on the road and experimental data were obtained for analysis and comparison purpose Battery pack current, battery pack voltage,motorcurrent,motortorque,motorspeed,vehicle speed, and battery pack SOC data were obtained from the vehiclemonitoringsoftware.
International Research Journal of Engineering and Technology (IRJET) e-ISSN: 2395-0056
Volume: 09 Issue: 12 | Dec 2022 www.irjet.net p-ISSN: 2395-0072
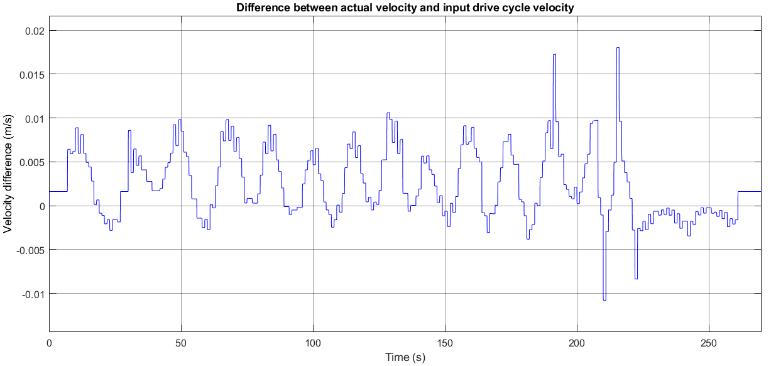
A PD controller is employed in the model to regulate the reference and actual vehicle speed in a closed loop. Reference speed and actual speed of the vehicle differed negligibly showing that the PD controller worked well as showninfigure10
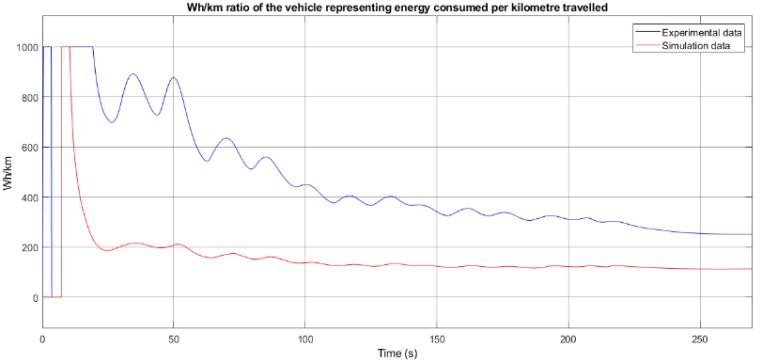
The energy consumption ratio of the experimental data is 251.5, whereas it is 113.2 in the simulated mode, for a transmission efficiency of 85%. The high value of the energy consumption ratio in the experiment was due to losses present in the old transmission system. The energy consumptionvaluefluctuatesat first;however,itattains a constantvalueovertimeasshowninfigure11.
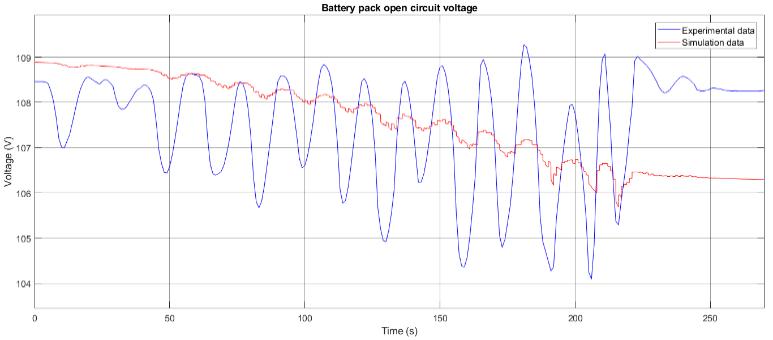
Theterminalvoltagedataofthebatteryhadfluctuationsin the experiment as shown in figure 13. The value dropped toabout105Vbutrecoveredtotheoriginalvaluequickly. However, the voltage constantly dropped to 106 V and didn’t recover to the original value in the simulated data. The generic battery model couldn’t be as accurate as the actual equivalent circuit battery model which accounted for time constants for the battery, resulting in an error in thepredictionofopencircuitvoltage.
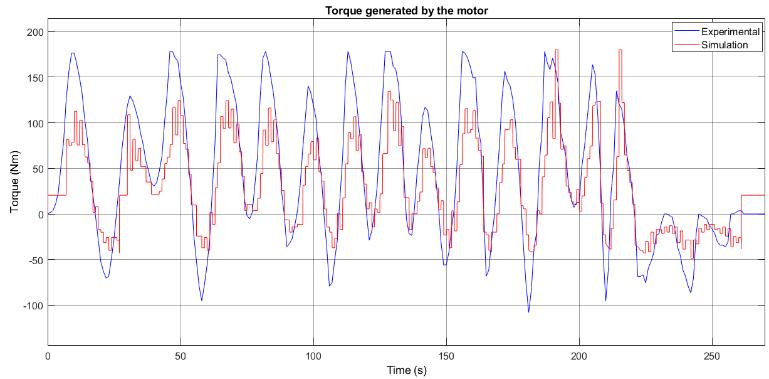
The starting torque value of the motor in the simulated model is 115 Nm whereas the torque reached 180 Nm during the experiment as shown in figure 12 One of the reasonscouldbeduetoinsufficientgearratio(i.e.3.5:1)in the transmission system of the vehicle. The optimal gear ratio for the system is approx. 8:1 as per the model. This could have caused the motor to draw a high current from thecontrollerduringthestartofthevehicle.
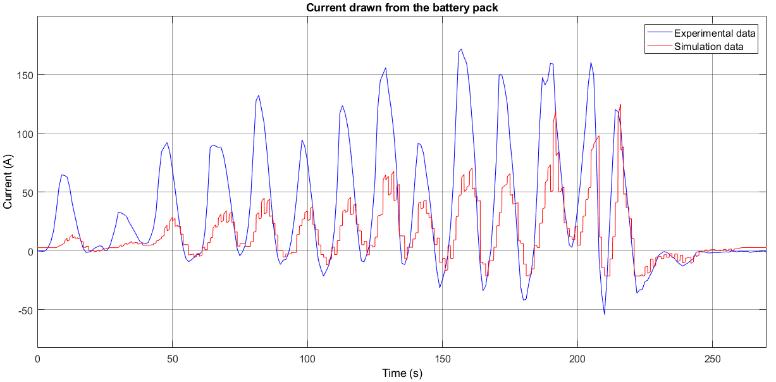
There was a slight difference in battery current drawn between the simulated and experimental data. The differencecouldbeduetoillconfigurationofthemotoror inefficiencies present in the model configuration. The battery model could also affect the current value. The batterycurrent valueinthe experimental data was higher thanthesimulatedvalueasshowninfigure14
International Research Journal of Engineering and Technology (IRJET) e-ISSN: 2395-0056
Volume: 09 Issue: 12 | Dec 2022 www.irjet.net p-ISSN: 2395-0072
improvement of the prototype continues as an ongoing researchproject.
[1] S. Paudel, G. Raj Pokharel, N. Bhattarai, and S. Shrestha, “Evaluating the Effect of Policies, Vehicle Attributes and Charging Infrastructure on Electric VehiclesDiffusioninKathmanduValleyofNepal”.
[2] M. Crippa et al., “GHG emissions of all world countries2021Report.”doi:10.2760/173513.
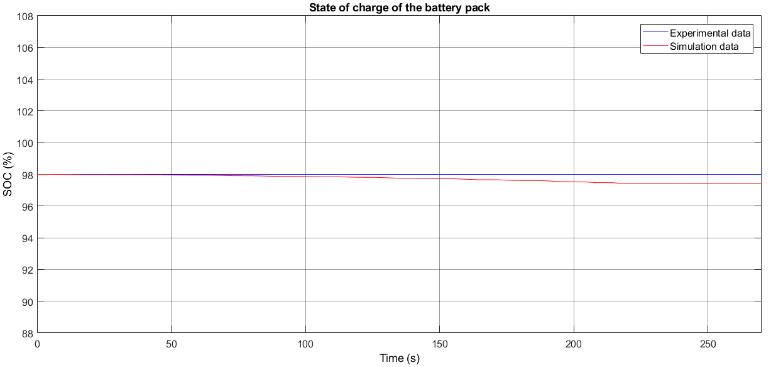
In the experimental data, SOC didn’t drop whereas, in the simulated model, it dropped from 98% to almost 97% as shown in figure 15. The error could be due to the least count of the SOC meter in the experiment. Furthermore, the generic battery model could have affected the SOC whichcouldn’texhibittheaccuratebehaviorofthebattery packusedinthevehicle
[3] S. Kaleg, A. Hapid, and M. Kurniasih, “Electric Vehicle Conversion Based on Distance, Speed and Cost Requirements,” Energy Procedia, vol. 68, pp. 446–454, Apr. 2015, doi: 10.1016/j.egypro.2015.03.276.
[4] A.Ukaew,“ModelBasedSystemDesignforElectric Vehicle Conversion,” in New Trends in Electrical Vehicle Powertrains, IntechOpen, 2019. doi: 10.5772/intechopen.77265.
[5] “Worldwide Harmonized Light Vehicles Test Cycle (WLTC),”DieselNet. https://dieselnet.com/standards/cycles/wltp.php
[6] I. Miri, A. Fotouhi, and N. Ewin, “Electric vehicle energy consumption modeling and estimation A case study,” International Journal of Energy Research,vol.45,no.1,pp.501–520,Jan.2021,doi: 10.1002/er.5700.
Fig-15: BatterypackSOCgraph
The overall model is working efficiently. The discrepancy in the starting motor torque is largely due to the insufficient gear ratio and the unaccounted losses in the model. In addition to what is already done, if other pieces ofinformationaboutthemotor and controllerparameters are received from the manufacturer, the model would be more efficacious. Also, the battery model should be accurate and efficient to get the actual SOC graph Conclusively,themodel can beusedatthe designstage in similar EV conversion projects to determine the equipment specifications and carry out performance analysisofthevehicle.
This project was funded by the Young Scientist Encouragement Fund, Ministry Of Social Development, Bagmati Province, Nepal. The sum of NRs. 20 lakhs (~ 20 thousand dollars) was awarded for the development and testing of a prototype electric converted vehicle. The
[7] K. N. Genikomsakis and G. Mitrentsis, “A computationally efficient simulation model for estimating energy consumption of electric vehicles in the context of route planning applications,” Transportation Research Part D: Transport and Environment, vol. 50, pp. 98–118, Jan. 2017, doi: 10.1016/j.trd.2016.10.014.
[8] C.Sunanda,“ModelingandPerformanceAnalysisof an Electric Vehicle with MATLAB/Simulink,” International Research Journal of Engineering and Technology, p. 1098, 2008, [Online]. Available: www.irjet.net.
[9] S.Chauhan,“MotorTorqueCalculationsforElectric Vehicle,” International Journal of Scientific & Technology Research, vol. 4, p. 8, 2015, [Online]. Available:www.ijstr.org
[10] M.Ehsani,Y.Gao, S.E.Gay, andA.Emadi, “Modern Electric, Hybrid Electric, and Fuel Cell Vehicles: Fundamentals,Theory,andDesign”.
International Research Journal of Engineering and Technology (IRJET) e-ISSN: 2395-0056
Volume: 09 Issue: 12 | Dec 2022 www.irjet.net p-ISSN: 2395-0072
[11] J. Wang, I. Besselink, and H. Nijmeijer, “Battery electric vehicle energy consumption prediction for a trip based on route information,” Proceedings of the Institution of Mechanical Engineers, Part D: JournalofAutomobileEngineering,vol.232,no.11. SAGE Publications Ltd, pp. 1528–1542, Sep. 01, 2018.doi:10.1177/0954407017729938.
[12] L. Jeongwoo and D. J. Nelson, “Rotating inertia impactonpropulsionandregenerativebrakingfor electric motor driven vehicles,” 2005 IEEE Vehicle Power and Propulsion Conference, VPPC, vol. 2005, pp.308–314, 2005, doi: 10.1109/VPPC.2005.1554575.
[13] K. Warake, S. R. Bhahulikar, and N. v Satpute, “Design & Development of Regenerative Braking System at Rear Axle,” 2018. [Online]. Available: http://www.ripublication.com.
[14] Sandeep, V., Shastri, S., Sardar, A., & Salkuti, S. R. (2020).Modelingofbattery packsizingforelectric vehicles.InternationalJournalofPowerElectronics and Drive Systems (IJPEDS), 11(4), 1987. doi:10.11591.ijpeds.v11.i4.pp1987-1994
[15] Fotouhi,A.,Auger,D.J.,Propp,K.,Longo,S.,&Wild, M. (2016). A review on electric vehicle battery modelling: From Lithium-ion toward Lithium–Sulphur. Renewable and Sustainable Energy Reviews, 56, 1008–1021, doi:10.1016.j.rser.2015.12.009.
[16] Saldaña,G.,SanMartín,J.I.,Zamora,I.,Asensio,F.J., & Oñederra, O. (2019). Analysis of the Current Electric Battery Models for Electric Vehicle Simulation. Energies, 12(14), 2750, doi:10.3390.en12142750
[17] Yao, L. W., Aziz, J. A., Kong, P. Y., & Idris, N. R. N. (2013). Modeling of lithium-ion battery using MATLAB/Simulink. IECON 2013 - 39th Annual Conference of the IEEE Industrial Electronics Society, 1729-1734, doi:10.1109.IECON.2013.6699393.
[18] Miri, I., Fotouhi, A., & Ewin, N. (2020). Electric vehicle energy consumption modelling and estimation -A case study. International Journal of Energy Research, 45(1), 501–520, doi:10.1002.er.5700
[19] Yu,Y.,Narayan,N.,Vega-Garita,V.,Popovic-Gerber, J., Qin, Z., Wagemaker, M., Bauer, P., & Zeman, M. (2018).ConstructingAccurateEquivalentElectrical Circuit Models of Lithium Iron Phosphate and Lead–Acid Battery Cells for Solar Home System
Applications. Energies, 11(9), 2305, doi:10.3390.n11092305
[20] Su, J., Lin, M., Wang, S., Li, J., Coffie-Ken, J., & Xie, F. (2019).Anequivalentcircuitmodelanalysisforthe lithium-ion battery pack in pure electric vehicles. Measurement and Control, 52(3–4), 193–201, doi: 10.1177.0020294019827338.
[21] “EffectofDifferentRegenerativeBrakingStrategies on Braking Performance and Fuel Economy in a Hybrid Electric Bus Employing CRUISE Vehicle Simulation,”2008.
[22] Tremblay, O.; Dessaint, L.-A. (2009). Experimental Validation of a Battery Dynamic Model for EV Applications.World Electric Vehicle Journal, 3 (289-298),doi:10.3390.wevj3020289