International Research Journal of Engineering and Technology (IRJET) e-ISSN:2395-0056
Volume: 09 Issue: 12 | Dec 2022 www.irjet.net p-ISSN:2395-0072
International Research Journal of Engineering and Technology (IRJET) e-ISSN:2395-0056
Volume: 09 Issue: 12 | Dec 2022 www.irjet.net p-ISSN:2395-0072
1PG Scholar, Department of Civil Engineering, RYMEC, Ballari
2,3,4Assistant Professor, Department of Civil Engineering, RYMEC, Ballari ***
Abstract - A building that is situated on a hilly slope region differs significantly from buildings that are situated on flat surfaces. Buildings located in hillyareas are significantly more susceptible to seismic activity. When subjected to seismic forces, buildings built on hill slopes develop torsional moments in addition to lateral forces because of the different column lengths that cause mass and stiffness to vary along different floors. This study examines the seismic behaviour of step-back buildings in seismic zones II and III alongside conventional buildings. All of the models were created using finite element software, and the Response Spectrum method was used to analyse the data In addition, the configurations' story displacement, story drift, and base shear at foundations were compared to the seismic parameters derived fromthe analysis. The seismic behaviour of buildings on hillsides was also contrasted with that of conventional buildings. Finally, the configurations' suitability and vulnerability to seismic loads were discussed.
Constructiononaslopehasitsuniquecharacteristics andchallenges,butitprovidesadmirableadvantagesonce finished.Thissameviews,landscapedesign,betterlighting, isolation,andspacewillbeappreciatedbytheowner.The abovetriestoexplainwhymanyoftheworldslargestmost prestigious homes are built on slopes. Even so, it necessitatescomplicatedfoundationsystems,whichaddto constructiontimeandcost.Itisfrequentlymoreexpensive than building an entire residence on level terrain. More concrete, depth excavation via specialized excavation or blasting,retainingwallsorterraces,andspecializeddrains andsewagesystemremediesareneededtoensurethatthe residence seems to be up to standards and secure to repopulate.
Earthquakeanalysisisacomponentofanalysisof structures as well as the computation of a building's reaction to seismic events. It is used in the building system, assessment, and retrofitting processes in earthquakeregions.

Early seismic designs did not place much emphasis on bridges, but as time has gone on, it has become clear that in seismically active areas, seismic designcanbethedecidingfactor.
Forbuildingsthataresubjecttolateralforcesfrom earthquakes,wind,etc.,bracingsystemsarerequired.They aidinreducingthebuilding'slateraldisplacement.Youcan saythatbracingsystemsupportsthelateralloadswhilethe beams and columns of the frame building support the verticalloads.
Thesedays,it'spopulartodesignhigh-risebuildings using diagrid structures. This method was used by many notabletowersallovertheworld,whichfurthercontributed totheirdistinctiveshapeanddesign.
A framework made of beams that intersect diagonally is known as a diagrid (diagonal grid). These beams,whichcanbemadeofmetal,wood,orconcrete,were employedinthedesignoftallbuildingsaswellasroofs.
© 2022, IRJET | Impact Factor value: 7.529 | ISO 9001:2008 Certified Journal | Page

International Research Journal of Engineering and Technology (IRJET) e-ISSN:2395-0056
Volume: 09 Issue: 12 | Dec 2022 www.irjet.net p-ISSN:2395-0072
Anjeet Singh Chauhan, RajivBanerjee arecarried out work on ‘Seismic Response of Irregular Building on Sloping Ground’ irregularities are one of the key reasons whytheconstructionfailed,accordingtotheresearchthey didonit.structuralframeswithavarietyofirregularities, suchastorsionalirregularity,diaphragmirregularity,mass irregularity,andverticalirregularity.Additionally,dynamic analysis must be performed to ascertain the building's maximum dynamic response in order to properly analyse this kind of structure. Response Spectrum Analysis is a viableoptionbecauseobtainingthetimehistoryrecordsfor allthelocationswouldbechallenging.Hereforstudy,aG+10 buildingswithstoryheightmeasuring3.6metresinheight and a horizontal angle of inclination of 20degrees, 30degrees,40degrees,and45degreesontheslopingground is analysed by the Response Spectrum method in seismic zoneVtomakeiteasierforpeopletomovearoundduringan emergency.Itsinstallationofmachinesandequipmentthat createsmassirregularity,aswellasthegrounduptothetop of the story at the, will take place on the top two storeys. According to IS 1893:2016, Etabs software analyses and modelsStepbackbuildingstocomparethembasedontheir nonlinear dynamic traits, like modes, Base Shears, Storey deflection,Storeydrifts,andStoreyshears,itispossibleto determinetheframe'ssusceptibilitytoabnormalitiesinside theframeonthehillsides.
Prof.Tejaswini junghare , Ravikumar Yadav, Bhushan Rathod, Pawan Ranbawale arecarriedoutwork on ‘Seismic Analysis on Irregular Structures on hill slopes behavedifferentlyfromthoserestingonflatgroundwhenit comestoseismicbehaviour,andthisrequiresa3-Danalysis of the structure. The structure's dynamic response to the slope of the hill has been investigated. The majority of studiesacknowledge that buildings resting on hillyslopes experiencemoredisplacementsandbaseshearscompared tothoselayingflat.
Mr. Anuj Kumar Sharma, Mr. Amit Kumar arecarriedoutworkon‘AnalysisofG+30Highrise BuildingsbyUsingEtabsforVariousFrameSectionsinZone IVAndZoneV’in periodoftimestheystudied,earthquakes areknowntohavecauseddisasters.Buildingsarebecoming shorterandmuch more prone toswayinmodern society, whichmakesthemhazardousduringanearthquake.Inthe past, engineers and scientists came up with strategies to increase the earthquake resistance of buildings. The application of lateral force resisting strategies inside the building shape has been found to greatly improve the structure's ability to withstand in earthquake by ETABS 9.7.4, according to a number of real-world investigations. Shear walls and bracing have been used in the work for a variety of conditions, and the maximum height taken into consideration for the study's purposes is 93.5m. The modellingtoexaminehowseismiccharacteristics,suchas
base shears, lateral displacement, and lateral drift, may changeundergivencircumstancesandatspecificheightsis complete.TheknowledgegainedhasbeenappliedtoZone4 and Zone 5 in Soil Type II, as described in IS 1893-2002. (mediumsoils).
M. Hasan, N. H. M. K. Serker arecarriedoutwork on ‘Seismic Analysis of RC Buildings Resting on Sloping GroundwithVaryingHillSlopes’ idealisationof structure geometryandtheloadingsystemonthestructuredetermine the analysis of the structure that was studied. The appearanceofirregularitiesinthestructureshattersgeneral behaviour. In mountainous places, you can typically find step-back and step-set-back structural frames with some abnormalities.Theearthquakereactionsofstep-back&stepback-set-back frameworks which are maintained upon sloped ground are compared in this study. Using the responsespectrummethod,theETABSsystemanalyzesten step back and ten step back-set back structure frames at slopeanglesof0,5,10,15,20,25,30,35,40,and45degrees. Step back frames may function more well throughout earthquake action than other structure configurations because they create larger levels of base shears, top story displacements, and fundamental time periods than step back-set back frames. Step back-set back frames are thereforepreferred.
Numerousvariables,suchasthenumberofbays,the angle of the hill, the number of floors, etc., affect how a building frame responds to a sloped surface. The study considerstwobuildingconfigurations:thestandardbuilding andthestep-backbuilding.
1. Creation of 3D models for both flat and sloping buildings.
2. Inseismiczones2and3,acomparisonbetweena normalbuildingandaslopedbuilding.
3. Acomparisonofvariousbracingtypesinstep-back orslopedbuildingsinseismiczones2and3.
4. Using response spectrum analysis, calculate the displacement,drifts,andshearsofeachstoreyinseismic zones2and3.
5. To identify the most efficient type of bracing for slopedstructuresinseismiczones2and3.
6. How well 630 diagrid performs in the sloped buildingincomparisontobracinginseismiczones2and 3.
International Research Journal of Engineering and Technology (IRJET) e-ISSN:2395-0056
Volume: 09 Issue: 12 | Dec 2022 www.irjet.net p-ISSN:2395-0072
Table -1: MaterialProperties
DensityofRCC 25kN/m3 DensityofMasonry 20kN/m3
CompressiveStrength,fck 35N/mm2(Beam) 35N/mm2(Column)
Steel,fy 550N/mm2& 500N/mm2
ModulusofElasticity,Ec 5000*(fck)0.5
EachStoreyHeight 3.1m
WallThickness 300mm
ThicknessofSlabs 150mm
SizeofBeams 300x600mm SizeofColumns 400x700mm
BuildingFrameSystem SpecialRCMoment ResistingFrame
ParapetHeight 750mm Supports Fixed Building 24mx24m
SpacinginXandYdirection 3.50m
NumberofStorey 10
BracingSection ISMC350
DampingofStructure 5%
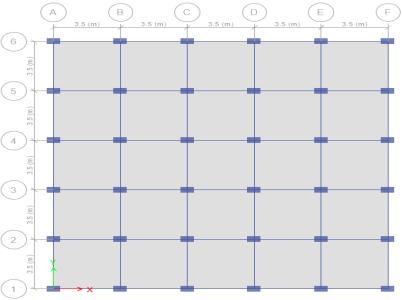
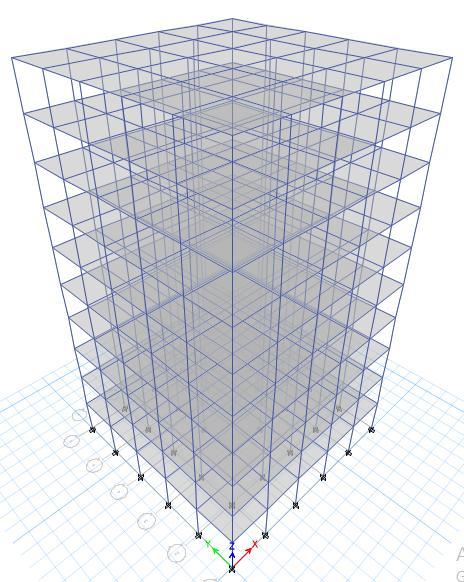
Fig -3:Planand3DModelofNormalBuilding
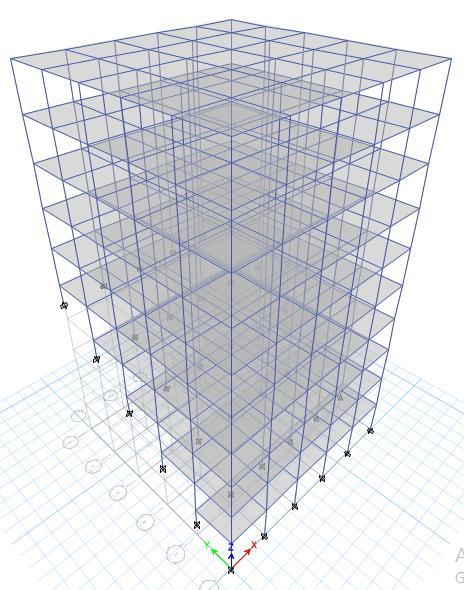
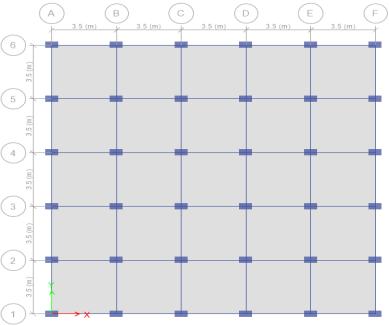
Fig -4:Planand3DModelofSlopedBuilding
International Research Journal of Engineering and Technology (IRJET) e-ISSN:2395-0056
Volume: 09 Issue: 12 | Dec 2022 www.irjet.net p-ISSN:2395-0072
Fig -5:Planand3DModelofSlopedBuildingwithDiagonal Bracing
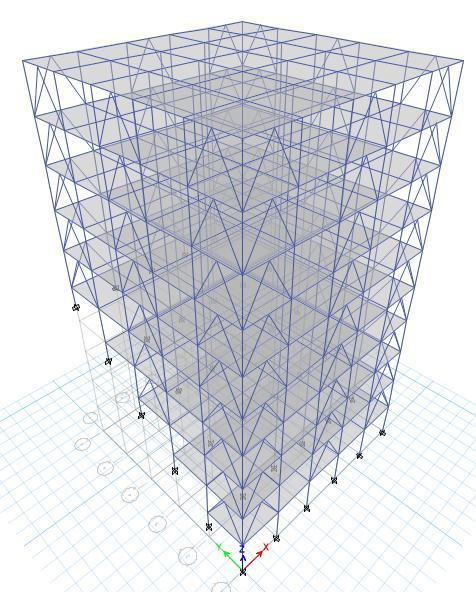
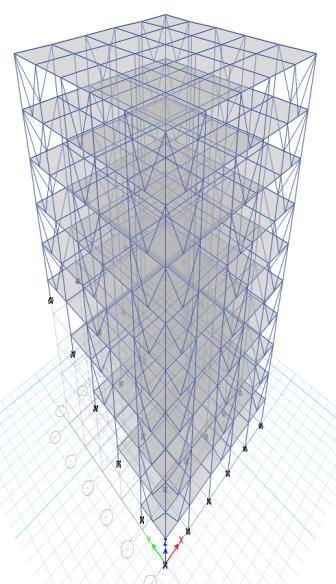
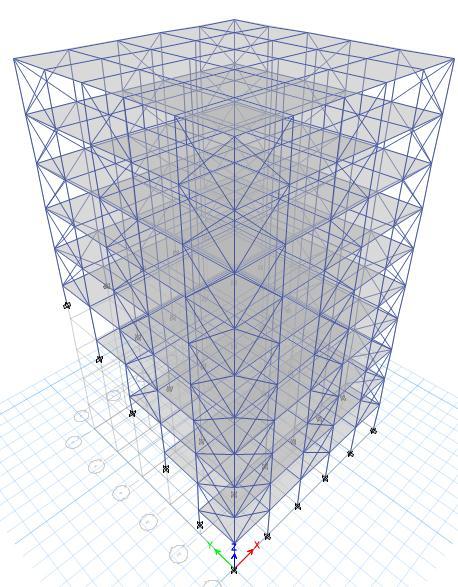
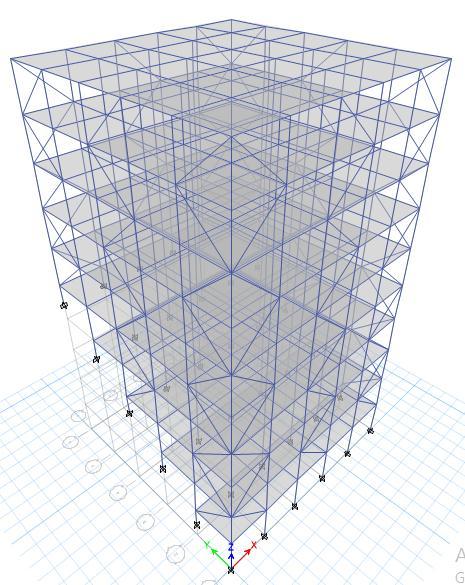
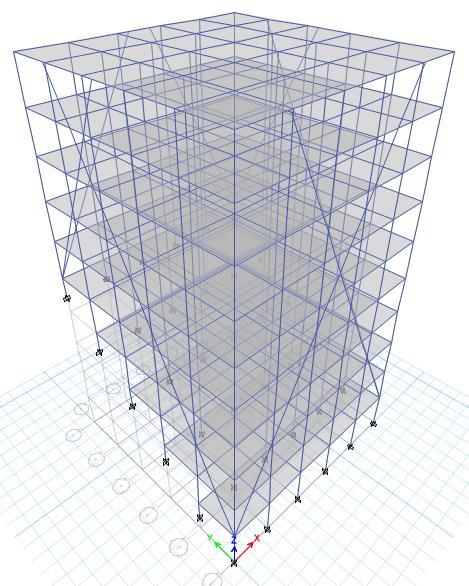
Fig -7:Planand3DModelofSlopedBuildingwithV Bracing
Fig -6:Planand3DModelofSlopedBuildingwithX Bracing
Fig -8:Planand3DModelofSlopedBuildingwithInverted VBracing
2022, IRJET | Impact Factor value: 7.529 | ISO 9001:2008 Certified
International Research Journal of Engineering and Technology (IRJET) e-ISSN:2395-0056
Volume: 09 Issue: 12 | Dec 2022 www.irjet.net p-ISSN:2395-0072
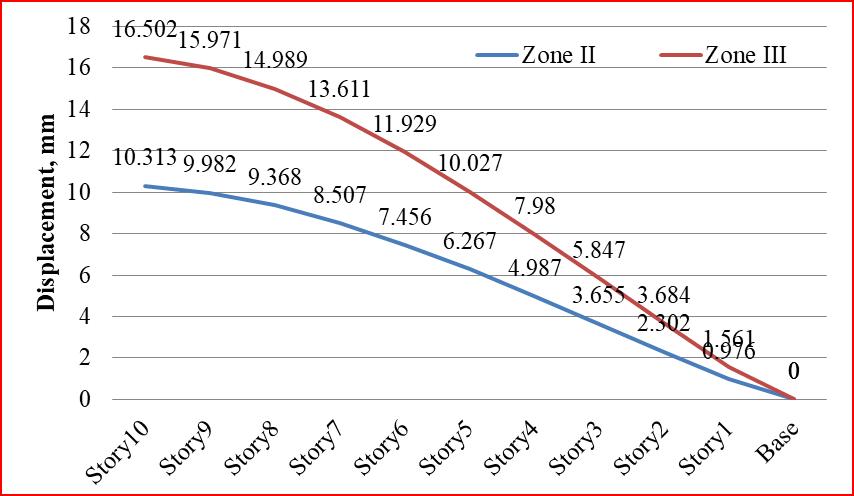
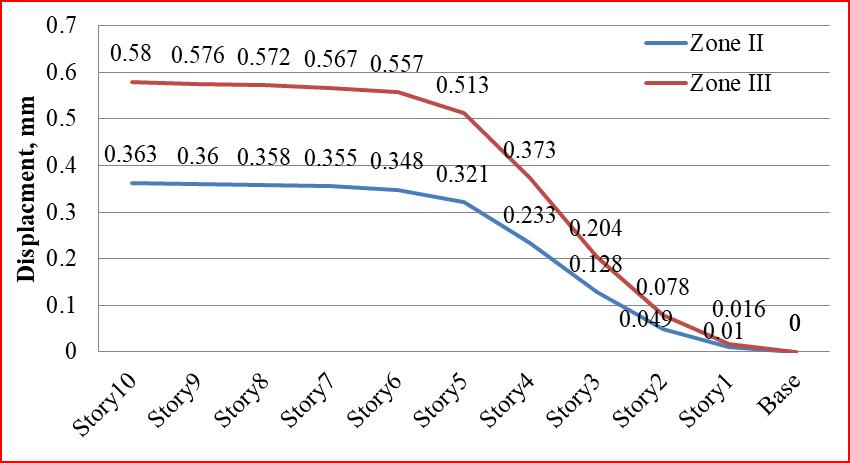
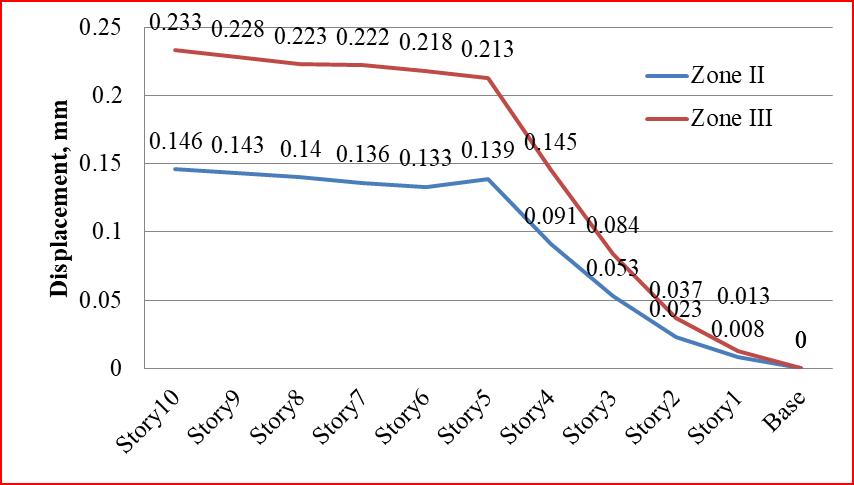
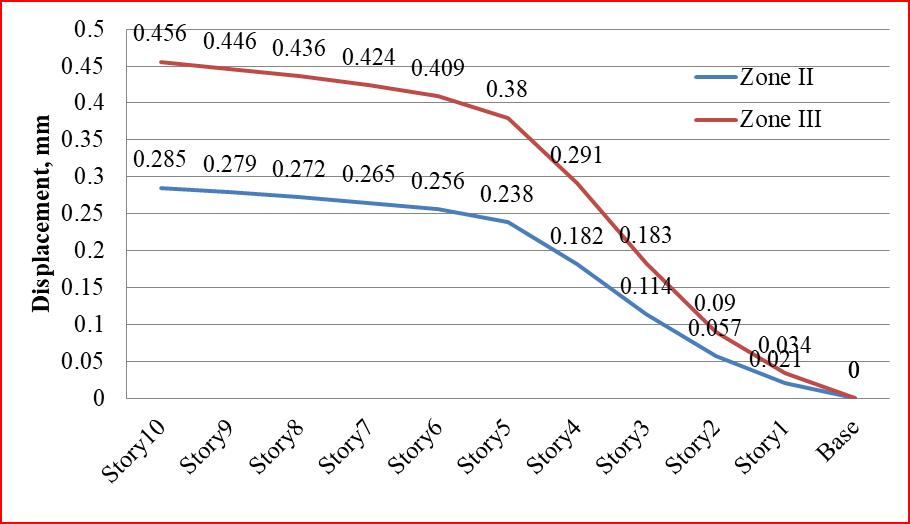
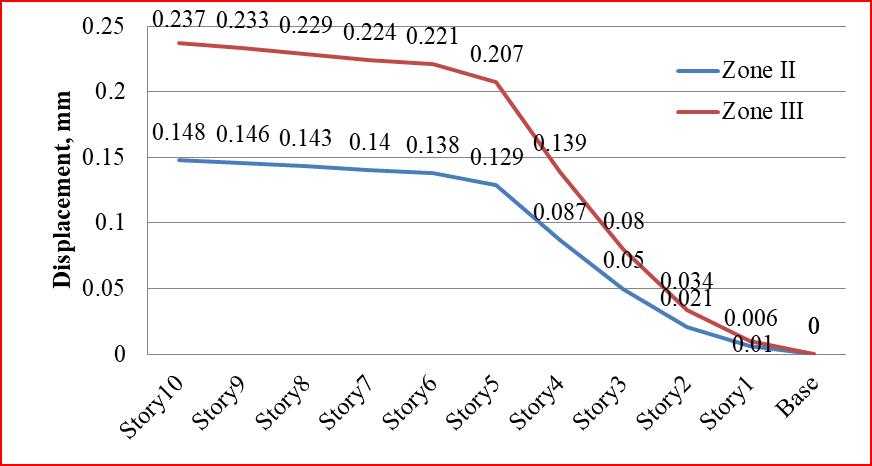
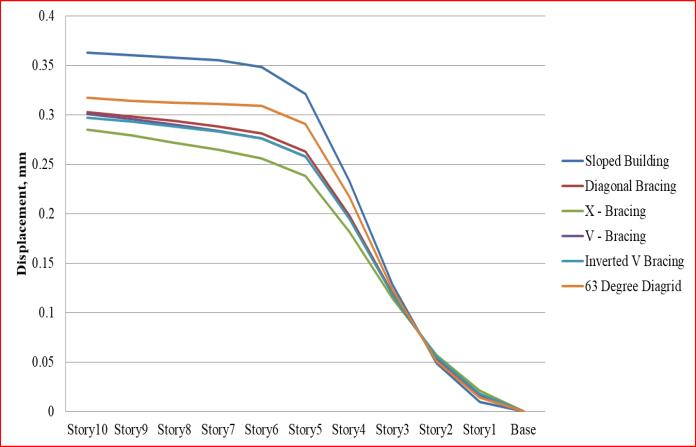
The displacement increases as the number of seismiczonesincreases,ascanbeseeninchart2.Whenthe topstoreyistakenintoaccount,thedisplacementincreases byabout37.50%.
Thedisplacementincreasedby37.50%forboththe EQX and EQY loads, but the EQY load experienced the greatestdisplacementinseismiczonesIIandIII.
Fig -9:Planand3DModelofSlopedBuildingwith630 DiagridBracing
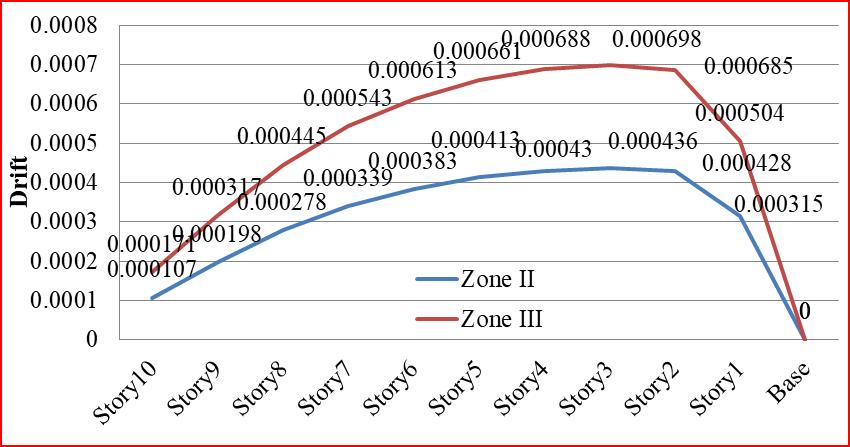
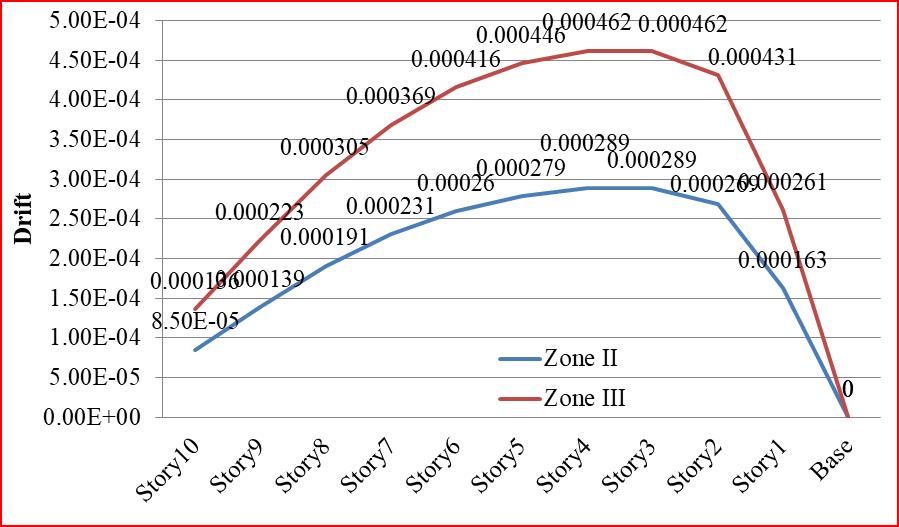
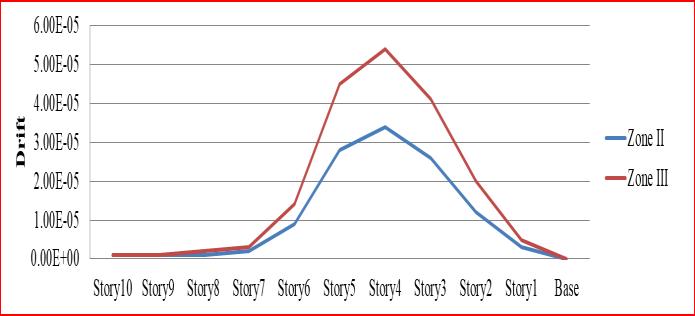
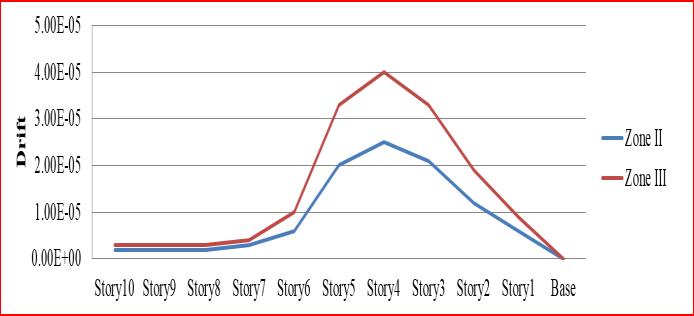
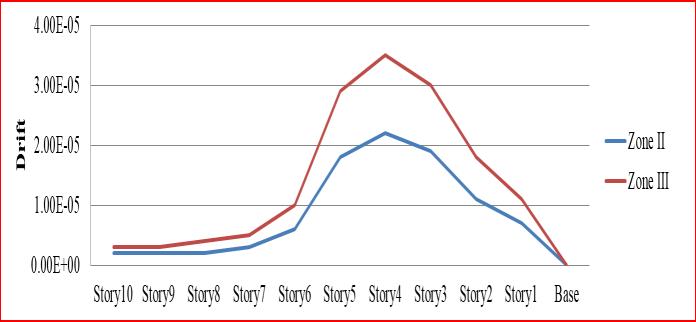
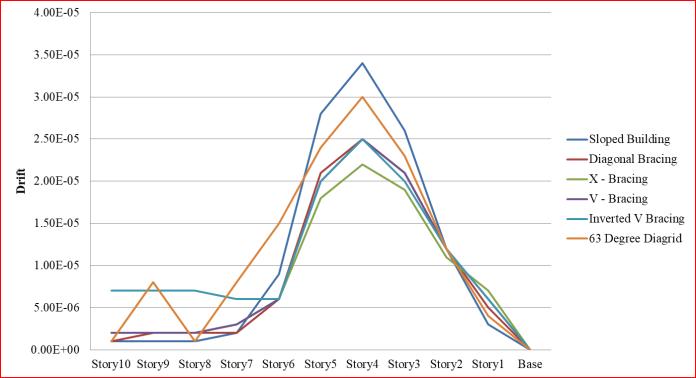
Accordingtochart3,thestoreys3and4experience thegreatestdriftwhencomparedtotheotherstoreys.When comparedtoseismiczoneII,seismiczoneIIIhasmaximum drift,whichhasincreasedby37.44%.
The displacement rises as the number of seismic zones increases, as can be seen in chart 1. When the top storeyistakenintoaccount,thedisplacementincreasesby about37.50%.
Chart
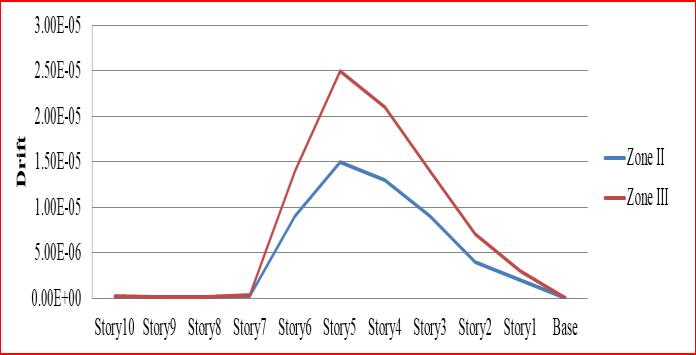
As can be seen from chart 4, the storey with the greatest amount of drift is storey 3. When compared to seismic zone II, seismic zone III has a 37.53% increase in maximumdrift.
Although there was a 37.53% increases in displacement and 37.44% increases in drift for the EQX loads,theEQYloadexperiencedthegreatestdriftinseismic zonesIIandIII.Whencomparedtotheotherstories,story3 isexperiencingthemostdrift.
International Research Journal of Engineering and Technology (IRJET) e-ISSN:2395-0056
Volume: 09 Issue: 12 | Dec 2022 www.irjet.net p-ISSN:2395-0072
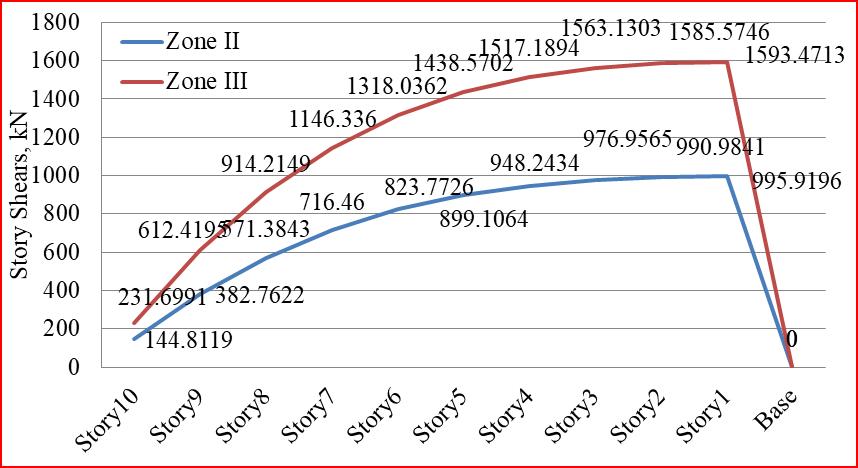
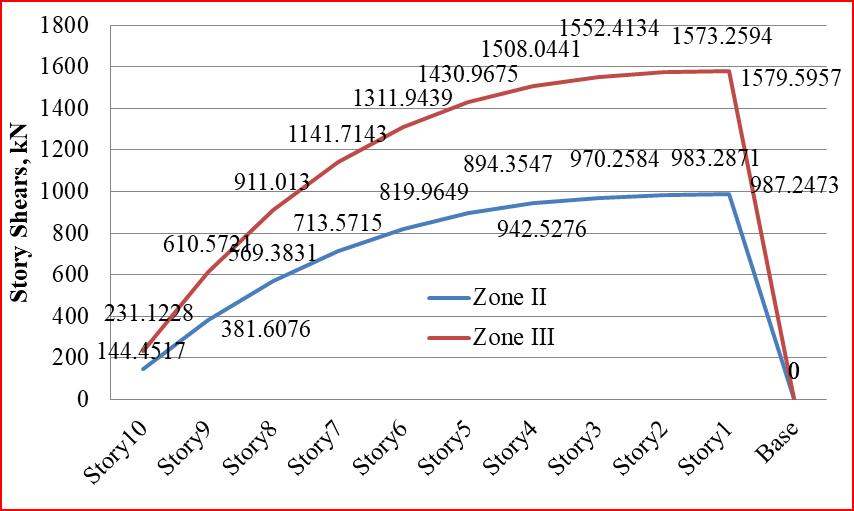
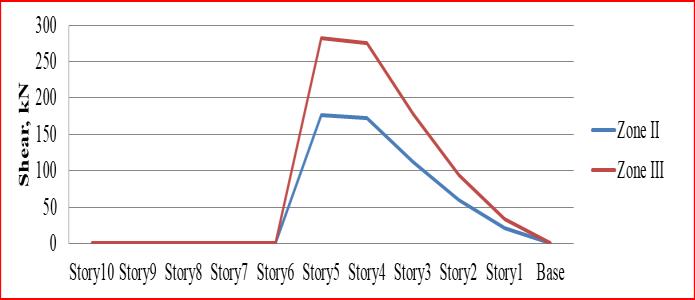
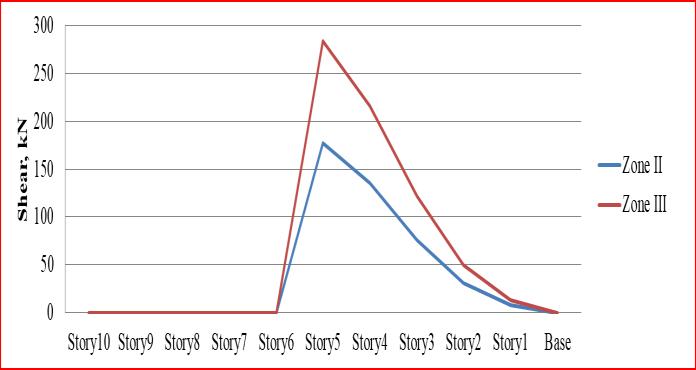
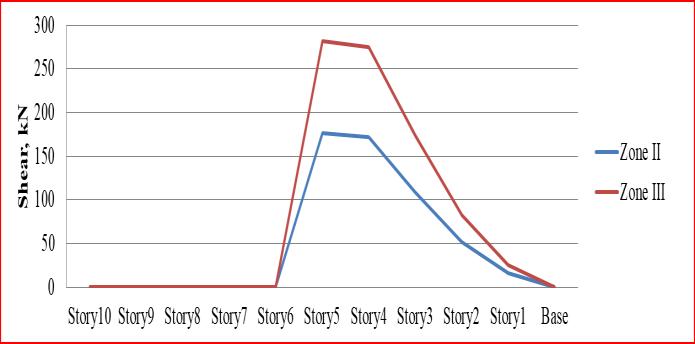
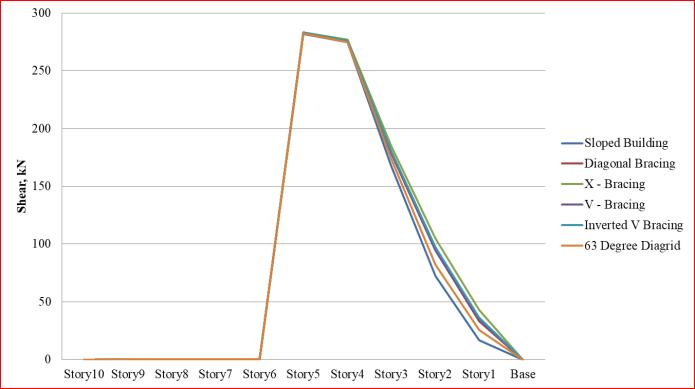
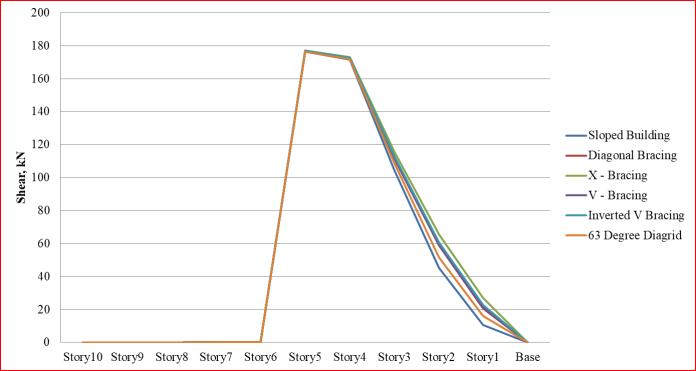
Chart5demonstratesthat,whencomparedtothe otherstoreys,storey1experiencesthegreatestamountof storyshear.WhencomparedtoseismiczoneII,seismiczone IIIexhibitsmaximumshear,whichhasincreasedby37.50%.
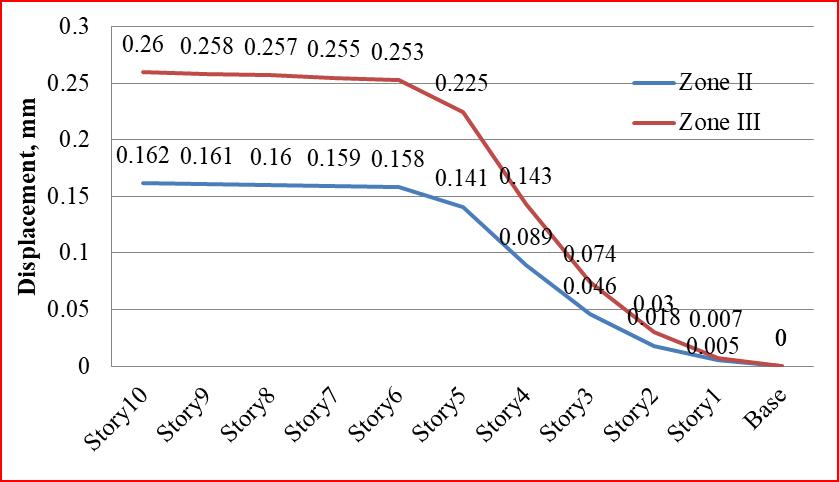
Figure5.8showsthatastheseismiczonesexpand, thereisanincreaseindisplacement.Whenthetopstoreyis taken into account, the displacement increases by about 37.41%.
Chart6demonstratesthat,whencomparedtothe otherstoreys,storey1experiencesthegreatestamountof storyshear.WhencomparedtoseismiczoneII,seismiczone IIIexhibitsmaximumshear,whichhasincreasedby37.50%.
TheshearforEQXandEQYloadsincreasedbythe same37.50%, butEQY loadshear washighestforseismic zonesIIandIII.Whencomparedtootherstories,story1has themostshear
The displacement increases as the number of seismiczonesincreases,ascanbeseeninchart8.Whenthe topstoreyistakenintoaccount,thedisplacementincreases byabout37.70%.
The displacement for EQX load increased by 37.41%,whileEQYloadincreasedby37.70%,butEQXload experienced the greatest displacement in seismic zones II andIII.Whencomparedtootherstories,thedisplacementin story1isatitshighest.
International Research Journal of Engineering and Technology (IRJET) e-ISSN:2395-0056
Volume: 09 Issue: 12 | Dec 2022 www.irjet.net p-ISSN:2395-0072
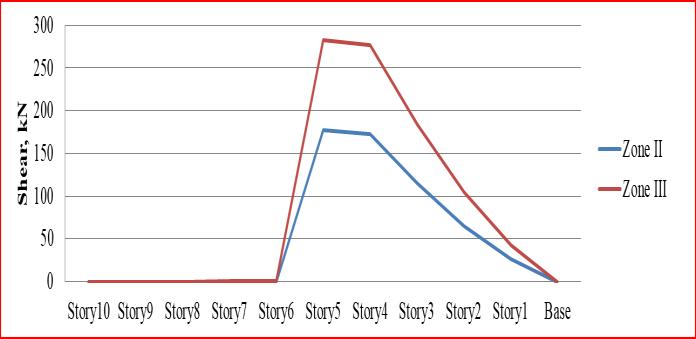
Chart 11 and 12 show that the maximum shear obtainedinstory5isnearlyidenticaltothevaluesobtained fortheEQXandEQYloadforbothseismiczonesIIandIII. Thereisa37.50%increasewhencomparingseismiczoneII toseismiczoneIII.
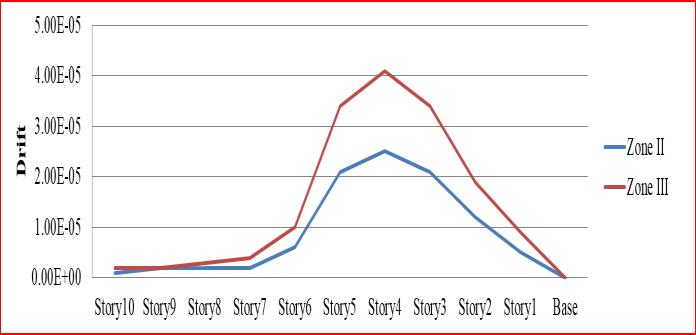
Ascanbeseenfromchart9,forbothseismiczones II and III, the maximum drift is found at story 4. When comparedtoseismiczoneIII,thedrifthasincreasedby37%.
Fromchart10,itcanbeseenthatforseismiczones II and III, the maximum drift occurs at story 5. When compared to seismic zone III, the drift has increased by 34.61%.
Althoughtherewasa37%increaseinthedriftfor EQXloadanda34.61%increaseforEQYload,theEQXload experiencedthegreatestdriftinseismiczonesIIandIII.
Chart -13: StoreyDisplacementforEQXLoad
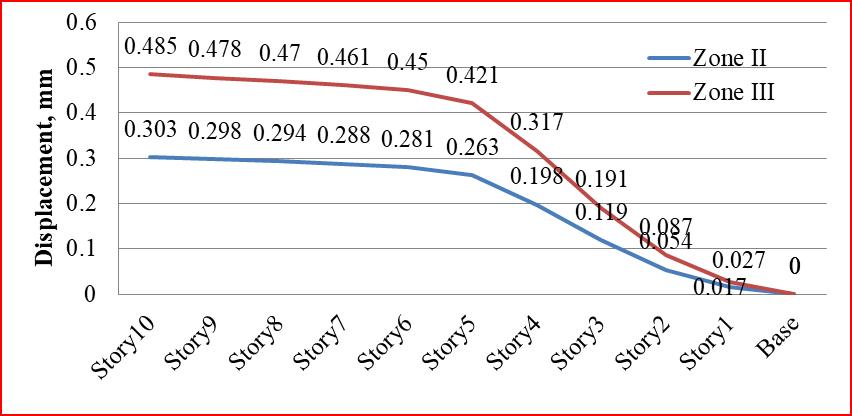
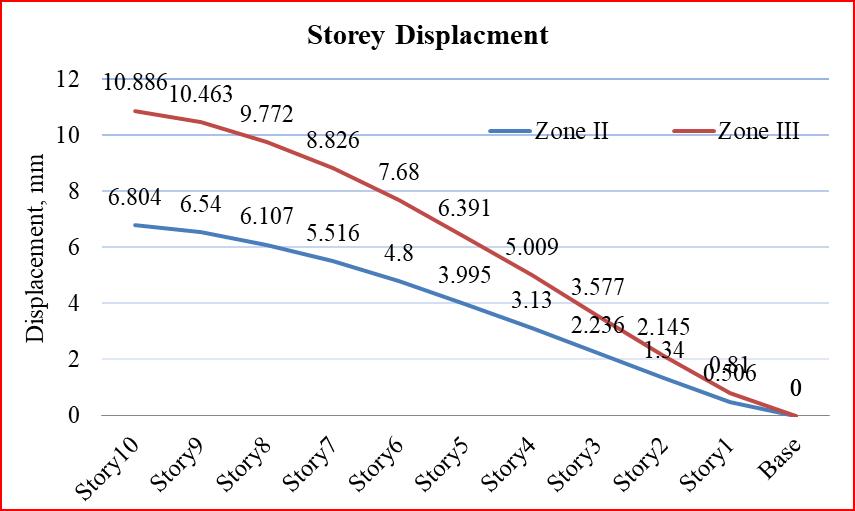
Chart13illustrateshowthedisplacementincreases alongwiththeseismiczone.Displacementhasincreasedby 37.52%fromseismiczoneIItoseismiczoneIII.
Chart -11: StoreyShearsforEQXLoad
Chart -14: StoreyDisplacementforEQYLoad
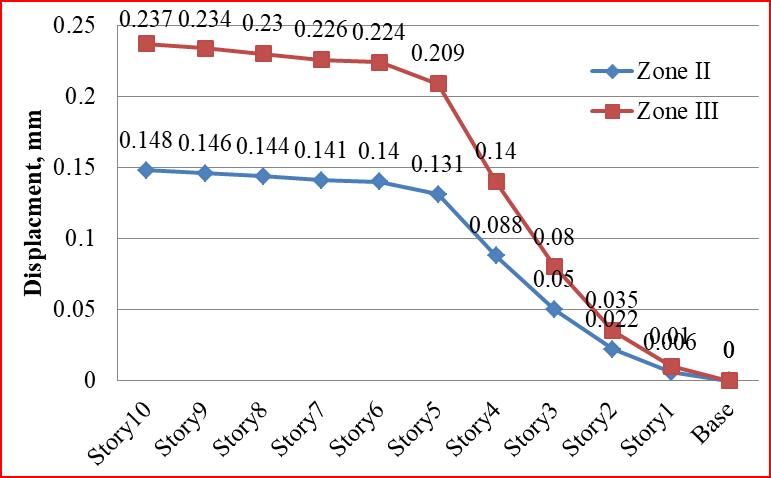
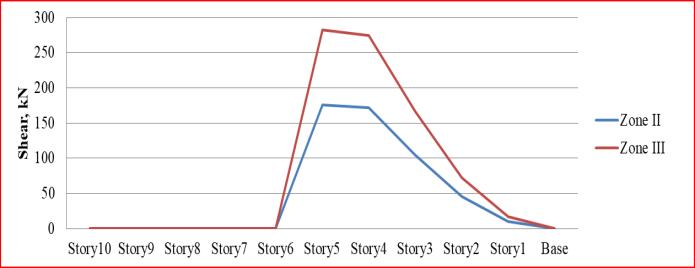
Chart14illustrateshowthedisplacementincreases alongwiththeseismic zone. Displacementisincreased by 37.55%fromseismiczoneIItoseismiczoneIII.
Chart 13 and 14 above show that the top story receivedtheEQXload'smaximumdisplacement.
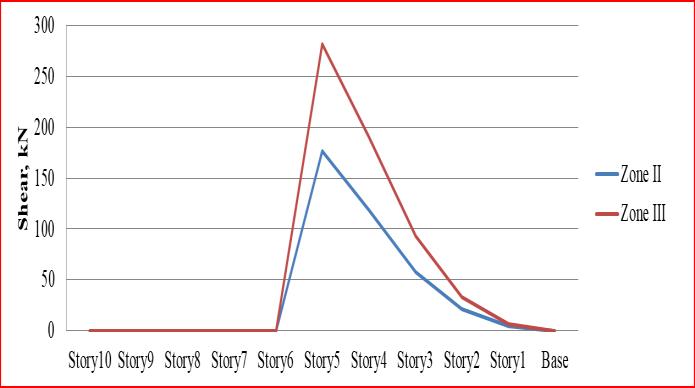
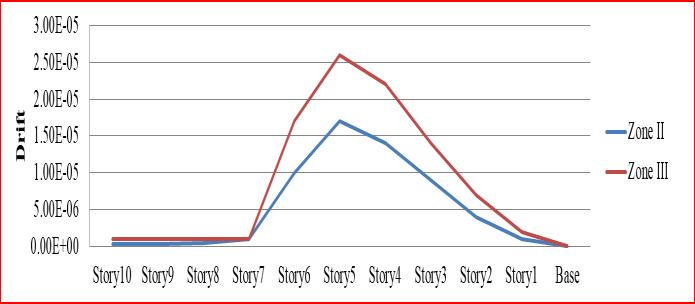
Chart -12: StoreyShearsforEQYLoad
International Research Journal of Engineering and Technology (IRJET) e-ISSN:2395-0056
Volume: 09 Issue: 12 | Dec 2022 www.irjet.net p-ISSN:2395-0072
Chart17and18showthatthedriftincreasesasthe seismiczonesexpandandthatthemaximumshearforboth the EQX and EQY load occurs in story 5. Additionally, the valuesobtainedwitha37.50%increaseinpercentagefrom seismiczoneIItozoneIIIarenearlyidentical.
Chart -15: StoreyDriftforEQXLoad
Chart -16: StoreyDriftforEQYLoad
Chart 15 and 16 show that the drift rises as the number of seismic zones rises, reaching its maximum in stories4and5respectively,fortheEQXloadandtheEQY load.

However,whencomparedtotheEQYload,theEQX loadexhibitsthegreatestdrift.TheEQXloadincreasesby 39%andtheEQYloadby36.36%whenseismiczoneIIand zoneIIIarecompared.
Chart -19: StoreyDisplacementforEQXLoad
As can be seen from chart 19, there is a displacementincreaseof37.50%whencomparedtoseismic zonesIIandIII.
Chart -17: StoreyShearsforEQXLoad
Chart -20: StoreyDisplacementforEQYLoad
As can be seen from chart 20, there is a 37.33% increase in displacement from seismic zone II to seismic zoneIII.
Chart19and20showthemaximumdisplacement obtainedfortheEQXloadwhencomparedtotheEQYload.
Chart -18: StoreyShearsforEQYLoad
International Research Journal of Engineering and Technology (IRJET) e-ISSN:2395-0056
Volume: 09 Issue: 12 | Dec 2022 www.irjet.net p-ISSN:2395-0072
Chart23and24 showthatthevaluesobtainedfor theEQXandEQYloadsinstory5arenearlyidentical.The shearalsogrowsastheseismiczonedoes.Whencompared toseismiczonesIIandIII,theshearincreasedby37.50%.
Chart -21: StoreyDriftforEQXLoad
Chart -22: StoreyDriftforEQYLoad
Chart 21 and 22 show that there is a 37.14% increaseindriftforEQXloadforstory4wherethemaximum driftoccurredanda35%increaseindriftforEQYloadfor story5wherethemaximumdriftoccurredwhencompared toseismiczoneIItoseismiczoneIII,respectively.EQXload experiencedthehighestdrift.
Accordingtochart25,thedisplacementforthetop story has increased by 37.42% in comparison to seismic zonesIIandIII.
Chart -23: StoreyShearsforEQXLoad
Chart -26: StoreyDisplacementforEQYLoad
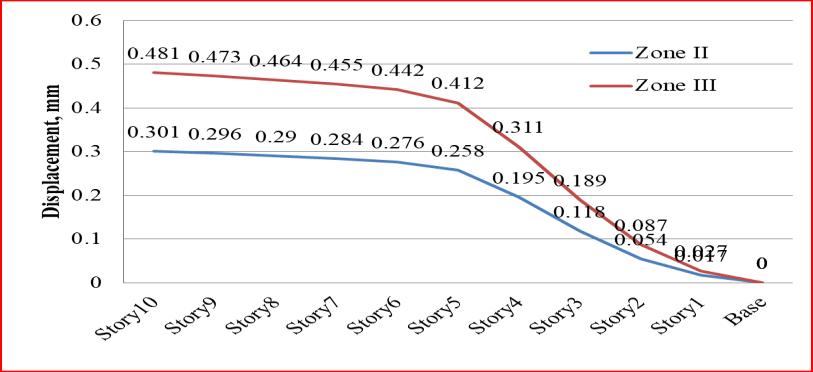
Chart 26 shows that, for the top story, there is a displacementincreasefromseismiczoneIItoseismiczone IIIof37.55%.
Chart25and26showthemaximumdisplacement obtainedfortheEQXloadwhencomparedtotheEQYload.
Chart -24: StoreyShearsforEQYLoad
Chart -27: StoreyDriftforEQXLoad
International Research Journal of Engineering and Technology (IRJET) e-ISSN:2395-0056
Volume: 09 Issue: 12 | Dec 2022 www.irjet.net p-ISSN:2395-0072
Chart 27 and 28 show that, for the EQX load for story 4, where the maximum drift occurred, there is a 37.50%increaseinthedriftwhencomparedtoseismiczone IItoseismiczoneIII,andfortheEQYloadforstory5,where themaximumdriftoccurred,thereisa36.36%increasein thedriftwhencomparedtoseismiczoneIItoseismiczone III.TheEQXloadexperiencedthehighestdrift.
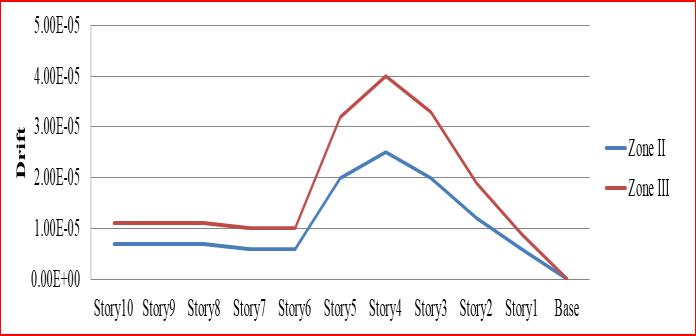
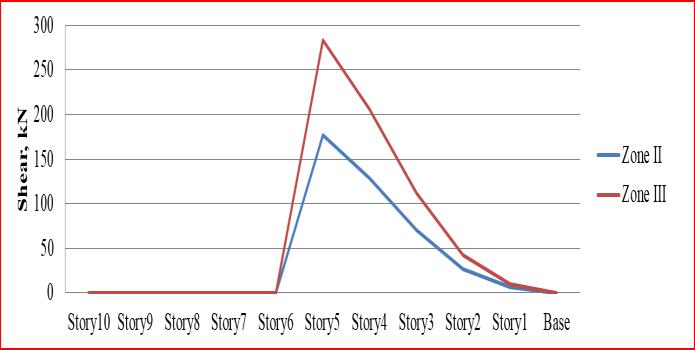
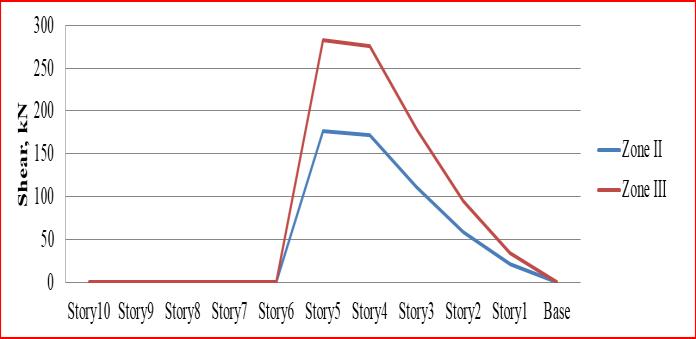
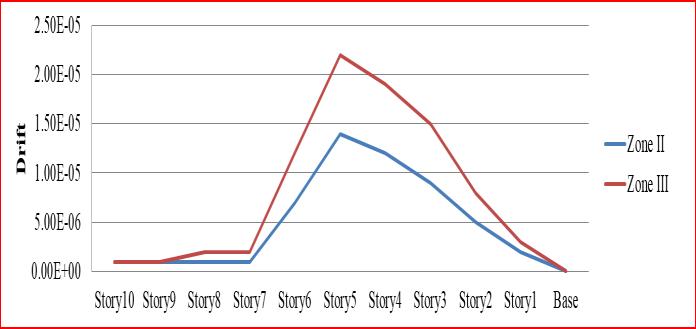
Chart -31: StoreyDisplacementforEQXLoad
Accordingtochart31,thedisplacementforthetop story has increased by 37.47% when compared to the seismiczonesIIandIII.
Chart -32: StoreyDisplacementforEQYLoad
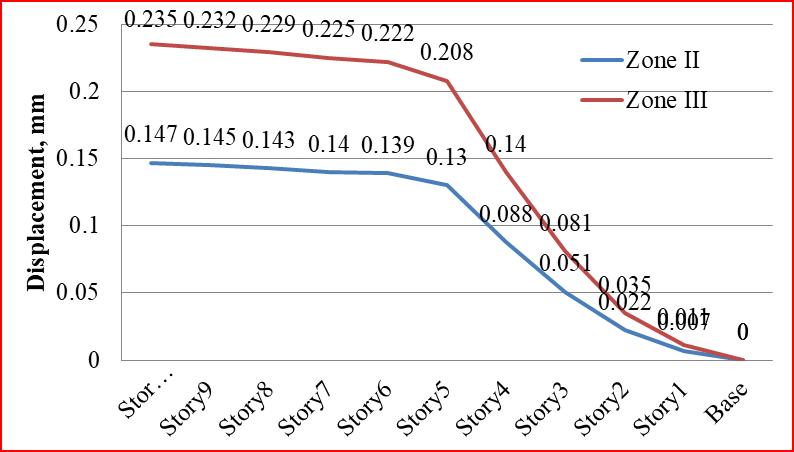
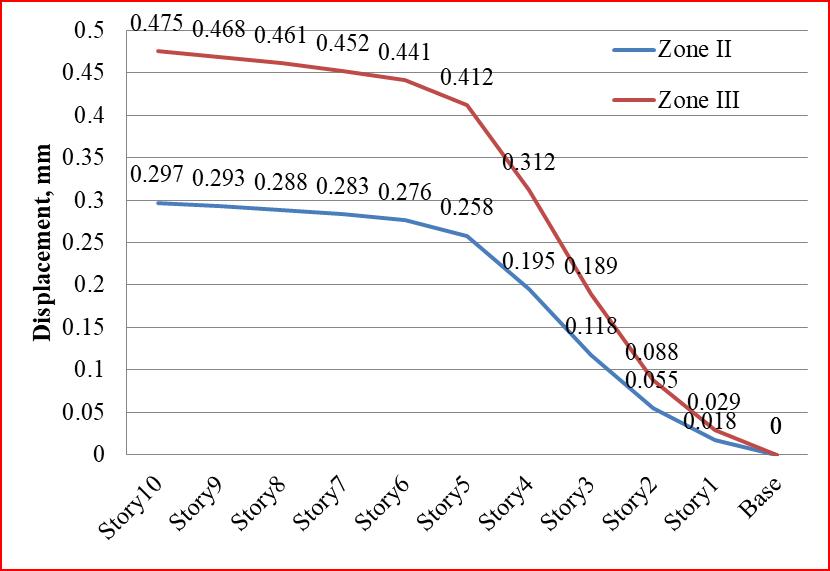
Chart 32 shows that, for the top story, there is a 37.44% increase in displacement from seismic zone II to seismiczoneIII.
Chart31and32showthemaximumdisplacement obtainedfortheEQXloadwhencomparedtotheEQYload.
Itcanbeseenfromchart29and30thatthevalues obtained for the EQX and EQY loads in Story 5 are almost identical. The shear also grows as the seismic zone does. When compared to seismic zones II and III, the shear increasedby37.50%.
Chart -33: StoreyDriftforEQXLoad
International Research Journal of Engineering and Technology (IRJET) e-ISSN:2395-0056
Volume: 09 Issue: 12 | Dec 2022 www.irjet.net p-ISSN:2395-0072
Chart -34: StoreyDriftforEQYLoad
Chart 33 and 34 show that there is a 37.50% increaseindriftforEQXloadforstory4wherethemaximum driftoccurredanda36.36%increaseindriftforEQYloadfor story5wherethemaximumdriftoccurredwhencompared toseismiczoneIItoseismiczoneIII,respectively.EQXload experiencedthehighestdrift.
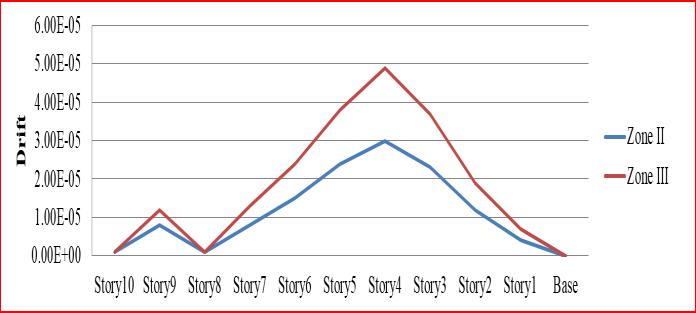
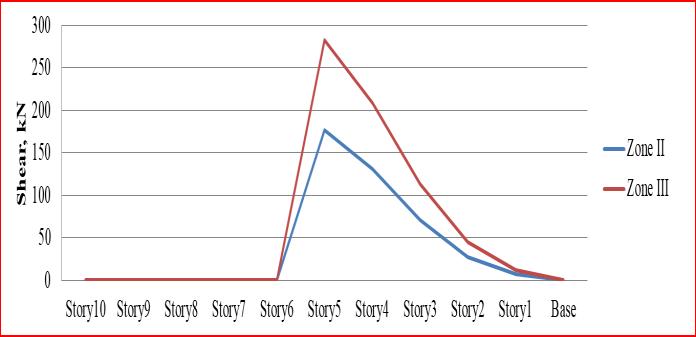
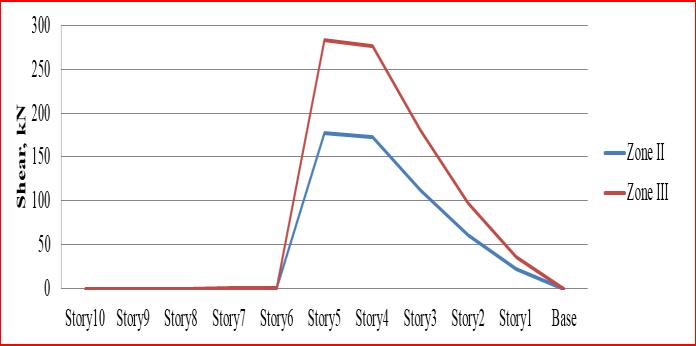
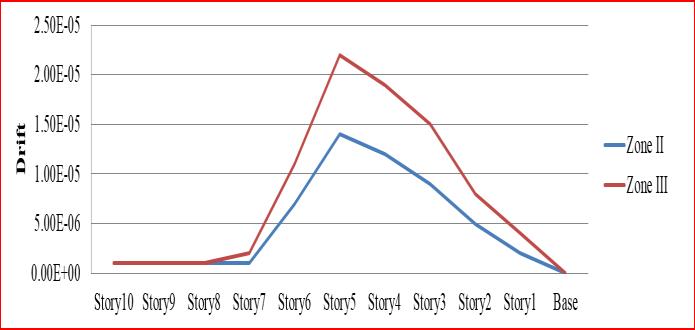
Chart -37: StoreyDisplacementforEQXLoad
Chart 37 shows that the displacement for the top story has increased by 37.35 percent when compared to seismiczonesIIandIII.
Chart -35: StoreyShearsforEQXLoad
Chart -38: StoreyDisplacementforEQYLoad
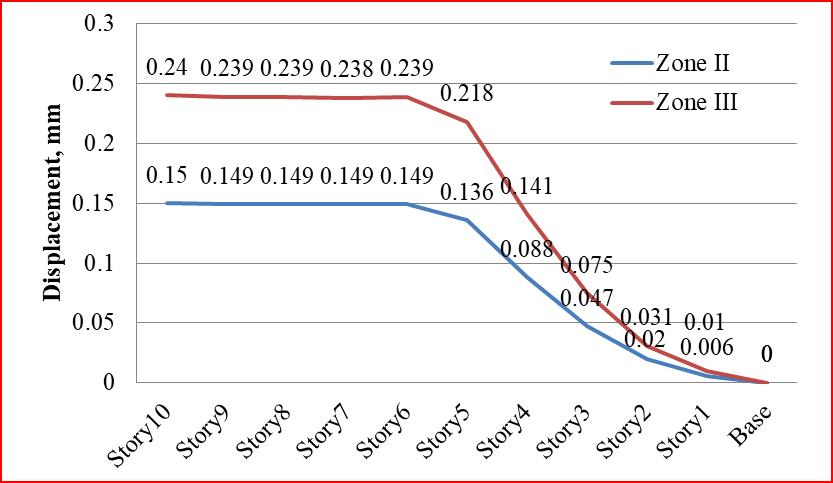
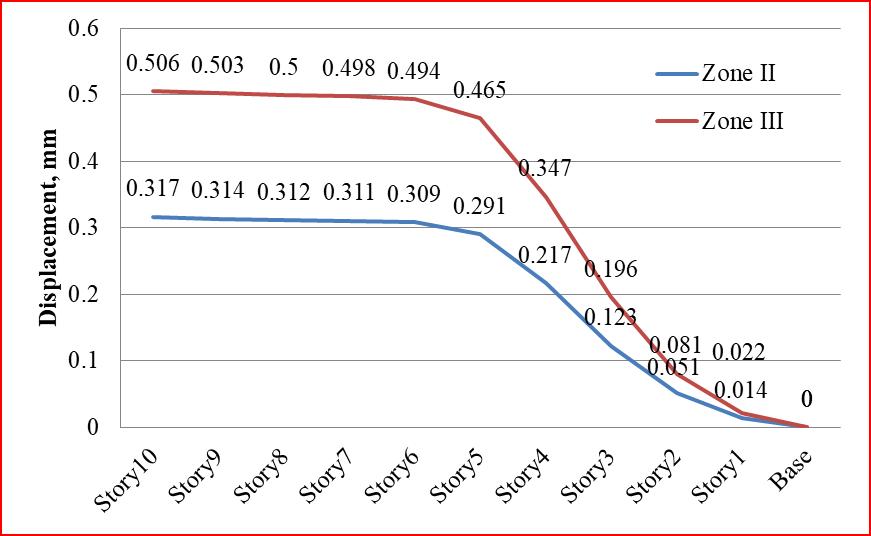
Chart 38 shows that, for the top story, there is a displacement increase of 37.50% from seismic zone II to seismiczoneIII.
Chart37and38showthemaximumdisplacement obtainedfortheEQXloadwhencomparedtotheEQYload.
Chart -36: StoreyShearsforEQYLoad
Chart35and36showthatthevaluesobtainedfor theEQXandEQYloadsinstory5arenearlyidentical.The shearalsogrowsastheseismiczonedoes.Whencompared toseismiczonesIIandIII,theshearincreasedby37.50%.
Chart -39: StoreyDriftforEQXLoad
International Research Journal of Engineering and Technology (IRJET) e-ISSN:2395-0056
Volume: 09 Issue: 12 | Dec 2022 www.irjet.net p-ISSN:2395-0072
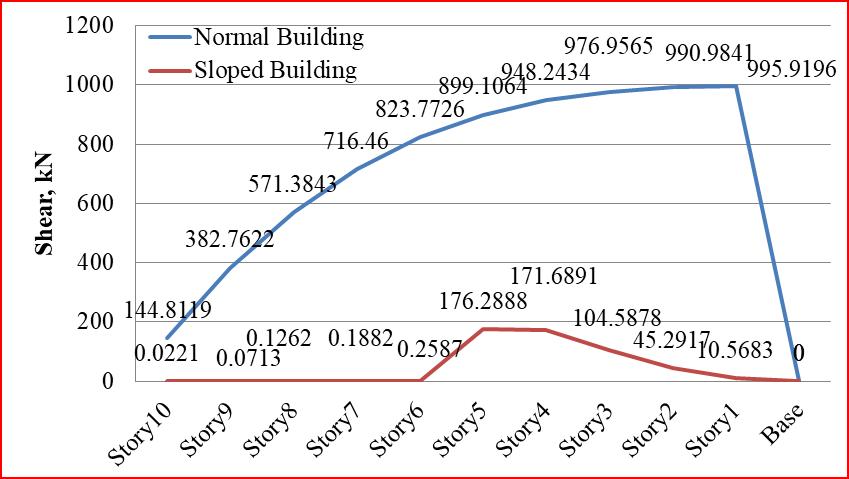
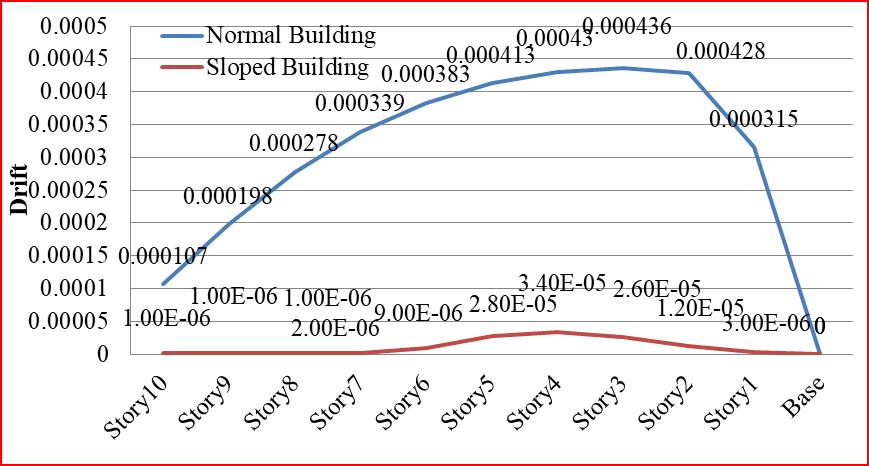
Chart 39 and 40, it can be seen that the drift increased by 38.776 percent for the EQX load for story 4, wherethemaximumdriftoccurred,andby40%fortheEQY loadforstory5,wherethemaximumdriftoccurred,when comparedtoseismiczonesIIandIII,respectively.TheEQX loadexperiencedthehighestdrift.
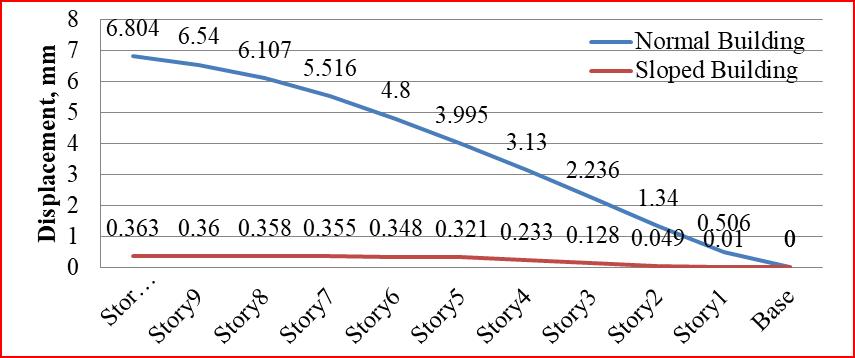
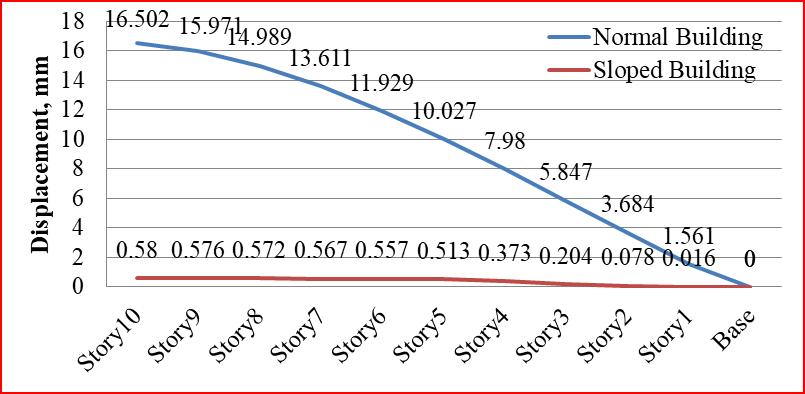
Whenabuildingisbuiltinaslopedorhillyarea,the displacementofthestoriesisreducedby94.66%,ascanbe seeninchart43.
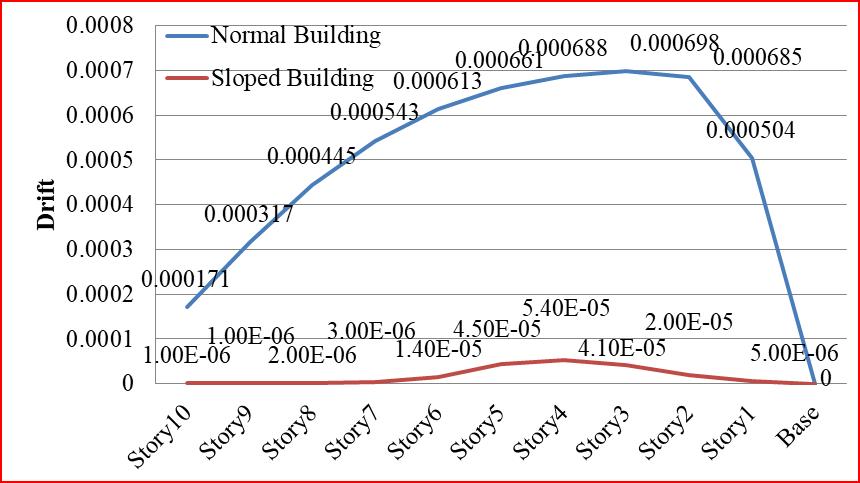
When a building is built in a hilly or sloped area, comparedtoanormalbuilding,thestorydriftisreducedby 92.20%,ascanbeseeninchart44.
Chart41and42showthatthevaluesobtainedfor theEQXandEQYloadsinstory5arealmostidentical.The shearalsogrowsastheseismiczonedoes.Whencompared toseismiczonesIIandIII,theshearincreasedby37.50%.
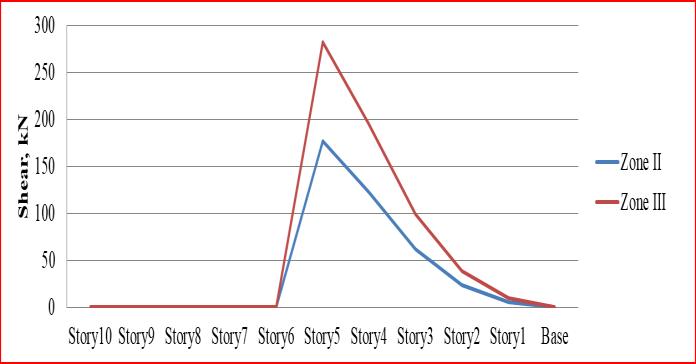
Chart -44: StoreyShear
International Research Journal of Engineering and Technology (IRJET) e-ISSN:2395-0056
Volume: 09 Issue: 12 | Dec 2022 www.irjet.net p-ISSN:2395-0072
Whenabuildingisbuiltinahillyorslopedarea,as opposedtoaflatarea,thereisan82.30%reductioninthe storyshear,asshowninchart44.
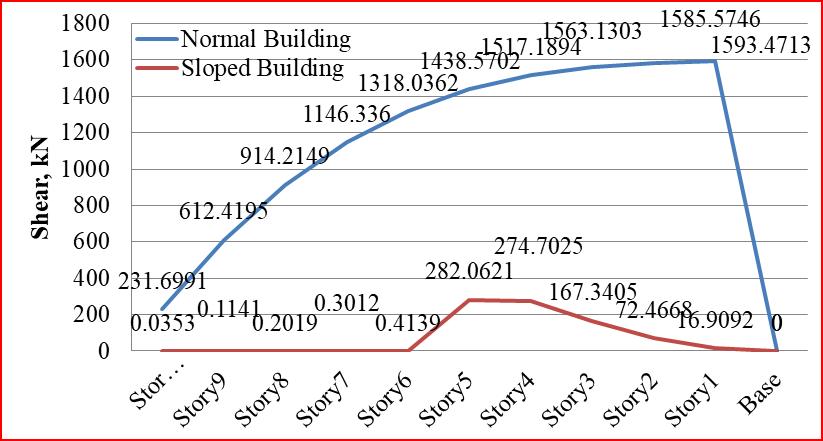
When a building is built in a hilly or sloped area, comparedtoanormalbuilding,thestoryshearisreducedby 82.30%,ascanbeseeninchart47.
Whenabuildingisbuiltinaslopedorhillyarea,the displacementofthestoriesisreducedby96.48%,ascanbe seeninFigure5.47.
Asshowninchart48,thereisareductionindisplacement whenbracingsanddiagridareused.Thegreatestreduction wasobtainedwhenweprovidedX-bracingincomparisonto othersby21.48%.
When a building is built in a hilly or sloped area, comparedtoanormalbuilding,thestorydriftisreducedby 92.28%,ascanbeseeninchart46.
Asshowninchart49,there isa reductionindrift when bracings and diagrid are used. The maximum reductionobtainedwhenweofferX-bracingincomparison tootherswas35.29%.Thereisan11.76%decreasewhen the630diagridisprovided.
International Research Journal of Engineering and Technology (IRJET) e-ISSN:2395-0056
Volume: 09 Issue: 12 | Dec 2022 www.irjet.net p-ISSN:2395-0072
Asshowninchart52,there isa reductionindrift when bracings and diagrid are used. The maximum reductionobtainedwhenweofferX-bracingincomparison tootherswas35.18%.Thereisa9.26%decreasewhenthe 630 diagridisprovided.
Chart50showsthattheshearvaluesforthevarious types of bracings and the diagrid are almost identical or nearlyidentical,indicatingthatthereislittlevariationinthe shear.
As shown in chart 51, there is a reduction in displacement when bracings and diagrid are used. The greatest reduction was obtained when we provided Xbracingincomparisontoothersby21.37%.The630diagrid resultsina12.75%reduction.
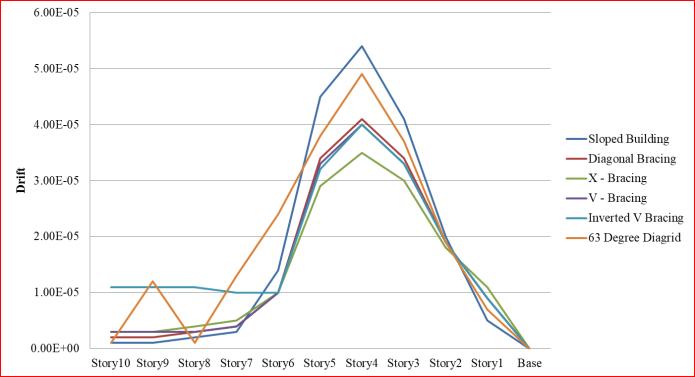
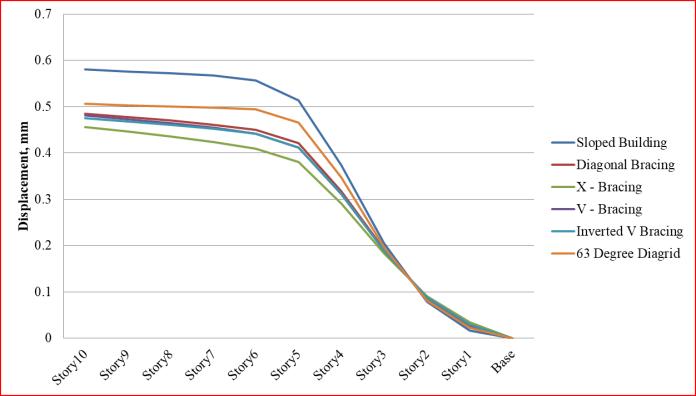
Chart53demonstratesthatthereislittlevariation intheshear,withnearlyidenticalvaluesbeingobtainedfor thediagridaswellasforthevarioustypesofbracings.
This is difficult to pinpoint in what requirements and preparewillbethemostefficientsincetherewouldseemto notbeanywidespreadabilitytoaddressallissueplease.A few systems are best adapted when such things are considered,buttheyhavedownsidesoveranother.Themain findingsbasedontheinvestigationpresentedinChapter5.
1. Housingonslopedlandacrosstheedgeofahillcan improveaircirculationinsidearesidence.
2. Evenbeforeparticularlyincomparisontohousing developments on flat terrain encircled by other structures,newhousesonmountainsidesaremuch moreenergyintensive.
3. Mountainsideassetsfrequentlyhavebreathtaking views.Agreateraltitudeprovidesspectacularviews of ones surroundings, even if they are of the beautifulmountainsorthepeacefulocean.
4. Constructing on sloping land necessitates the addendum of more storey level in order to maximise room and eventually expand vertical positioninsteadoflaterally.
5. Adesignconsiderationsusedintheresearchmeet thelimitsallowedbyIndianStandards.
6. As the seismic zones expand, so do the design parameters.
International Research Journal of Engineering and Technology (IRJET) e-ISSN:2395-0056
Volume: 09 Issue: 12 | Dec 2022 www.irjet.net p-ISSN:2395-0072
7. Whenbracingsanddiagridareinstalledinsloped buildings, displacement and drift are reduced by 10%to35%ineachseismiczone.
8. For each seismically active region, there is no discerniblechangewithinstoryshears,whichare nearlyidenticaltothevaluesweobtained.
9. ThegreatestreductionweobtainedforX-bracingin comparisontootherbracingsanddiagrid.
10. Whenever the diagrid was applied to sloped buildings,itdidnotresultinasignificantreduction whentriedtocomparetoaX-bracing.
1. Saurav Kumar Verma, Hrishikesh Dubey, ‘Seismic Performance of Buildings with Various ConfigurationsinHillyRegions’, Civil Engineering andArchitecture9(7):2205-2236,2021.
2. Anjeet Singh Chauhan, Rajiv Banerjee, ‘Seismic ResponseofIrregularBuildingonSlopingGround’, International Journal of Advanced Research in EngineeringandTechnology(IJARET),Volume12, Issue5,May2021.
3. Prof.Tejaswini junghare , Ravikumar Yadav, Bhushan Rathod, Pawan Ranbawale, ‘Seismic Analysis on Irregular Structures’, International JournalforResearchinEngineeringApplication& Management (IJREAM), ISSN : 2454-9150 Vol-05, Issue-11,Feb2020.
4. Mr.AnujKumarSharma, Mr.AmitKumar,‘Analysis of G+30 Highrise Buildings by Using Etabs for Various Frame Sections in Zone IV and Zone V’, International Journal for Research in Engineering andEmergingTrends(IJREET),Volume4,Issue2, Oct,2020.
5. PhataleSwarupSanjay,Prof.S.R.Parekar,‘Seismic analysis of Step-back building resting on sloping ground considering different types of Bracing system’,InternationalJournalforModernTrendsin ScienceandTechnology,ISSN:2455-3778::Volume: 05,IssueNo:07,July2019.
6. Mohd Arshad Mohd Mazher, Prof. Sarang S Padmawar, ‘Seismic Behaviour of RC Framed BuildingsofDifferentConfigurationsRestingonHill Slopes’,IJSRD-InternationalJournalforScientific Research&Development|Vol.7,Issue04,2019.
7. M.Hasan,N.H.M.K.Serker,‘SeismicAnalysisofRC BuildingsRestingonSlopingGroundwithVarying Hill Slopes’, Proceedings of International
Conference on Planning, Architecture and Civil Engineering,07-09February2019.
8. MohdAkifRazi,ZaidMohammad andS.AshrafAli, ‘Seismic Analysis of Hill Buildings’, International ConferenceonAdvancesinConstructionMaterials andStructures(ACMS-2018)IITRoorkee,Roorkee, Uttarakhand,India,March7-8,2018.
9. VedanteePrasadShukla,SayaliPradeepRote,Manoj BharatKamble,‘ComparativeAnalysis&Designof Irregular Building & its Behaviour at Different EarthquakeZonebyUsingEtabs&RcdcSoftware’, International of Trend in Scientific Research and Development(IJTSRD),Volume–2Issue–4,MayJun2018.
10. ShreyasMG,VasudevMV,‘AnalysisofRCBuilding RestingonSlopingGround’,InternationalJournalof Science and Research (IJSR) ISSN: 2319-7064, Volume9Issue10,October2020.
11. P.Parimala Vasavi, Dr.G.Sreenivasulu, B.Rohini, ‘Seismic Analysis of Buildings Resting on Sloped Ground and Considering Bracing System Using ETABS’,InternationalJournalofCreativeResearch Thoughts(IJCRT), Volume6,Issue2April2018.
12. DaggupatiRajeswari,MNageswaraRaoandNSiva Prasad Rao, ‘Analysis of multi store symmetrical buildinginzone-iionflatandslopinggroundupto failure by using etabs’, International Journal of AppliedResearch,IJAR2017.
13. ShaikImran,P.Rajesh,‘EarthquakeAnalysisofRCC Buildings on Hilly’, IJSART - Volume 3 Issue 1 –JANUARY2017.
14. Mr.TamboliNikhilVinod,Dr.AjaySwarup,‘Studyof SeismicBehaviourofMulti-StoriedR.C.C.Buildings Resting on Sloping Ground and Bracing System’, IJARIIE-ISSN(O)-2395-4396 6008, Vol-3 Issue-4 2017
15. Ravindra Navale, Dr. Sandeep Hake, Pramod Kharmale, ‘Analysis of Unsymmetrical Building Resting on Sloping Ground by Dividing In 2D Frame’, International Research Journal of EngineeringandTechnology(IRJET)e-ISSN:23950056Volume:04Issue:07, July-2017.