International Research Journal of Engineering and Technology (IRJET) e-ISSN: 2395-0056

Volume: 09 Issue: 12 | Dec 2022 www.irjet.net p-ISSN: 2395-0072
International Research Journal of Engineering and Technology (IRJET) e-ISSN: 2395-0056
Volume: 09 Issue: 12 | Dec 2022 www.irjet.net p-ISSN: 2395-0072
2
1M.E. Student, Department of Civil Engineering and Applied Mechanics, Shri G.S. Institute of Technology and Science, Indore, India
2Professor, Department of Civil Engineering and Applied Mechanics, Shri G.S. Institute of Technology and Science, Indore, India ***
Abstract - The exponential growth of road traffic in recent years has produced problems such as congestion, delays, accidents, and environmental degradation. Trafficcongestion is a true nuisance to the society that affects both developed and developing countries. It affects both personal and public transportation passengers, and develops numerous negative social consequences in addition to diminishing economic efficiency. This paper presents a review of various factors related to traffic congestion, responsible for congestion are identified and impacts of congestion are presented. Major methodologies and remedial measures adopted by various researchers and government are reviewed.Itisconcludedthat the most common factor responsible for congestion is the increase in the number of private vehicle ownership per km road stretch or per million population around the world. Vehicle to road capacity ratio, poor geometricalfeatures,poor lane discipline, insufficient capacity of road for peak hour traffic, road side parking, poor urban systemplanningetc.,are the main factors identified causing the congestion problem. Congestion's most visible effect is an increase in travel time, especially during peak hours. Furthermore, the slow pace of circulation irritates drivers and causes them to act aggressively. It also increasesenvironmentalissuesandcauses health problems. This review paper seeks positive results towards reduction of congestion, travel time delays and more efficient traffic flow on urban roads.
Key Words: Traffic Congestion, Mobility, Traffic Flow, Delay, Geometry, Jam Density.
Due to numerous drawbacks like slower speeds, longer travel times, and increased vehicle queuing, traffic congestion has been a major botheraround the world. Traffic congestion on urban road networks has increased substantially since the 1950s [1] Congestion generally occurs due to increased traffic volume per lane, which resulted a reduction in vehicular speed. The new traffic demandisbeyondthecapacityoftheexistinginfrastructure. Therestrictionoftheareaperlaneandactivitiesalongthe roadsidealsohaveanimpactontheefficientmovementof traffic. Due to traffic congestion, a significant amount of
workinghoursarelostontheroads,whichhasadetrimental impactontheeconomyasawhole.India,oneoftheworld's mostrapidlydevelopingcountries,hasaverylargenumber ofbothpublicandprivateautomobiles[2].Trafficcontrolin India has always been a difficult task. The heterogeneous conditionsoftrafficwithpoorlanedisciplineinIndiaworsen thecongestion.Therefore,itbecomesnecessarytofindout thesolutiontocongestionproblemsofvariousIndiancities. However,bothknownandunpredictableeventsarelinked totrafficcongestion.Unpredictablefactorsincludeweather conditions, accidents, and driverbehavior. Predictable factorsincluderoadconstructionsitesorpeaktraveltimes (suchasofficehours),whichdriversareawareof.Ifdrivers areawareofthesetrafficbottlenecksbeforehand,congestion causedbythefactorsmentionedcanbeavoided.Poorroad conditions, poor lane discipline,uneven carriageway and shoulder widths, encroachment of the road, misuse of the landandtheresultingpedestrianactivities,heterogeneityof traffic, uncontrolled on-street parking,improper bus stop location and design, vehicles with a wide range of technological and operational characteristicsetc. suggest that the nature and cause of congestion in India may be significantlydifferentfromthatinthedevelopedcountries [2].Recurrentandnon-recurrenttrafficaretwoofthemany forms of traffic. Over time, patterns of congestion are broughtonbyrecurrenttraffic.Asanillustration,consider the rush hours in the morning and evening, which recur everyweekdayinaccordancewithschoolandofficehours. Non-recurring traffic jams occur suddenly and without a repeating pattern. Examples include traffic congestion caused on by the worst weather, public rallies, social gatherings,andaccidentsandvehiclebreakdowns.Whether itisrecurringornot,itmustbemonitoredandmeasuresto reduceitneedtobeimplemented[3]
Thispapercomparesseveralcongestionapproacheswhile taking into account the numerous solutions for the congestionproblemthathavebeenpresented.
Congestioninthecontextoftransportationtypicallyrefers toanoverflowofvehiclesonasectionofroadataparticular
International Research Journal of Engineering and Technology (IRJET) e-ISSN: 2395-0056
Volume: 09 Issue: 12 | Dec 2022 www.irjet.net p-ISSN: 2395-0072
time,resultinginloweredspeeds,sometimesmuchslower than normal or "free flow" rates. Stopped or stop-and-go trafficisacommonsignofcongestion.Roadscongestedwith vehiclessuchasbuses,cars,andtrucksmakeitquitesimple tospotcongestion.Whatdeterminescongestionaffectsthe approachestakentoreduceit.
No single definition of traffic congestion is universally believed (Downs, 2004). These definitions can be broadly categorizedintothreegroups[4],
1. Definition on the basis of demand capacityCongestion is a condition in which the number of vehicles attempting to use a roadway at any time exceedstheabilityoftheroadwaytocarrytheload atgenerallyacceptableservicelevels(Rothenberg, 1985).
2. Definition on the basis of delay on travel timeTraffic congestion is a condition of traffic delay (whentheflowoftrafficisslowedbelowreasonable speedsbecausethenumberofvehiclestryingtouse the road exceeds the traffic network capacity to handlethem(Weisbrod,VaryandTreyz,2001).
3. Cost related- Traffic congestion refers to the incremental cost’s resolution from interference amongroadsusers(VTPI,2005).
In general, congestion is the condition of traffic when the trafficvolumeexceedsthecapacityofthelaneorroadway for a given period of time. This situation arises due to number of factors such as human behaviour, vehicular traffic, insufficient roadway etc. Congestion has become a seriousissuetotheurbanenvironment,whichisresponsible for the occurrence of other problems like pollution, increased travel time etc. Therefore, study of congestion problem becomes very important for an efficient urban development.
India is the world’s second-most populous country after China [5] Indian cities are truly congested than any other nation in the world due to very high number of vehicles.Trafficiswellknownformovingatthepaceofits slowest component.India has heterogeneous traffic, and apartfromroutineurbantransportation,networksofautorickshawsandtwo-wheelersaswellasbullockcarts,handpulledrickshawscontributesubstantiallytothecongestion. Duetolackofconnectivityofroutes,privatevehicleusageis increasing despite of public transportation. It also causes traffic congestion in India. Also, staggering hundred-fold increaseinthenumberofmotorizedvehicleshasmadethe congestionworse.Themotor-vehiclepopulationhasgrown
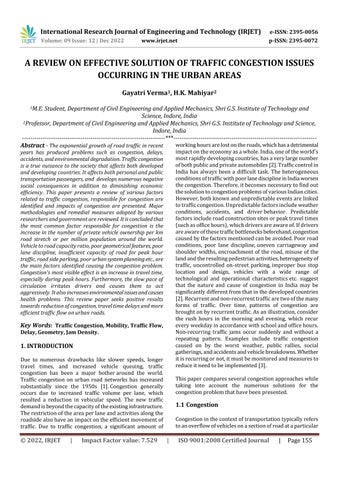
from0.3millionin1951toover295.8millionin2019.The totallengthofthecountry'sroadnetworkasofMarch 31, 2019,was63.31lakhkilometres.Accordingtothereport's research,Indiahad1,926kmofroadsasoftheendofMarch 2019.ThedensityofurbanroadsishigherinIndiaandhas grown over time. By the end of 2011–12, the urban road densitywas4,026.12kmpersquarekilometre;bytheendof 2018–19,ithadclimbedto5,296.3kmpersquarekilometre [6].
Length (Kms)
60,00,000 80,00,000 1951 1961 1971 1981 1991 2001 2011 2012 2013 2014 2015 2016 2017 2018 2019
0 20,00,000 40,00,000
All Roads
Chart -1: StatsofRoadLengthbyCategories(inKm) 1950-51to2017-19[6]
Network inIndia
Chart -2:NumberofvehiclesinoperationacrossIndia fromfinancialyear1951to2019(inmillions[6]).
Uncontrolled on-street parking, illegal parking, encroachment of main carriageways, poor lane discipline, inadequatefacilitiesforpedestrians,poorqualityofpublic transportation, improper bus stop location and design, vehicleswithawiderangeoftechnologicalandoperational characteristics,heterogeneityoftraffic,andpoorroadway condition are just a few of the major issues that were observed[7].
As we have discussed, congestion has become a major problemandcreatesdaytodaychallenges.Reasonsbehind causes of congestion are taken in view and sources are derived.
International Research Journal of Engineering and Technology (IRJET) e-ISSN: 2395-0056
Volume: 09 Issue: 12 | Dec 2022 www.irjet.net p-ISSN: 2395-0072
Trafficcongestionoccurswhenthevehicleseithercometoa completestop or move belowits normal speed.It is not a pleasantsituationforanyone.Someofthereasonsbehind trafficcongestionarediscussedbelow[8]:
Narrow Roads- Streets,whicharenotwideenough duetoillegalpossessionontheroadgettingnarrow andbecomingareasonbehindtrafficjam.
2. Work Zones- Are on-road construction activities thataltertheareaaroundthehighwayphysically. Oneormoreofthefollowingmodificationsmaybe made: reduced or narrower driving lanes; lane "shifts"orlanediversions;reducedornoshoulders; oreventemporaryroadclosures.
Illegal Parking- Vehiclesparkedontheroadisthe reasonbehindtrafficcongestion.
3. Weather- Traffic flow may alter as a result of changes in driving behaviour brought on by environmentalfactors.Whenthereisprecipitation, intense sunshine on the horizon, fog, or smoke, driverswillusuallydroptheirspeedsandincrease theirheadwaysduetothepoorvisibility.
Population growth- Increaseinpopulationleadsto demandoftransportation.
Category 2- Traffic Demand-
Higher Public Purchasing Power-Thepopularity of private transportation is growing in India as a resultofthecountry'sresidents'higherpurchasing power, but the country's current highways and roads are unable to keep up with the growth in vehicles or adapt to it. Therefore, there is an alarmingriseintrafficcongestion.
1. Variations in Regular Traffic- Demandvariesfrom daytoday,thereforesomedayswillseehighertraffic numbersthanothers.
2. Special Events- Areanuniqueinstanceofdemand fluctuationswheretrafficpatternsneartheeventwill differsignificantlyfrom"usual"trends.
Category 3- Features of the physical highway-
Improper city development planning - While every city has a long-term growth plan, it is not properlydone. Themajority ofthetime,roadside landisobservedtohavebeenceasedillegally,but becauseofthevaguedevelopmentplan,thesekind ofactionsareineffective.
1. Devices to Control Traffic- Congestion and travel timevariabilityarealsoimpactedbyfrequentdisruption of traffic flow caused by control devices like railroad gradecrossingsandimproperlytimedsignals.
Malfunctioned traffic signals- The outcome of malfunctioning signals is a traffic jam. Due to an inadequatepublictransitinfrastructure,thereare toomanycarsontheroads.Roadblockingobstacles include double parking, roadconstruction, accidents,andmore.Overdevelopmentinlocations withalready-congestedmasstransitsystems.There areseveraldisadvantagesofcongestionsuchasloss to economy, increase in travel time etc. As the vehicular population is expected to increase exponentiallybyTherefore,itbecomesnecessaryto understandthefactorsresponsibleforcongestion.
TheU.S.federalhighwayadministrationhaspresentedthe sourcesofcongestionasfollows[9]:
1. Traffic Incidents- Incidents that obstruct the regular flow of traffic, primarily through physical obstructioninthelanesoftravel.Themostfrequent types of occurrences are those involving vehicles, such as collisions, breakdowns, and debris in the lanesoftraffic.
2. Physical Bottlenecks- The most traffic that a particular highway segment can accommodate. The number,width,andalignmentoflanes,shoulders,merge lanesatinterchanges,androadwayorientationallaffect capacity(gradesandcurves).Becausetheyimpedethe actual flow of traffic, toll booths can be seen as a particular type of bottleneck. Various congestion problemshaveseveralimpactsontraffic.
Slower speeds, lines, and longer travel times are all indicationsofcongestion,whichraiseseconomicexpenses andhasaneffectonmetropolitanareasandthepeoplewho live there. Indirect effects of congestion include those on qualityoflife,stresslevels,andsafety,aswellaseffectson non-vehicular road space users including those who use sidewalksandpropertiesalongroads.
Theslowmovingcarsintrafficjamsalsogeneratecertain hydrocarbonsandnitrogenoxidestobereleasedintotheair, whichisaprimarycauseofwhatisknownasphotochemical smog.Thelistofeffectsofcongestionfrompreviousstudies isshownbelow[10]:
International Research Journal of Engineering and Technology (IRJET) e-ISSN: 2395-0056
Volume: 09 Issue: 12 | Dec 2022 www.irjet.net p-ISSN: 2395-0072
Traveltimeincrease.
Increasedfuelusageresultsinfuelloss.
Timelossbecauseofunexpectedtraffic.
Trafficcongestionhasaneffectontheenvironment byreleasedharmfulgases.
Congested Travel Percentage: The ratio of the congestion to the overall vehicle miles travelled. Acomparative indicator of the volume of travel impactedbycongestion.
Shorterlifetimeoftheroadsurface.
Anincreaseinthepriceofvehiclemaintenanceasa resultofmechanicalcomponentwearandtear.
Impatient drivers may be more likely to drive aggressivelyandcarelessly,whichincreasestherisk ofaccidents.
The two most basic measurements of reliability are as follows:
Negativepsychologicaleffectsonindividuals,which may have an influence on interpersonal relationshipsandworkproductivity.
In order to reduce the impacts of congestion few measureshadbeenadoptedbyvariousresearchersand authorities.
Congestion is measured and tracked using a variety of performancemetrics,buttheyareallrelatedtothefactors that travellers value most: travel time and the daily variationsintraveltime.MobilityMeasuresandReliability MeasuresaresubcategoriesofCongestionMeasures[11]
TheTeamKentuckyTransportationCabinethasidentified thefollowingfiveasthemosttypicalmobilitymeasures:
VolumetoCapacityRatio(V/CRatio):Itisvolume dividedbycapacity.Volumeisfrequentlyassumed tobethe30thgreatestannualvolumefortheLevel ofService(LOS)calculations.
BufferIndex:Theadditionaltime(margin)required for most trips to ensure on-time arrival. For instance, if the value is 40%, a traveller should allocate an extra 8 minutes as a buffer for a 20minute average peak trip time to guarantee 95% on-timearrival.
Planning Time Index: This indicator, known statistically as the 95th percentile Travel Time Index, also shows the additional time most travellers spend for trips during the peak travel period.Forinstance,avalueof1.60showsthatfor 95%on-timearrival,travellersneedanextra60% oftraveltimeoveroff-peaktravelhours.
The above-mentioned measures can be studied or determinedbydifferentmethodsdescribedinthefollowing section.
Author Name Objectiv e
TheLevelofService(LOS):Theefficiencyofaroad orcrossroadsisgradedfromAtoF,withAdenoting unrestricted flow and F denoting extremely congested traffic. Long regarded as the principal indicatorofcongestionforplanningpurposes,LOS isbasedonavolumetocapacity(v/c)ratio.
1. To proposea model based on traffic congestio n detection.
Data Collecte d
Methods to collect data
Analysis/Dis cussion
TravelTimeIndex:Ratiooftheaveragepeaktravel time to a free-flow (off-peak) standard, in this example60mphonfreeways.Forinstance,avalue of1.20denotesa20%longertraveltimesoveroffpeaktraveltimes.
G. Palubinsk as, et al. (2010)
TravelDelay:Theadditionaltimerequiredtotravel becauseofcongestion.
2. To derive traffic paramete rs like average speedand vehicle density.
Images fromthe video
3K Camera system
Thesuggested method for detecting traffic congestion is basedonamix of several techniques, including change detection, image processing, and assimilationof a priori data like traffic model and roadnetwork. The Multivariate
International Research Journal of Engineering and Technology (IRJET) e-ISSN: 2395-0056
Volume: 09 Issue: 12 | Dec 2022 www.irjet.net p-ISSN: 2395-0072
Alteration Detection (MAD) approach is used to implement change detection in two photos with a short time lag, creating a change image thathighlights the moving vehiclesonthe roadways. Itispossibleto determinethe vehicledensity in the binarized change image byusingimage processing techniques.
nts.
K.R. Priyaraks hitha (2018)
1. To determine Traffic volume intensity so that numberof vehicles crossing during peak hoursand non-peak hours could be identified.
2.Tofind out the speed of the moving vehicles, conduct spot speed study.
3. Conduct Questionn aire survey to gathering informati on from responde
Volume, speed, Geometr y, Human behavio ur survey
Volume count method by Videogra phy method, Speed gun or spot speed study, Question naire survey
Bikestravelin greater numbers than carsandautos, whereas cars and autos travel in greater numbers than buses. Therefore, if thenumberof buses increases, so does the dependencyof public transportation, which encouragesthe userstoswitch to public vehicles.There are suggestions madetocreate improved infrastructures , roads, and trafficsignals.
Babitha Elizabeth Philip et al.(2019)1. To collect average traffic volume datafora working day, a holiday, and a Sundayin order to determine the peak hour factor.
2. To developa model that can eliminate traffic congestio nandlead to a consistent flow of traffic.
3. To determine theroad's geometry andtraffic paramete rs like flow rate and lane capacity.
4. To conducta questionn aire survey of the general public, drivers, andtraffic professio
Volume, Human behavio ur survey, Road Geometr y
Volume count method by Videogra phy method, Question naire survey
There was discussion of the general causes, impacts, and solutions for traffic congestion. A straight link model is establishedas a means of reducing traffic congestionand achieving effectivetraffic flow. The queue length createdinthe lane can be calculatedwith thehelpofthe model. The developed model could help find the best lane maintenance strategies.
Tsutomu Tsuboi (2020)
International Research Journal of Engineering and Technology (IRJET) e-ISSN: 2395-0056
Volume: 09 Issue: 12 | Dec 2022 www.irjet.net p-ISSN: 2395-0072
nals in order to analyse the causes, impacts, and solutions fortraffic congestio n.
To analyse traffic congestio n based on:
1. Comparis onofdaily traffic volume and average vehicle speed is done by traffic flow observati on.
2. Assessme nt of the occupanc y paramete r,whichis usedasa general indicator of traffic congestio n.
3. Estimatio n based on"social loss" calculatio ns that arebased on the theory of traffic flow.
Traffic density, Traffic volume, Average vehicle speed, Occupan cy at each location.
Traffic monitori ng cameras
Three distinct studies of traffic congestion using the standard techniques of observing traffic flow, measuring occupancy,and calculating social loss were conducted. These investigations demonstrate that traffic congestion on individual roads is not always explained by the total hourlynumber of vehicles. The most congestedperi odofthedayis the second peak in the number of vehiclesinthe evening, according to observations made during traffic flow monitoring. The evening timezonewas notedasbeing thebusiestby occupancy judgement. Use of the Social Loss computation canbeusedto
S.Berrouk et al. (2020)
1. To developa fuzzy inferencebased model to measure traffic congestio n.
2. To determine independ ent measures to describe traffic condition s.
3. To provide solutions for uncertain problems through fuzzy process.
Traffic volume, Speed
calculate the parameter for traffic congestion.
Wavetron ix radar sensor
Itissuggested touseafuzzy inferencebasedmethod to assess urban traffic congestion. Defining the various congestion states, computingthe values of the congestion index, classifyingthe input parameter values into distinguishing groups, and computingthe input parameter values are all processes in thetechnique. Out of three inputsthatare generallyused to measure traffic congestion, it generates a composite congestion measure. The adoptionofthe suggested fuzzyinference methodyields a more accurate depiction of the traffic situationsince it takes into consideration even the tiniest differences in the input congestion metrics. The suggested approach can be used to
e-ISSN: 2395-0056
Volume: 09 Issue: 12 | Dec 2022 www.irjet.net p-ISSN: 2395-0072
assess traffic on particular roads, arterials, or the entire highway network.
1. To developa mathemat ical congestio n prediction modelfor heterogen eous traffic.
Md. A. Shahetal. (2020)
2. To assign Level of Service.
3. To make some suggestio ns for reducing trafficand improving the levelof stretch service.
Traffic volume, Speed, Time headway
Videogra phy, Manual count, Radar speed meter
A mathematical model is developed.The proposed effortinvolves modellingata single traffic intersection andmanaging congestion usingaminor lanebypassin a road network. MATLAB 7.0 software is used for analysis. The work was divided into two phases, the first of whichinvolved conceptually modelling the proposed system using activitytheory, andthesecond of which involved simulatingthe conceptually modelled system.
1. To examine the data on traffic flow collected through traffic monitorin g.
2. To determine traffic congestio nmodel.
Traffic volume, Traffic density, Average Speedof vehicles, Occupan cy at each location.
Traffic monitori ng cameras
also analysed. Thepartswith themosttraffic flow and the slowestspeeds were those where congestion was present. Section to section variations occurred in segmental delay and relative delay rate.
a et al. (2020)
1. To measure traffic congestio n.
2. To developa model by multiple regressio nanalysis.
Segment al delay (personsecond), Segment al delay (vehiclesecond), Rate of delay, Relative delay rate
Videogra phy, Manual count
Forsegmental delay, delay rate, and relative delay rate, a regression model was developed.For segmental delay,multiple regression analysis was performed. Relative comparisons of speeds at different portionswere
The shock wavetheoryis usedtodefine the "forwarding traffic congestion" modelandthe "stacking traffic congestion" model. Traffic congestion analysis in India was presentedusin g the occupancy parameterand the shock wave parameter fromthetraffic theory.Bothof these metrics provide information about the current state of traffic congestion. These two parameters help describe traffic congestion conditions for analysisofthe chaoticIndian traffic congestion.
International Research Journal of Engineering and Technology (IRJET) e-ISSN: 2395-0056
Volume: 09 Issue: 12 | Dec 2022 www.irjet.net p-ISSN: 2395-0072
Hazratulla h Paktin et al. (2021)
1. To identify the primary reasons and possible short-, medium-, andlongterm solutions toreduce the congestio n.
2. To suggest ways to prevent traffic congestio ninKabul and improve traffic flow.
1. To conducta study through semistructure d interview s.
Nawsheen Tarannu m Promy et al. (2022)
2. An observati on to identify the requirem ents for developin g an automate d traffic managem ent and control system.
3. To propose an automate d traffic control system.
4.Totest the
Intervie wing people, Visiting location s
The primary reasons for Kabul's road congestion were discovered. This article also suggests short-term, medium-term, andlong-term solutions for reducing the city's level of congestion.
suggested system's efficacy and efficiency in reducing traffic congestio n in a laborator y.
Question naire survey
Inlightofthe statedneeds,a prototype automated traffic management system was developed.For managingand controlling traffic, the proposed approach is effective and efficient. The traffic control system is automated using this system,saving time, money, and labour.
Using solar power, the suggested system will reduce traffic congestionand enable the generalpublic become more awareoftraffic regulations.
G. Palubinskas, et al. (2010) Forthepurposeofidentifying traffic congestion, a new model technique for image time seriesobtainedbyanairborneoptical3Kcamerasystemis provided. It allows us to develop traffic parametertsthat includes both the average speed, one of the key traffic characteristics,andthevehicledensity.Parameterslikethe start and end of congestion, how long it lasted, and travel times.Themethodreliesonpriorknowledge,asimpletraffic model, and the recognition of vehicles on a road segment throughchangedetectionoftwoimageswithashorttime lag.Accordingtotestingresults,theproposedtechnologyfor identifying traffic congestion on roadways in along-track circumstanceshasagreatdealofpotential[12].
K.R. Priyarakshitha (2018) Theauthorconcludedthatif the majority of people of a particular city starts using the masstransportsystem,thentheroadwaycongestioncanbe decreased.Thisisbecausetheroadwayarea covered bya masstransportvehiclewillbelesserthanthearearequired byprivatevehiclesownedbyequalnumberofpassengers. However,masstransportationwillonlybeadoptedbythe people when its efficiency is high as compared to private vehicles.Thisefficiencycouldbemoney,traveltime,safety, andcomfort[13].
Babitha Elizabeth Philip et al. (2019) developedaqueuing theory-based model for straight lines that helps in the effectivemovementoftrafficflowandsignificantlyreduces trafficcongestion.Thequeuelengthcreatedinthelanecan be calculated with the help of the model. The smooth movement of traffic in the lane will be affected by the propagationofthequeuebackacrossthenetworkwhenthe flowinthelaneexceedsthelanecapacity.Thesurveydata wasusedtocreatefinalsamples,whichwerethenexamined todeterminewhetherornottheywerecongested.Therewas discussionofthegeneralcauses,impacts,andremediesfor trafficcongestion[14].
Tsutomu Tsuboi (2020) determinesthethreetechniques foranalysingtrafficcongestionbyonetrafficflowmeasure for indicating traffic congestion is occupancy, which is
International Research Journal of Engineering and Technology (IRJET) e-ISSN: 2395-0056
Volume: 09 Issue: 12 | Dec 2022 www.irjet.net p-ISSN: 2395-0072
observedfromdailytrafficflowbycomparingdailyvehicle counts with hourly average speeds. (OC) is defined by an equation derived from traffic flow theory. The third techniqueinvolvesmakingjudgmentsbasedonsocialloss calculations,and,inaccordancewiththetrafficflowtheory, thesociallossescarriedonbytrafficcongestionhavedefined thetrafficroadservicemarketmodel[15].
S. Berrouk et al. (2020) It is suggested to use a fuzzy inference-basedmethodtoassessurbantrafficcongestion. Therecommendedfuzzyapproachisusedtocalculatethe levels of congestion using traffic data, including vehicle numbers,speed,etc.Uncertainproblemscanbesolvedusing thistechnique.Threedistinctmeasurements,thespeedratio, volumetocapacityratio,anddecreasingspeed ratio,each employuniquecriteriatorepresentacertainaspectofthe trafficsituation.Thesuggestedfuzzyinferencemethodtakes intoconsiderationeventhesmallestvariationsintheinput congestionmeasurements,andwhencombinedwithother methods, it creates a more precise picture of the traffic situation. Since it is based on natural-language principles that precisely reflect how drivers perceive the traffic situation,suchamodelhasahigherlevelofaccuracy. The suggested approach can be used to assess traffic on individual roads, arterials, or the entire highway network [16]
Md. A. Shah et al. (2020) Itisimportanttofindasolution for heterogeneous traffic on poor roadway of developing countrieslikeIndia.Amathematicalmodelisdeveloped.The proposed effort involves modelling at a single traffic intersection and managing congestion using a minor lane bypassina roadnetwork. Thework wasdividedintotwo phases,thefirstofwhichinvolvedconceptuallymodelling theproposedsystemusingactivitytheory,andthesecondof whichinvolvedsimulatingtheconceptuallymodelledsystem usingMATLAB7.0.Ithasbeenestablishedthattheresults arebothcompetitiveandsatisfactory[17]
Suchetan Mahapatra (2020) Forthepurposeofmeasuring trafficcongestionatvariouscrossings,amodelwascreated that takes into account segmental delay (vehicle-second), segmental delay (person-second), delay rate, and relative delay rate. Utilizing the videography method of data extraction, the variables needed for the analysis were created.Free-flowingspeedandcongestedspeedwerenoted downbasedona timecalculationovera specifiedstretch. Multipleregressionanalysiswascarriedoutforsegmental delay (vehicle-second) and segmental delay (personsecond).Fordelayrateandrelativedelayrate,aregression modelwasdeveloped.Inordertodeterminewhichareais mostandleastaffectedbycongestion,relativecomparisons ofspeedsatdifferentportionswerealsoanalysed.Theparts withthemosttrafficflowandtheslowestspeedswerethose wherecongestionwaspresent.Sectiontosectionvariations occurredinsegmentaldelayandrelativedelayrate[18].
Tsutomu Tsuboi (2021) usesshockwavetheorytodevelop the "forwarding traffic congestion" and "stacking traffic congestion"modelsoftrafficcongestion.Inthisstudy,traffic dataiscollectedeveryminute,around-the-clock,usingtraffic monitoring cameras. The equation is created using the criticaltrafficdensity(kc)andjamtrafficdensity(kj)from thetheoryoftrafficflow,andtheshockwaveistransmitted in both the forward and backward directions. When the shockwavevalueiszero,eitherthereisnocongestionand thetrafficismovingsmoothly,orthereiscompletegridlock and no movement. As a result, the definitions of c>0 condition and c0 condition, respectively, are "forward flowingtrafficcongestion"and"stackingtrafficcongestion," respectively.Thesemodelscanbeusedtoexplainwhythere istrafficcongestionandsuggestsolutionsforIndia[19]
Hazratullah Paktin et al (2021) proposed In order to achievesmoothtrafficflow,reducethenumberofaccidents, and make the facilities pedestrian-friendly, traffic managementpoliciesandmeasureswouldbehelpful.The solutionsareproducedintwostages,thefirstbeingshorttermactionsandthesecondbeingmedium-andlong-term ones. Intelligent transportation systems and high-quality publictransportationmustbetakenintoaccountinplansfor themediumandlongterms[7]
Nawsheen Tarannum Promy et al. (2022) presentedan automated traffic control system. Semi-structured interviews and a number of questions on the issues that cause severe traffic in the city were used in a study to identifyrequirements.Theinterview'sgoalwasexplainedto theparticipants,whowerethenquestionedabouttheissues thatcauseextremetrafficinthecity.Byvisitingseveralsites, the requirements were determined based on answers. A mobileapplicationforthesuggestedparkingsystemanda hardware prototype were developed as two parts of the proposedautomatedtrafficcontrolandmanagementsystem. Thetrafficcontrolprocessisautomatedusingthissystem, savingtime,money,andlabour.Theproposedsystem,which makes use of solar energy, will help increase public awareness of traffic regulations and ease congestion at a busycity's4-wayintersection[20]
AcasestudyofIndorecitypresentedfewpracticalsolutions to solve the problem of congestion such as widening of roadway,provisionofone-waypolicyandprovisionofnew alternativeroadsection.Wideningofroadwayincreasesthe overallcapacityofmultilanehighway,thereby,providingthe opportunityofquickmovementvehiclesperunitoftime.
Inastudy,authorsprovidedthesolutionsasImprovements tobottleneckintersections, signalizationintersectionsand their management, parking improvements, mid-block Uturning and right-turning points,the issuance of driving
International Research Journal of Engineering and Technology (IRJET) e-ISSN: 2395-0056
Volume: 09 Issue: 12 | Dec 2022 www.irjet.net p-ISSN: 2395-0072
licencestoonlyprofessionaldrivers,thestrictenforcement oftrafficregulations,theneedtoinformalldriversinvarious ways to take the rules and regulations seriously, the constructionofstopsandstationsforvehiclesandbuses,the assignmentofstationsinspecificlocations,thesignalization ofintersections,themanagementoftheseimprovements,the signalizationofbottleneckintersections[7].
The Delhi government introduced the odd-even plan, a trafficrestrictionmeasurethatallowsprivatecarswithodd registration numbers to drive on odd days and cars with evenregistrationnumberstodriveonevendays.Thisaction wastakentoincreasepublictransportation,includingmore busesandmorefrequentmetroservice,inordertoprohibit cars, ease traffic congestion, and reduce vehicle-related pollution.
Inanotherstudy,authorsprovidedthesolutionofreduced congestion by preventing the heavy commercial vehicles. The elimination of heavy commercial vehicles resulted in smoothtrafficmovementbecauseofmorespaceisavailable forotherlightweightvehicles.Thispolicyisquiteeffective, however,itcannotbeappliedforcommercialareasandfor citybuses.
TheuseofTrafficManagementSystem(TMS)techniquesis primarily used as a short- and medium-term solution to increase the effectiveness and safety of traffic on existing roads. TMS also helps to maximise the use of existing facilities without having a negative impact on the environment. These methods are economical. Traffic management involve bringing changes in the elements of geometric design, roads widening, provision of control devices, and imposing restrictions on some movement in someparticularlocations.
Optimisetraffic-lightmanagement
UseCCTVtomonitorroadconditions
Enforceexistingroadtrafficlaws
Chargeforworkplaceparking
Improvecyclinginfrastructure
Lightrail
Improveperceptionsofbuses
Improvebusservices
Existingrailnetwork
Developandrefinepark-and-ride
Extendresidents’parkingzones
UseInboundFlowControl
Rationalizedistributionanddeliveries
StrategicRoadNetworkresilience
Roadpricing[21]
The One-hit Solution-
Widenroads
Narrowroads
Addbuslanes
Buildtunnels
Removebuslanes
Makebusesfree
Buildanewringroad
Buildalightrailnetwork
Bancycling
Switchofftrafficlights
Bancarsfromcitycentres
Buildmorecarparks
Closethrough-routestoprivatevehicles
Closecarparks
Makepark-and-ridefree
Buildmorepark-and-rides
Introduceacongestioncharge/roadpricing[21]
TheabovesolutionsweregivenbySmarterCambridge TransportAuthority.
Traffic congestion is a serious social issue which needs special attention. The above literature conclude the following-
Themajorfactorresponsiblefortrafficcongestion is the increase in the number of private vehicle ownership per km road stretch or per million population.
Duetolackofconnectivityandfacilitiesforpublic vehicle user people use their own vehicles which leads to increase in traffic congestion and by that accidentsalsoincreasingdaybyday.
The main causes of congestion such as illegal parking, encroachment of main carriageway, insufficient pedestrian facilities, heterogeneous traffic on the same carriageway, poor traffic management,poortrafficcontrol,etc.Thesolutions for congestion problem are discussed which can reducecongestionbyadoptingfollowingmeasures such as widening of road, improvements to
International Research Journal of Engineering and Technology (IRJET) e-ISSN: 2395-0056
Volume: 09 Issue: 12 | Dec 2022 www.irjet.net p-ISSN: 2395-0072
bottleneckintersections,propertrafficmanagement andfollowingtrafficregulations,publicawareness, parking and pedestrian facilities, maintenance of roadetc.
Government officials from all around the world proposedaddingbuslanes,expandingparkinglots, subsidising buses, enacting a congestion fee or otherroadpricing,prohibitingprivatevehiclesfrom usingthroughroads,etc.assolutions.
[1] S. Et.al., “Analysis of Traffic Congestion Impacts of UrbanRoadNetworkunderIndianCondition,” IOP Conf. Ser. Mater. Sci. Eng.,vol.1006,no.1,2020,doi: 10.1088/1757-899X/1006/1/012002.
[2] G. Et.al, “Traffic Congestion Detection and Management Using Vehicular Ad-Hoc Networks ( VANETs)InIndia,” Int. J. Adv. Comput. Technol.,no. May, 2012, [Online]. Available: https://www.researchgate.net/publication/276173 264
[3] S.A.Angayarkanni,R.Sivakumar,andY.V.Ramana Rao, “A review on traffic congestion detection methodologiesandtools,” Int. J.Adv.Sci.Technol.,vol. 28,no.16,pp.1400–1414,2019.
[4] M.Aftabuzzaman,“MeasuringTrafficCongestion-A Critical Review 30 th Australasian Transport Research Forum 30 th Australasian Transport ResearchForum,” 30th Australas.Transp.Res.Forum, no.January2007,pp.1–16,2007.
[5] R. W. Caves, No Title. 2004. [Online]. Available: https://en.wikipedia.org/wiki/Traffic_congestion#: ~:text=Traffic congestion is a condition,increased substantiallysincethe1950s.
[6] S. Sun, “No Title,” Statista, 2019. https://www.statista.com/statistics/664729/totalnumber-of-vehicles-india/#:~:text=Inacountrywith the,orsharedvehiclesforcommute
[7] H.Paktin,A.Mangal,andM.QadeemAfghan,“Causes and Solutions of Traffic Congestion of Kabul City,” Int. J. Tech. Res. Sci.,vol.6,no.2,pp.20–28,2021,doi: 10.30780/ijtrs.v06.i02.003.
[8] Subha,“NoTitle,” Leg. Serv. India.com is Copyrighted under Regist. Copyr. Act (Govt India) © 2000-2022 ISBN No 978-81-928510-0-6, 2022, [Online]. Available: https://www.legalserviceindia.com/legal/article-49an-account-on-traffic-congestion.html
[9] FederalHighwayAdministration,“NoTitle,” Traffic Congest. Reliab. Trends Adv. Strateg. Congest. Mitig., 2020, [Online]. Available: https://ops.fhwa.dot.gov/congestion_report/chapter 2.htm
[10] R. R. Thoker, R. Gupta, and E. N. Kumar, “Review Paper on Study on Traffic Congestion in National Highways,”pp.62–63,2020.
[11] K. T. Cabinet, “No Title,” 2020. https://transportation.ky.gov/CongestionToolbox/Pages/Congestion-Measures.aspx
[12] G.Palubinskas,F.Kurz,andP.Reinartz,“Modelbased trafficcongestiondetectioninopticalremotesensing imagery,” Eur. Transp. Res. Rev.,vol.2,no.2,pp.85–92,2010,doi:10.1007/s12544-010-0028-z.
[13] Priyarakshithaetal.,“TrafficCongestionStudyWith a Reality Approach-a Review,” vol. 119, no. 17, pp. 1061–1069, 2018, [Online]. Available: http://www.acadpubl.eu/hub/
[14] B.E.PhilipandK.H.Jaseela,“TrafficFlowModeling andStudyofTrafficCongestion,”vol.4,no.1,pp.4–5, 2016.
[15] T.Tsuboi,“Newtrafficcongestionanalysismethodin developing countries (India),” VEHITS 2020 - Proc. 6th Int. Conf. Veh. Technol. Intell. Transp. Syst., no. Vehits, pp. 145–151, 2020, doi: 10.5220/0009766501450151.
[16] S.Berrouk,A.ElFazziki,andM.Sadgal, Fuzzy-based approach for assessing traffic congestion in urban areas, vol. 12119 LNCS. Springer International Publishing, 2020. doi: 10.1007/978-3-030-519353_12.
[17] M. A. Shah, “Congestion Modelling and Level of ServiceAssesmentofUrbanRoadsin,”vol.7,no.8, pp. 2230–2240, 2020, [Online]. Available: file:///C:/Users/FRIENDSCOMPUTERS/Downloads/JETIR2008294.pdf
[18] H. S. Goliya, K. Meshram, and S. Mahapatra, “Measurement of Traffic Congestion for Indore,” Stavební Obz. - Civ. Eng. J., vol. 29, no. 04, pp. 500–506,2020,doi:10.14311/cej.2020.04.0043.
[19] T. Tsuboi, “Traffic congestion model in India by shockwavetheory,” Front. Artif. Intell.Appl.,vol.341, pp.213–220,2021,doi:10.3233/FAIA210250.
[20] N. T. Promy, P. P. Rawshan, M. M. Islam, and M. N. Islam, “Developing a Smart System for Reducing
International Research Journal of Engineering and Technology (IRJET) e-ISSN: 2395-0056
Volume: 09 Issue: 12 | Dec 2022 www.irjet.net p-ISSN: 2395-0072
Traffic Congestion,” Lect. Notes Networks Syst., vol. 311, no. January, pp. 669–683, 2022, doi: 10.1007/978-981-16-5529-6_51.
[21] “No Title,” Smarter Cambridge Transp., [Online]. Available: https://www.smartertransport.uk/smartercambridge-transport-urban-congestion-enquiry/