International Research Journal of Engineering and Technology (IRJET) e-ISSN:2395-0056

Volume: 09 Issue: 12 | Dec 2022 www.irjet.net p-ISSN:2395-0072

International Research Journal of Engineering and Technology (IRJET) e-ISSN:2395-0056
Volume: 09 Issue: 12 | Dec 2022 www.irjet.net p-ISSN:2395-0072
1 Ph.D. student, Faculty of Engineering, Ain shams university, Civil engineer, Water Resources Research Institute, National Water Research Center, Ministry of Water Resources and Irrigation, Egypt
2,3 Professor of Engineering Hydrology, Irrigation and Hydraulics Department, faculty of engineering, Ain shams university, Egypt
4 Assistant professor, Irrigation and Hydraulics Department, faculty of engineering, Ain shams university, Egypt ***
Abstract - Soil moisture is one of the main hydrometeorological variables that play an important role in processes related to infiltration and runoff generation. Nowadays remote sensing techniques can detect surface soil moisture, compensating for the shortage of in-situ measuring techniques. This work aims to test the capability of thermal bands of Landsat-8 datasets in detecting surface soil moisture in a semi-arid environment and to investigate the temporal variation of soil moisture during three different time slots (2016, 2021, and 2022) representing different soil moisture conditions. The low rates of soil moisture content (SMC) inNovember 2021 represent the dry season due to the absence of rainfall, and the high SMC in January 2016 and February 2022 represents the rainy season due to the antecedent rainfall Also, the sensitivity of the observed and predicted soil moisture content to the antecedent rainfall storms was discussed. Band 10 was used to determine the land surface temperature (LST) and convert it to soil moisture index (SMI) Measurements of (SMC) were carried out at several locations in the mainstream of Agarma watershed, a tributary of wadi Kharouba, Matrouh, Northwest of Egypt as a representation of a semi-arid environment. A linear regression analysis was selected to generate a relationship between the observed (SMC) and the estimated (SMI) for the three dates, also the validation of soil moisture was considered The validation results showed that the coefficient of determination (R2) between SMC and SMI for three days in (2016, 2021, and 2022)were0.83,0.80,and0.89respectively.
Keywords: Soil moisture, Soil moisture index, Land surfacetemperature,Landsat-8
Soil moisture is essential in the global water cycle and other aspects of earth science [1] and is a crucial variable forhydrology,meteorology, andagriculture [2] Itisa key element in understanding the hydrological process as it
regulates the infiltration-runoff mechanism. Hence, researchers are keen to estimate precise soil moisture for a variety of applications, including flood and drought prediction in hydrology [3] In-situ measurements and remote sensing technology are examples of soil moisture monitoring technologies. For small-scale applications, insitu measurements of soil moisture are accurate [4], whereas estimates of soil moisture obtained from remote sensing using various techniques (optical, thermal infrared, and microwave) are suitable for large-scale applications in a few upper centimeters of soil [5]. The majority of regions worldwide suffer from a lack of soil moisture measurements, therefore remote sensing compensates such lack by providing soil moisture data with varying spatial and temporal resolutions all over the world [6]. Different studies [8, 9] noted that the emitted and reflected radiations are sensitive to soil moisture conditions. Accurate retrieved soil moisture is enhancing the estimation of runoff and groundwater recharge [6, 7] Landsat-8 thermal bands are effective for identifying the existence of shallow water by estimating land surface temperature (LST) [10]. Many authors [11, 12, 13] established various approaches for measuring soil moisturecontent(SMC)basedonsoilreflectanceandLST. Soil moisture index (SMI) proposed by [14] is a relationship between LST and normalized difference vegetation index (NDVI). SMI values vary from 0 for dry conditionsto1formoistconditions [15]developedSMIby utilizing another relationship between maximum and minimumlandsurfacetemperature(LST)
Recently, [10] estimated the soil moisture index (SMI) usingthermal remotesensing todefinewaterloggedareas in Ismailia governorate, Egypt based on land surface temperature computation. Datasets of Landsat 5, 7, and 8 wereusedtoestimateLST,and SMI duringthreedifferent dates (1998, 2008, and 2015). Validation of soil moisture was carried out only in 2015 and obtained a moderate correlation R2 equal to 0.61. The results showed that the
e-ISSN:2395-0056
Volume: 09 Issue: 12 | Dec 2022 www.irjet.net p-ISSN:2395-0072
Spatio-temporalvariationsofsoilmoisturewererelatedto Land-use/Land-coverandwatertablelevels.
While [16] used Landsat-7 and Sentinel-1 data to investigate the change in soil moisture content for one measurementonlyinAugust2016regardingcroppatterns in the east of the Nile Delta of Egypt. Two methodologies were utilized based on LST and backscattering coefficient determination. Two correlations were generated between observed soil moisture content and the estimated SMI & backscattering coefficient Results showed good R2 = 0.81 and 0.83 for both types of datasets (Landsat-7 and Sentinel-1) respectively. Also, results ensured that the discriminationofcroptypeswasrelatedtothedistribution ofsoilmoisture.
On the other hand, [17] applied another methodology to estimate SMI using sentinel-2 data in wadi Kharouba, Northwest of Egypt. Shortwave Transformed Reflectance STR and Normalized Difference Vegetation Index NDVI were calculated and an optical trapezoidal model (OPTRAM) was established to obtain SMI. R2 was generated between the observed soil moisture and the estimated SMI at different depths from 10 cm to 30 cm in Jan. 2016 only. Results ensured that correlation of observed soil moisture and estimated SMI at 10 cm was betterthantheirvaluesat20and30cm.
The current work aims to generate a correlation between the observed soil moisture content (SMC), and the estimated soil moisture index (SMI) from the thermal bandsofLandsat-8andinvestigatesthetemporalvariation of soil moisture related to different rainfall intensities duringdifferent periodsintherainyseasonofa semi-arid environment(NorthwesterncoastofEgypt).
TheNorthwesterncoastofEgyptischaracterizedbyahigh rateofrainfallintherainyseasonfromSeptembertoApril. Rainfed farming is the primary source of food for the majority of the local Bedouins on Egypt’s Northwestern Coast and acts as one of the major economical pillars for them.Asper[18]“Egypt’scoastalzonemustbedeveloped because it has the most promising land for agricultural expansion” The region has a lot of wadis filled with naturalvegetation,rain-fedcrops,andoliveandfigtreesin themainstream,wherewadidepositsarelocated[19] The classification of the soil type of the Northwestern coast of Egypt(fromFuka toMatrouh)wasshallowsandysoiland deep sandy loam to loam soil [20], and was characterized bysandyclayloamandsandyloamtexturedescribedinElHrakaBasin[21].Mostofthelandcoverinthemainwadis
of the Northwestern coast of Egypt was classified to rainfedcropsandbaresoil.Forexample,WadiElRamlhad three main types of land cover such as rainfed crops, sparselyvegetatedland,andbaresoil [19].Also, the same classificationwasfoundedinEl-HrakaBasinasper[21].
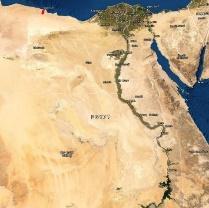
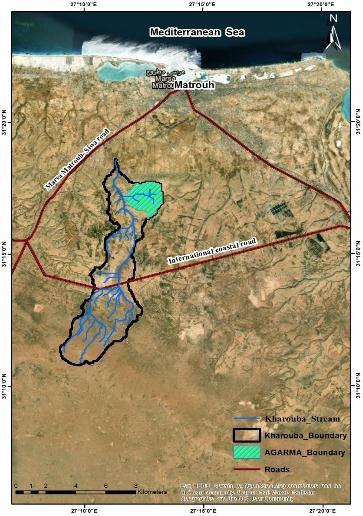
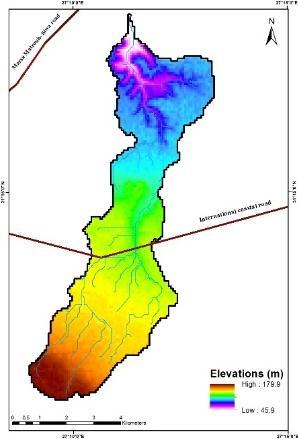
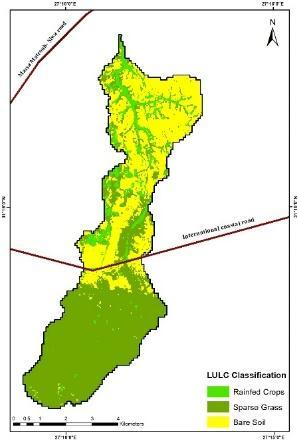
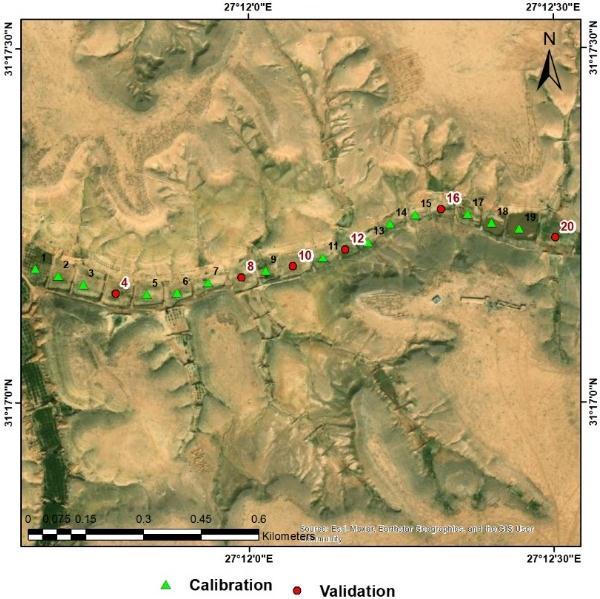
Wadi Kharouba, located in Matrouh governorate, NorthwesterncoastofEgypt,ishavinganareaof38km2.It lies between latitudes 31° 11’ 0’’N, 31° 22’ 0’’N, and longitudes 27° 10’ 30’’E and 27° 20’ 0’’E It is bordered fromtheNorthbyMatrouhcityandfromthewestbywadi El Raml. The climate of the region is characterized by a short rainy winter and long hot dry in summer, whereas the average annual temperature is about 24.5°C in Matrouh [21] and the average annual rainfall varies between 100 mm and 190 mm [22] Figure (1) shows the Agarma watershed, a tributary of wadi Kharouba with an area of 6 km2, which was chosen to conduct several soil moisture content measurements. Figure (2a) shows the landcoverofwadiKharoubacreatedbyusingtheLandsat8 bands and the supervised classification technique and was classified into three categories rainfed crops, sparse grass, and bare soil. While figure (2b) shows the ASTER Global Digital Elevation Model (GDEM) of wadi Kharouba, wherethelowelevationsrepresenttherainfedcropareas and the high elevations represent the sparse grass area and bare soil. On the other side, soil samples were collected from Agarma watershed and analyzed in the laboratory.Theresultsindicatedasandyclayloamtexture thatwasmatchingthedescriptionofthesoiltextureofthe samewatershedmentionedin[22]
e-ISSN:2395-0056
Volume: 09 Issue: 12 | Dec 2022 www.irjet.net p-ISSN:2395-0072
(a) (b)
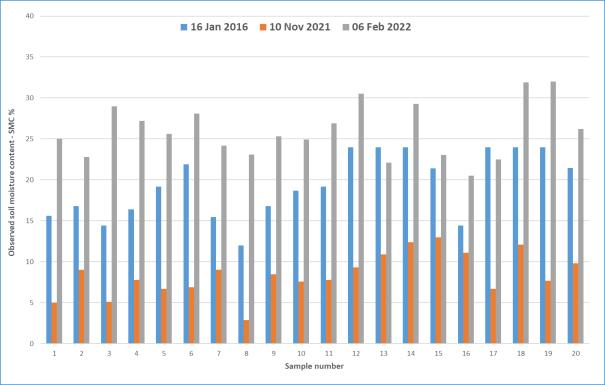
[17] In addition, new measurements were performed on 10 Nov.2021 and 6 Feb.2022. Figure (4) shows the observed soil moisture measurements at the twenty locationsinAgarmawatershedforthosedates Highvalues were observed in Feb 2022 and moderate were recorded in Jan.2016, while the other low values were measured in Nov2021.
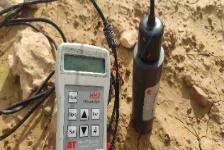
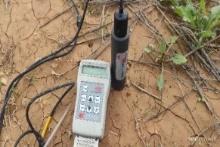
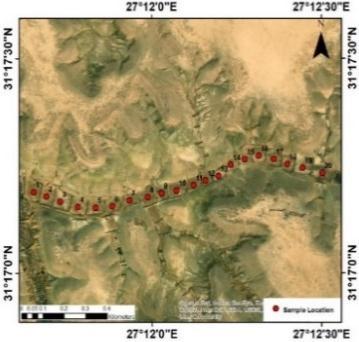
Soil moisture measurements were taken at twenty locations along the mainstream of Agarma watershed, figure (3). Theta Probe soil moisture sensor type ML2X wasusedwithameasuringdepthof5to10cm.Measuring started consequently from the downstream (point 1) in a curved line, following the mainstream path, till (point 20) at the most upstream. Runoff concentration in the mainstream, low elevations, and agricultural activities madetheselocationsmorepromisingfortheestimationof soil moisture These locations were studied before in the MARSADEV project carried out by the Mediterranean Agronomic Institute of Bari and provided this current workbyonlyonemeasurementon16January2016atthe twentylocations[17,22]
Landsat-8dataweredownloadedclosetothedatesoffield measurements and according to their availability. Table (1)showsthedetailsofbothmeasuredandacquireddata, inadditiontotherecordedrainfallinformationinMatrouh beforeandafterthemeasurementdates.
Table 1: Detailsofmeasuredandacquireddata
Measuring Date
Available Acquisition Date Landsat-8 (OLI/TIRS)
16-Jan-2016 21-Jan-2016
10-Nov-2021 2-Nov-2021
Rainfall status during the measuring and acquisition dates in (mm)
Source: Water Resources Research Institute. WRRI
12.2 mm on 31-Dec-2015
No rainfall from 1 Jan. to 21 Jan.2016
No rainfall over the study area from the start of the rainy season in September till 20 Nov.2021
12.2 mm on 2-Jan-2022 15.5 mm on 13-Jan-2022 11.2 mm on 26-Jan-2022
6-Feb-2022 6-Feb-2022
No rainfall from 27-Jan-to 6 Feb.2022
One historical record of soil moisture in Agarma watershed was available in the literature on 16 Jan.2016
All acquired scenes mentioned above in table (1) contain low cloud cover and are far from the study area, hence they were used in the analysis after processing. While another acquired scene with the corresponding field measurement in Dec.2021, was not considered in the analysisdueto thedensecloudcover overthestudyarea Table (1) also shows that there was a time gap between measuringtimeandacquisitiontimein2016and2021due
e-ISSN:2395-0056
Volume: 09 Issue: 12 | Dec 2022 www.irjet.net p-ISSN:2395-0072
to the revisit time of Landsat every 16 days. Therefore, it was deemed necessary to report the rainfall events recordedduringsuchaperiod,asitisoneofthevariables thatwillaffectthesoilmoisturecontent
The Landsat-8 data with two sensors (Operational Land ImagerOLI/ThermalInfraredSensorTIRS)wereusedand downloaded from USGS [27] website https://earthexplorer.usgs.gov/ Downloadingwascarried out by defining the location of the study area using (Path/Row:179/38), and the data were acquired in the threetargetperiods.Table(2)describesthespecifications ofLandsat-8(OLI/TIRS)data
Table 2: SpecificationsofLandsat-8(OLI/TIRS)data
δ≈T10sensor–(T210sensor/bγ) (3)
Where: T10sensor is Band 10 at-sensor brightness temperature, λ10: Band 10 effective wavelength, b γ=c2/λ= (1324K)and(ψ1,ψ2,ψ3)areatmosphericfunctions.
Computationof LST required doinga lotofcorrections on the thermal bands of Landsat-8 (B10&B11), figure 5. The thermal atmospheric correction was applied using ENVI software to remove the atmospheric contribution fromthermalinfrared radiance data While radiometric calibration was used by calibrating the corrected thermal bandstoradiance,reflectance,orbrightnesstemperatures. On the other hand, land Surface Emissivity LSE (Ɛ) is one of the key parameters for retrieving accurate LST from remotely sensed imagery [23] The resulting top of atmosphericspectralradiance(TOA),at-sensorbrightness temperature, and emissivity were included in the land surface temperature LST calculation using the algorithm [24]. Three atmospheric functions (ψ1, ψ2, ψ3) were involved in LST calculation based on equation (1) and defined from the seasonal-latitude surface temperature modelavailableinENVI5.3.
Ts =ɣ(Ɛ10 (ψ1*L10 sensor +ψ2)+ψ3)+δ 1 (1)


Where:Ts isLSTin(Kelvin),Ɛ10:isemissivityforband10, andtheL10 sensorisBand10radiance. ɣ≈T2 10sensor /(bγ.L10sensor) (2)
Figure 5: FlowchartofLandSurfaceTemperature(LST) computation
2.3.1
Thesoilmoistureindex(SMI)istheratioofthedifference between present soil moisture and the permanent wilting point to field capacity and residual soil moisture. This indicator ranges from 0 to 1, with 0 representing dry conditions and 1 representing moist conditions [25]. Determination of SMI requires the computation of the maximumandminimumvaluesofLST[15]asexplainedin equation(4).
SMI=(LSTmax –LST)/(LSTmax –LSTmin) (4)
Where:SMIisSoilMoistureIndex,LSTmax,LSTmin,andLST: are the maximum, minimum, and value of the retrieved LSTrespectively.
By applying the previously mentioned methodology of land surface temperature (LST) estimation and using equation 4 for computing the soil moisture index (SMI), LST and SMI maps of Kharouba watershed were created for the three measuring days of Jan. 2016, Nov.2021, and Feb.2022,figure(6)andfigure(7)respectively.
International Research Journal of Engineering and Technology (IRJET) e-ISSN:2395-0056
Volume: 09 Issue: 12 | Dec 2022 www.irjet.net p-ISSN:2395-0072
Figure 6: Landsurfacetemperature(LST)mapsof Kharoubawatershed
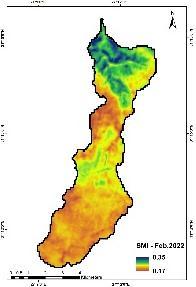
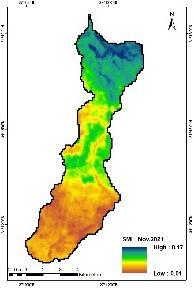
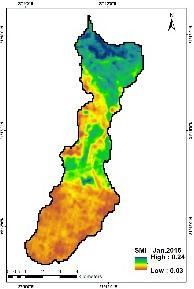
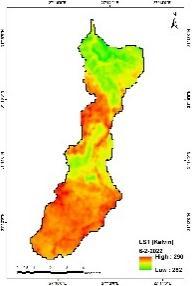
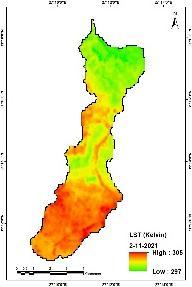
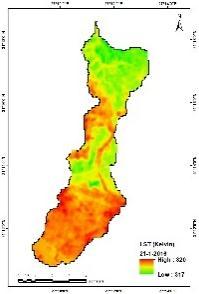
Figure 7: RetrievedSoilmoistureindices(SMIs)of Kharoubawatershed
Figures6and7showthevariationinsoilmoistureindices that were related to LST changes, where high temperatures were accompanied by low soil moisture contentandviceversa.Thelowestvaluesoftheestimated SMI were observed in Nov.2021, while the highest values were estimated in Feb.2022. And the values of retrieved SMIinJan.2016hadmoderatevalues.
In addition, the variation in soil moisture was correlated with the types of land cover mentioned before in wadi Kharouba, where rainfed crops corresponded to an increase in SMI, while the bare soil and areas covered by grasshavelowvaluesofSMI
A linear regression analysis was created between the measured soil moisture content SMC of 20 samples in Agarma watershed and the estimated SMI for different dates(Jan.2016,Nov.2021, andFeb.2022).14readings for each of those dates were utilized to calibrate the model between SMC and SMI. Six readings were selected randomlyforvalidationasshowninfigure8
The coefficient of determination (R2), equation (5), was used to evaluate the generated model between observed SMCandestimatedSMI. [ ∑ ( )( ) √∑ ( ) √∑ ( ) ] (5)
Where Yi and Xi are the observed (SMC) and estimated (SMI) respectively, Y¯ and X¯ are their mean values respectively,andNisthetotalnumberofobservations.
OtherstatisticalmeasuressuchasRootMeanSquareError (RMSE), Equation (6), and Mean Absolute Error (MAE), Equation (7), were calculated to assess the validation of soilmoisture
√ ∑ ( ) (6)
Where Yi and Xi are the observed and estimated soil moisturerespectively,andNisthetotalnumberofdata.
∑ ( ) (7)
Where Yi and Xi are the observed and estimated soil moisturerespectively,andNisthetotalnumberofdata.
RMSEmeasuresthedifferencebetweensatelliteestimates (SMI)andobserveddata(SMC),ithasarangefrom0to ; values close to zero reflect the high accuracy of satellite estimatesincontrasttohighvalues[26]
International
e-ISSN:2395-0056
Volume: 09 Issue: 12 | Dec 2022 www.irjet.net p-ISSN:2395-0072
While Mean Absolute Error (MAE) indicates the ratio betweenthesumofabsoluteerrorstothetotalnumberof data.ThelowervaluesofMAEarerepresentingthehigher accuracyofsatellitedata[26]
The generated relations between SMC and SMI for the historical measurement on 16 Jan.2016 beside the other new measurements on 10 Nov.2021 and 6 Feb2022 are described below Also, the results of the validation assessmentarepresentedasfollows:
Both values of observed SMC and estimated SMI in this event had medium values compared with values in November2021andFebruary2022,asaresultof12.2mm of rainfall storm occurred on 31 December 2015 over the study area,16 days before ground measurements of SMC Equation(8)andfigure(9) showtherelationbetweenthe observed soil moisture content and the retrieved soil moistureindexinJan.2016withtheresultingR2 =0.72.
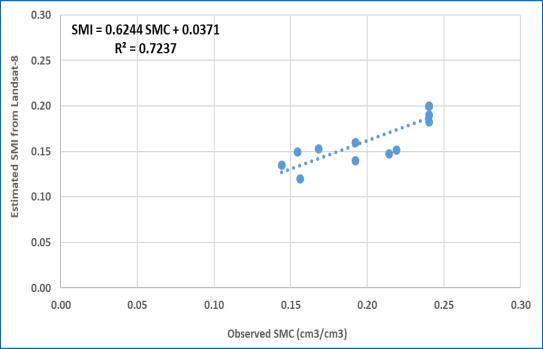
(8)
Where SMI is the estimated soil moisture index from Landsat-8andSMCistheobservedsoilmoisturecontent.
(b)
(a)
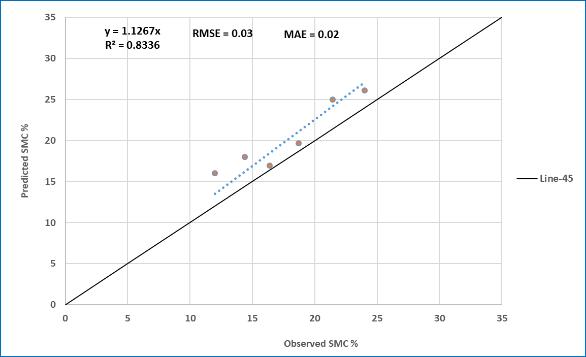
Figure (10a) shows the results of soil moisture validation in January 2016 with a good R2 equal to 0.83 and the values of RMSE and MAE are 0.03 and 0.02 respectively. Also, the map of spatial variations of the predicted soil moisture of wadi kharouba is presented in figure (10b), wherepredictingthesoilmoisturewasestimatedbasedon the proposed model shown in equation 8 using a raster calculator
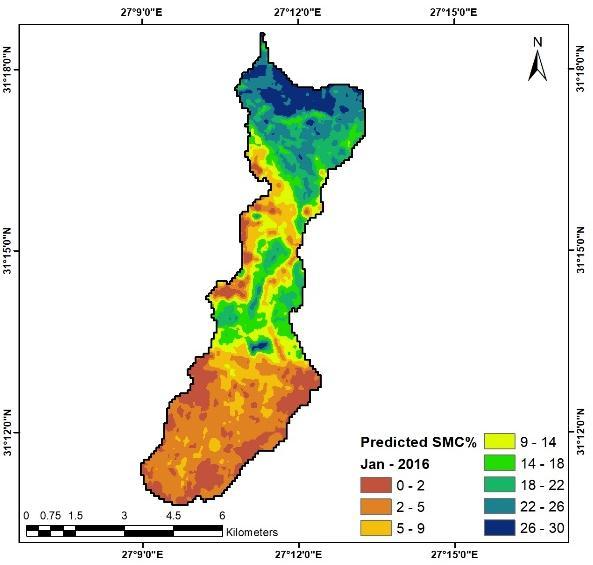
Figure 10: a) Assessmentofsoilmoisturevalidation b) PredictedsoilmoisturecontentSMC% (Jan-2016)
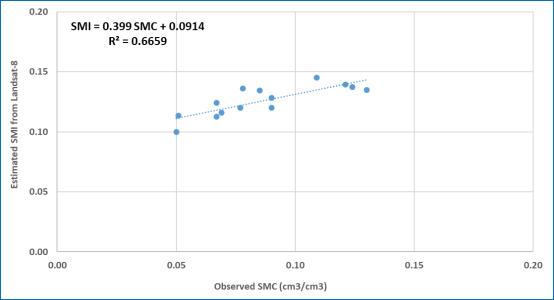
Duetotheabsenceofrainfallbeforethemeasurementson 10 November 2021, as per table 1, values of the observed soilmoisturecontentinthisevent werethelowest Figure (11) andequation(9)show thegenerated model between the observed SMC and estimated SMI in Nov.2021. The resulting coefficient of determination (R2) was equal to 0.66.
(9) Where
SMI is the estimated soil moisture index from Landsat-8 andSMCistheobservedsoilmoisturecontent.
e-ISSN:2395-0056
Volume: 09 Issue: 12 | Dec 2022 www.irjet.net p-ISSN:2395-0072
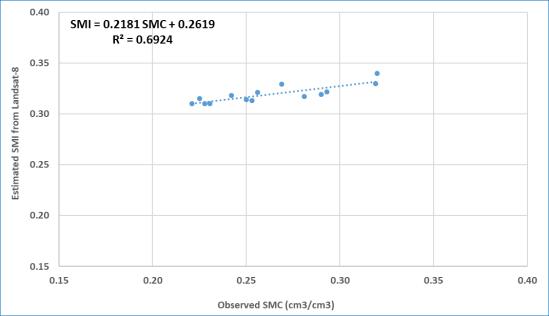
The highest soil moisture values were recorded in February2022duetothreerainfalleventsofatotaldepth of 39 mm that occurred in three days on 2, 13, and 26 January 2022 covering the study area. Figure (13) and equation(10)showtheresultoflinearregressionanalysis betweentheobservedSMCandestimatedSMIinFeb.2022 includingthevalueofresultedR2 wasequalto0.69 (10)
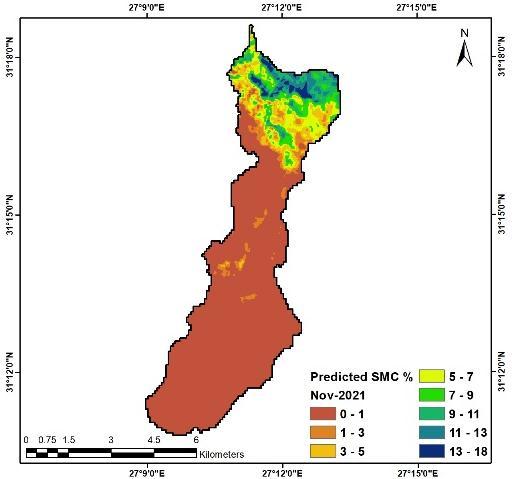
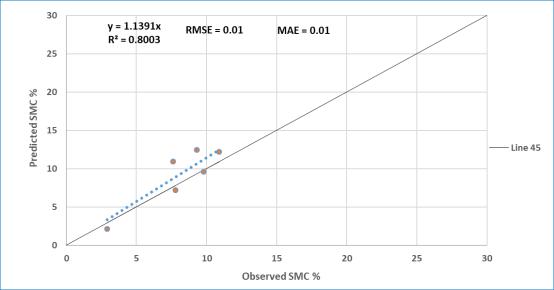
The resulting R2 from validation and the values of RMSE and MAE were 0.80, 0.01, and 0.01 respectively as shown in figure (12a). While the predicted SMC % was created in Nov. 2021 over wadi Kharouba, figure (12b) usingthepreviouslygeneratedmodel(equation9).Almost thewholewatershed wascovered withverylowvaluesof soil moisture content except the small cultivated areas in theNorthandthatrepresentsthedryseason.
Where SMI is the estimated soil moisture index from Landsat-8andSMCistheobservedsoilmoisturecontent.
(a) (b)
Figure 13: Linearregressionanalysisbetweenobserved soilmoistureSMCandestimatedSMI(Feb-2022)
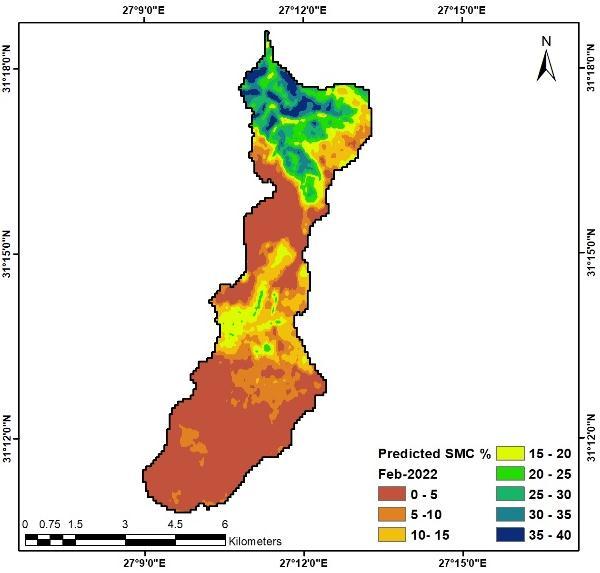
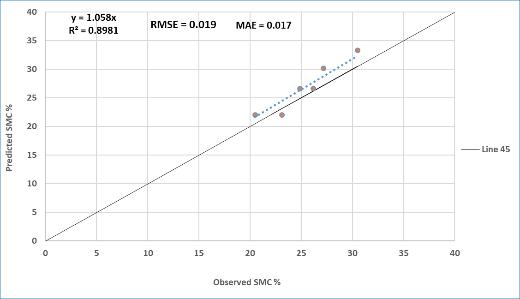
The results of the validation are shown below in figure (14a), whereas the best R2 calculated for Feb-2022 readings was equal to 0.89 and the values of RMSE and MAEwere0.019and0.017 respectively.Ontheother hand, the values of predicted SMC % ranged from 0 to 40 %, figure (14b), and these values were extreme from all predictions due to the antecedent rainfall storms before measuring.
(b)
International Research Journal of Engineering and Technology (IRJET) e-ISSN:2395-0056
Volume: 09 Issue: 12 | Dec 2022 www.irjet.net p-ISSN:2395-0072
(a)
Figure 14: a)
ofsoilmoisturevalidation b) PredictedsoilmoisturecontentSMC% (Feb-2022)
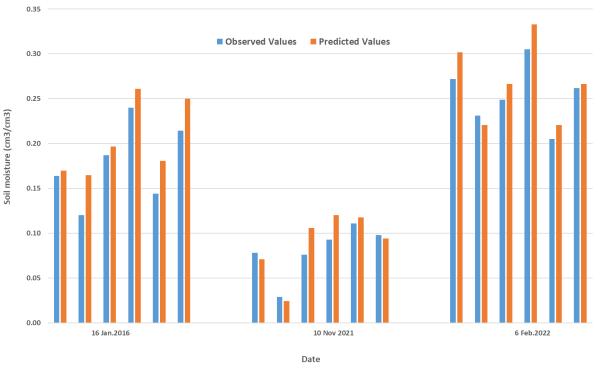
Fromthepreviousanalysisandresults,itcanbeconcluded that the soil moisture values were very sensitive to the intensity of rainfall and the duration of the dry period before the measurement date. Also, the results of the validation showed good indicators such as R2 that varied from0.80to0.89,RMSErangedfrom0.01to0.03,andthe MAE differed from 0.01 to 0.02 Moreover, 18 readings from all measurements were validated and both observed and predicted soil moisture are presented in figure (15). The figure shows that the differences between the observed and predicted soil moisture range from 0.01 to 0.04anditcanbeconsideredverysmall
Landsat-8 OLI/TIRS data were utilized to assess the Spatio-temporal distribution of the soil moisture content during three days (Jan.2016, Nov.2021, and Feb.2022) at 20 different locations in Agarma watershed on the Northwestern coast of Egypt One historical record of soil moisture content in 2016 was considered in the analysis, andnewmeasurementswereexecutedinNovember2021 and February 2022 using the Theta Probe soil moisture sensor type ML2X with 5 to 10 cm measuring depth The soil type of selected locations was defined from the laboratory texture analysis as sandy clay loam. While the landcoverofthestudyareawasclassifiedasrainfedcrops, sparse grass, and bare soil respectively. A correction procedure was applied to obtain both the land surface temperature(LST)andthesoilmoistureindex(SMI) from Landsat-8 band-10. The methodology included different corrections processing for band-10 such as the thermal atmosphericandradiometriccorrections ThemapsofLST and SMI were created for the three different dates In addition, a linear regression analysis was performed betweentheobservedsoilmoistureandestimatedSMIfor each date of ground measurements. Also, the validation was carried out to evaluate the generated relations between observed and predicted soil moisture. The best coefficient of determination R2 was equal to 0.89 for the data sets in February 2022 because there was no gap between the measuring and acquisition dates of these datasets. In addition, the generated three relations betweenobservedsoilmoisturecontentandestimatedsoil moisture index were correlated with the intensity of rainfall, whereas the values of soil moisture in November 2021 were the lowest as a result of rainfall absences. And the highest values were in January 2016 and February 2022 due to the antecedent rainfall storms. Therefore, it was concluded that the obtained relation between SMC and SMI using the data of November 2021 could be used
International Research Journal
Engineering
Technology (IRJET) e-ISSN:2395-0056
Volume: 09 Issue: 12 | Dec 2022 www.irjet.net p-ISSN:2395-0072
for estimating SMC in the dry season. While the first and the third generated relations represent the rainy season Lastly, the values of predicted soil moisture content were very close to the observed ones, and the methodology of obtaining the land surface temperature and soil moisture index using the thermal bands of Landsat-8 is recommendedtomapthesoilmoistureoveralargescale.
This research was supported by the Science and Technology Development Fund (STDF) through the researchproject“StrategiesforincreasingtheWATERuse efficiency of semi-arid Mediterranean Watersheds and agrosilvopastoral systems under climate Change (SWATCH)”whichwasawardedthroughaPRIMAcall.The PRIMA program is an Art.185 initiative supported and funded under Horizon 2020, the European Union's FrameworkProgramforEuropeanCommission.
[1] Carsten pathe, wolfgang wagner, Daniel sable, marcela doubkova, and Jeffrey b.basara, "Using ENVISAT ASAR Global mode data for surface soil moisture retrieval over Oklahoma, USA," IEEE transactions on geoscience and remote sensing, vol.47,No.2,2009,PP.468-479.
[2] Ansari, S., Deshmukh, R. R," Estimation of Soil Moisture Content: A Review" , International Journal of Theoretical and Applied Mechanics, vol.12, No.3, 2017,PP.571–577.
[3] Walker, J.P., Houser, P.R," A methodology for initializing soil moisture in a global climate model: assimilation of near-surface soil moisture observations". Journal of Geophysical Research–Atmospheres, vol.106, No.11, 2001, PP.11761–11774.
[4] Chen, Y.; Yang, K.; Qin, J.; Cui, Q.; Lu, H.; La, Z.; Han, M.;Tang,W, "EvaluationofSMAP,SMOS,andAMSR2 soil moisture retrievals against observations from twonetworksontheTibetanPlateau".J.Geophysics. Res.Atoms,vol.122,2017,PP.5780–5792.
[5] Rötzer,K.;Montzka,C.;Bogena,H.;Wagner,W.;Kerr, Y.H.; Kidd, R.; Vereecken, H, "Catchment scale validation of SMOS and ASCAT soil moisture products using hydrological modeling and temporal
stability analysis". J. Hydrol., vol.519, 2014, PP.934–946.
[6] C.Alvarez-Garreton,D.Ryu,A.W.Western,W.Crow, D.Robertson, "Impactofobservationerrorstructure onsatellitesoilmoistureassimilationintoarainfallrunoff model", 20th International Congress on ModellingandSimulation,2013,Adelaide,Australia.
[7] Lihua Xiong and Ling Zeng, "Impacts of Introducing Remote Sensing Soil Moisture in Calibrating a Distributed Hydrological Model for Streamflow Simulation",Water,vol.11,2019,PP.1-20.
[8] D. Chen, Engman, E.T. and Brutsaert, W, ”Spatial distribution and pattern persistence of surface soil moistureandtemperatureoverprairiefromremote sensing", Remote Sensing of Environment, vol.61, 1997,PP.347-360.
[9] Dubayah, R., Wood, E.F. and Lavallee, D, "Multiscaling analysis in distributed modeling and remote sensing: an application using soil moisture. In Quartrochhi, D., and Goodchild, M. (Eds.), Scale in remote sensing and GIS", New York, NY: Lewis, 1996,PP.93-112.
[10] A.M. Hassan, A.A. Belal,M.A.Hassan, F.M.Farag, E.S. Mohamed, "Potential of thermal remote sensing techniquesinmonitoringwaterloggedareabasedon surface soil moisture retrieval" , Journal of African EarthSciences,vol.155,2019,PP.64–74.
[11] Wang, L., Qu, J.J., Hao, X, "Forest fire detection using the normalized multiband drought index (NMDI) with satellite measurements" , Agric. Forest Meteorology,vol.148,No.11,2008,PP.1767–1776.
[12] Haas, J, "Soil moisture modelling using TWI and satellite imagery in the Stockholm region" M.Sc. dissertation, School of Architecture and the Built Environment, Royal Institute of Technology (KTH), 2010,Stockholm,Sweden,TRITAGITEX10-001.
[13] El-Zeiny,A.M.,Effat,H.A, "Environmentalmonitoring ofspatiotemporalchangeinlanduse/landcoverand itsimpactonlandsurfacetemperatureinEl-Fayoum governorate. Egypt". Remote Sensing Applications: SocietyandEnvironment,vol.8,2017,PP.266–277.
[14] Zeng, Y., Feng, Z., Xiang, N, "Assessment of soil moisture using Landsat ETM + Temperature /
International Research Journal of Engineering and Technology (IRJET) e-ISSN:2395-0056
Volume: 09 Issue: 12 | Dec 2022 www.irjet.net p-ISSN:2395-0072
vegetation index in semiarid environment". IEEE, 2004,PP.4306–4309.
[15] Moawad, B.M, "Geoscience general tool package" Max-Planck Institute fürChemie, 2012, Mainz, Germany.
[16] E.S. Mohamed, Abdelraouf Ali, Mohammed ElShirbeny, Khaled Abutaleb, Sameh M. Shaddad, "Mapping soil moisture and their correlation with crop pattern using remotely sensed data in arid region",TheEgyptianJournalofRemoteSensingand SpaceSciences,vol.23,2020,PP.347–353.
[17] Abdelmaqsoud Mostafa, "Retrieving soil moisture contentbyusingsatellitedata:a casestudyof Wadi Kharouba, Egypt" , MSc thesis, 2021, Mediterranean AgronomicInstituteofBari,Bari,Italy.
[18] Negm, A.M. and Abu-Hashim, M, "Sustainability of Agricultural Environment in Egypt: Part II", 2019, Soil-Water-PlantNexus.
[19] Ashraf N. El-Sadek and Ahmed H. Mohamed, "Simulation of the Effect of Land Cover Change on Water Balance and Sediment Yield of Wadi El Raml in the Northwestern Coast, Egypt" , Alexandria scienceexchangejournal,vol.38,No.4,2017.
[20] El-Nahry A and Rashash A, "Rain Water Harvesting Using GIS and RS for Agriculture Development in NorthwesternCoast,Egypt" ,JournalofGeography& NaturalDisasters,vol.5,No.2,2015.
[21] El Husieny A. Abou Hussien, M. Ismail, Wail M. Omran, and Mohamed S. Abou Alfotoh, "Water HarvestingforSustainableDevelopmentofEl-Hraka BasininTheNorthwesternCoastofEgypt" ,Egypt.J. Soil.Sci.Vol.60,No.3,2020,PP.263-276.
[22] Mohamed Ahmed Ibrahim Abdallah, "A rainfallrunoff model for water management in wadi systems based on hydropedological studies, MSC thesis, 2017, Mediterranean Agronomic Institute IAMB,Bari,Italy.
[23] Sobrino, J.A.; Raissouni, N.; Li, Z, "A comparative studyoflandsurfaceemissivityretrievalfromNOAA data". Remote Sens. Environ, vol.75, 2001, PP. 256–266.
[24] Jimenez-Munoz, J.C., Sobrino, J.A, "A generalized single-channel method for retrieving land surface temperature from remote sensing data" , J. Geophysics. Res. Vol.108, 2003, https://doi.org/10.1029/2003JD003480.
[25] Chandrasekar, K, "Geospatial Meteorological Products for Agricultural Drought Assessment" , NRSCUserInteractionMeet-PPT,2016.
[26] Willmott, C. J., Ackleson, S. G., Davis, R. E., Feddema, J. J., Klink, K. M., Legates, D. R., O’Donnell, J., and Rowe, C. M, "Statistics for the evaluation and comparison of models". Journal of Geophysical Research, vol.90, No.C5, 1985, PP.8995, https://doi.org/10.1029/jc090ic05p08995.
[27] US Geological Survey (USGS), "Landsat 8 (L8) ScienceData UsersHandbook",vol.2,2016,PP.60–61.
© 2022, IRJET | Impact Factor value: 7.529 | ISO 9001:2008 Certified Journal | Page1569