International Research Journal of Engineering and Technology (IRJET) e-ISSN: 2395-0056

Volume: 9 Issue: 12 | Dec 2022 www.irjet.net p-ISSN: 2395-0072
International Research Journal of Engineering and Technology (IRJET) e-ISSN: 2395-0056
Volume: 9 Issue: 12 | Dec 2022 www.irjet.net p-ISSN: 2395-0072
1PG Scholar, Shantilal Shah Engineering College, Bhavnagar, Gujarat, India 2Professor, Department of Civil Engineering, Shantilal Shah Engineering College, Bhavnagar, Gujarat, India 3Lecturer, Department of Civil Engineering, Sir Bhavsinhji Polytechnic Institute, Bhavnagar, Gujarat, India ***
Abstract - Soil erosion is currently the most inescapable issue worldwide because of its negative effects on soil fertility, loss of nutrients, loss of biodiversity, deposition of silt materials in the water bodies, and degradation of water quality. There is a vast body of published work on the use of the RUSLE model, also known as the Revised Universal Soil Loss Equation, in conjunction with GIS technology to forecast the hazards of soil loss and erosion in various regions is available. In this paper, we tried an assessment of the RUSLE model's applicability for the estimation of soil loss globally. The Scopus and Google Scholar databases as well as numerous papers about this subject were located. According to the review, RUSLE is the most popular model for estimating soil erosion. It takes into account factors like rainfall erosivity, soil erodibility, slope length and gradient, cover management, and support management practice. These factors depend primarily on climatic conditions, soil classification and properties, slope, land use/land cover, and crop state. Depending on the variability, researchers have developed a set of different empirical equations for these factors of RUSLE. In many parts of the world, this equation can be used to map soil loss The validation of soil loss using locally accessible data, uniformity in units of different RUSLE variables to avoid mistakes, and estimation of soil loss at monthly temporal data are some of the main future goals for its improvement.
Key Words: RUSLE, soil erosion, GIS, rainfall erosivity, soil erodibility, slope length and steepness, land use –land cover, conservation practice factor
Thetopsoillayerisexposedasaresultoferosionofthesoil. Itcontributestosoildegradation.Naturalphysicalforceslike water, wind, snow, and glaciers produce erosion. When naturalforcesexertmorepowerthanthesurfacetheyare actingoncanresist,thisprocesstakesplace.Simplyput,soil erosionistheseparationofsoilparticlesfromtheirparent materialasaresultofphysicalforces.Naturalgeomorphic processes such as soil erosion and deposition shape landforms and provide fresh parent material for the formationofsoilprofiles.Acceleratederosionisasituation in which the rate of erosion greatly exceeds the rate that would be expected in the absence of human land usage. Theseprocessescreatedifficultiesforsoilconservation.The
majorityofsoilfromfarmlandsiswashedawayabout10–40 timesfasterthanitisbeingreplaced,accordingto[1],which citedexamplesoftheUnitedStateslosingsoilatarateof10–40timesfasterthantheaveragereplacementrateandChina andIndialosingsoilatarateof30–40timesfaster.Around 85% of the world's land has been degraded due to soil erosion, the majority of which has happened after the conclusionofWorldWarIIandhasresultedina17%decline incropoutput.[2]Thesensitivityofthesoiltoerosion,the characteristicsofthelandcover,andmanagementpractises allhaveanimpactonsoilerosion.[3]–[5]
Soilerosionmodelsaidinlandmanagementbyhighlighting theareasvulnerabletosoilerosioninthebaselinescenario, prospective rates of erosion, and potential causes of soil erosion.Theyrangefromconceptualandempiricalmodels that are rather simple to more complex physics-based models [6]. Examples of these include the USLE and GISbasedUSLE,WEPP,AGNPS,LISEM,andEUROSEMmodels. The complexity, inputs, and requirements, the processes they reflect and how they are represented, the range of intendedusage,andthetypesofinformationtheyprovideas output, however, varies significantly amongst different models[6],[7].Detailedexaminationsofsoilerosionmodels ofvaryingcomplexityhavebeenconducted,howeverthey mainlyfocusontheinputrequirementsandapplications.[3], [6].
Theaverageannualrateofsoilerosion(measuredintonnes per unit area) for a particular agricultural system, management strategy, soil type, rainfall pattern, and topographical combination is determined using the empiricalUSLEmodel.Itsdevelopmentattheplotscalewas initiallyfocusedontheagriculturalplotsoftheUnitedStates ofAmerica[8].TheUSLEpredictsthelong-termaverageand yearly rate of erosion on a field slope based on rainfall patterns, soil types, topographies, crop systems, and management methods [9]. An upgraded version of USLE (RUSLE) was released, and it included updated rainfall erosivitymapsandanimprovedalgorithmforcomputingthe various USLE variables [10]. RUSLE altered the model's incorporation of topographic influence, adding additional variablestodenotesoilconservationmethods,andincreased fluctuationsinsoilerodibilitycausedbyfreeze-thawandsoil moisture. He also offered a technique for calculating management and cover parameters [11]. To handle more
International Research Journal of Engineering and Technology (IRJET) e-ISSN: 2395-0056
Volume: 9 Issue: 12 | Dec 2022 www.irjet.net p-ISSN: 2395-0072
complexfieldsettings,theRUSLE2frameworkisanupdated database of factors and a computer interface [12]. By utilisingrunoffandpeakflowratetoestimateevent-based soilloss,theMUSLEisanextensionthatallowsforworkat finer temporal resolution [13]. These models are used all aroundtheworldbecauseoftheirapparentsimplicityand lowdatarequirements.
BriefdiscussionsoftheRUSLEasanempirical model,whosecomponentsarefrequentlyincludedintomore complicated conceptual or physics-based soil erosion models, have been reported in extensive reviews of soil erosionmodellingandvarietiesofsoilerosionmodels[3,[6], [14].Becausecompetingmodels,suchtheWEPP,aredifficult formostuserstouse,RUSLEisstilloftenused.Additionally, other researchers discovered a successful technique for figuringoutthescopeandspatialdistributionoferosionby mergingremotesensingandGISmethodswithsoilerosion models like RUSLE. GIS is an effective tool for combining variousdatasetsandassessingdynamicsystems,suchsoil erosion.
The objective is to review the current literature on erosion assessment, which will cover 1) the traditional applicationoftheRUSLEmodeltoassesserosionand2)the applicationofGISandremotesensingmethodstoforecast and estimate the amount and geographical distribution of erosionatcatchmentorregionalsizesusingRUSLE.
Accordingtothehistoryofsoilerosion,therearethreekey riskfactors:rainfallandrunoff,thepropertiesofthesoil,and plant cover that retains soil. According to [15], Zingg developedtheinitialequationforquantifyingfieldsoilloss in1940.Theeffectsofslopelengthandslopesteepnesson erosionweremathematicallydescribed.[16]addsadditional croppingsystemsandsupporttechniquestotheequation. Accordingto[10],Browningandcolleagues(1947)modified the Smith equation by including soil erodibility and management factors and created extensive tables of the relativefactorvaluesforvarioussoiltypes,croprotations, andslopelengths.Themethodfocusedonassessingslopelengthlimitsfordifferentcroppingsystemsoncertainsoils, as well as slope steepness with or without terracing, contouring,orstrip-cropping.
[15] provided a method for calculating soillossesfromclaypansoilareas.Therewerepercentages ofsoillossforcontourfarming,stripfarming,andterracing on varied slopes. The suggested slope length upper and lower limitations were specified for contour farming. The equation is also only partially useful because it does not explain what happens to silt once it is eroded. The USLE modelisunabletoanticipatethepaththaterodedmaterials and sediments take as they move from hill slope sites to
waterbodies. Thedesignof strategiestocontrolpollution associated with erosion runoff and on agricultural land requires knowledge of what happens in individual rainstorms,rarelyonaminute-by-minutebasis,inorderto predictthesizeandtimingofpeakdischargesofwaterand sediment from hill slopes to rivers. The USLE is unable to provide this because it only anticipates mean annual soil loss.TheUSLEwasenhancedinordertohighlighttheneed foranalternativestrategy.
RUSLEhasbeenusedinavarietyofsituations, including as large-scale watersheds, tropical watersheds, watersheds where agriculture is the main industry, areas withdistinctwetanddryseasons,andareaswithdynamic changes in land cover patterns, agricultural cropland, and development.ThreeessentialdatabasesmakeuptheRUSLE model: 1) the meteorological and survey database, which contains the monthly temperature, precipitation, and contour data required to calculate the slope length, steepness factor, and erosivity factor (LS). 2) The crop databasecontainsthedatarequiredtocalculatethesurface coverfactor(C).3)Thesoildataincludesinformationonsoil characterization and soil survey, which can be used to calculatethesoilerodibilityfactor(K).
The use of GIS technology in conjunction with erosionmodelsliketheRUSLEhasreportedlyincreasedthe effectiveness of estimating the spatial distribution and magnitudeoferosionriskwithreasonablecostsandbetter accuracy, according to a number of researchers whose findingshavebeenpublishedintheliterature.[17]–[24].
TheRUSLEmodelcalculatestheaverageannual soilerosionlossbyaccountingforthefivevariablesgivenin equation 1 [10]. The RUSLE is often implemented by estimatingeachofthemodel'sfactors,whichisbasedona largebodyofresearch.Inordertoanticipatethesevariables, previous researchers have developed a number of techniques, including the use of climatic data, soil and geologicalmaps,remotelysensedsatelliteimages,empirical formulas,anddigitalelevationmodels(DEM)producedfrom varioussources.
TheRUSLEisdefinedas: A=RxKxLxSxCxP Where, A-Potentiallong-termaverageannualsoillossint ha-1yr-1 R-RainfallerosivityfactorinMJmmha-1h-1yr-1
International Research Journal of Engineering and Technology (IRJET) e-ISSN: 2395-0056
Volume: 9 Issue: 12 | Dec 2022 www.irjet.net p-ISSN: 2395-0072
K-Soilerodibilityfactor,MghMJ-1mm-1
LS-Slopelengthinm–slopegradientfactorin%
C–Covermanagementfactor
P-Supportpracticefactor
Therainfallerosivityfactor(R)assessesthekineticenergy impactofprecipitationandforecaststheamountandrateof runoffthatisdirectlyrelatedtothatprecipitationevent.The Rfactor,whichisconsideredbymanyexpertstobethemost importantelementinRUSLE'sassessmentoferosion,hasa high correlation with soil loss at numerous regional and worldwiderainfallsitestations.[8],[11],[25].Researchers often employ a variety of calculations based on local characteristics and historical rainfall data to calculate the erosionfactor EstimatingtheRfactormightbechallenging whentherearen'tenoughdataorclimatestations.[25]ran across a similar dearth of climate information when assessing the risk of erosion in a particular watershed in Mexico.Theyusedmuchimprovedtechnologiestogenerate rainfall data. Utilizing techniques like kriging and inverse distancefromtheremotestations,theyinterpolatedrainfall usingremoterainfallstationsasasource.Dependingonthe classification of a research area's climate, [26] published variousR-factorformulae.
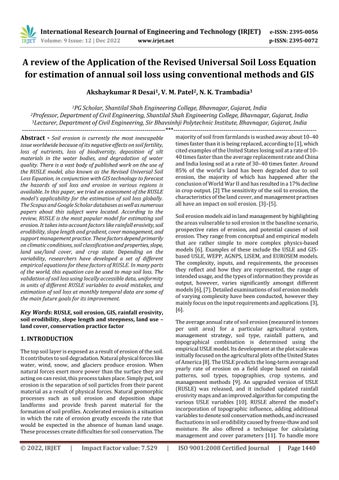
The equation created by [28] for the Siruvani River watershedintheAttapadyValleyofKeralawasappliedin Indiaby[27].
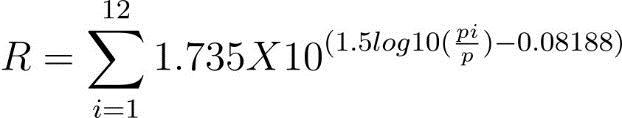
Tropicalclimatezonescircletheequatorialregion. Allyearlong,itpoursheavilyonaregularbasis.TheRfactor developed by [34] was used by [33] because of the area's humidclimateandstrongrainfalleffects.
Rain10representsmonthlyprecipitationonlywhenrainfall Cequals10mm;otherwise,rain10issettozero,whereNis thenumberofyearsofobservations.Thenumberofdaysin amonthwhererainfallamountCis10mmisday10.With suchalargemonthlyrainfall,theaforementionedequation generates a high amount of rainfall erosion potential (i.e. rain10). It also demonstrates that, for a given quantity of rainfall,ifthenumberofrainydaysisreduced(i.e.,toDays 10),theseverityoftherainfallandthelikelihoodoferosion willriseasexpected.
A tropical wet and dry climate with reduced rainfall predominates between 5 and 20 latitudes. In this kind of climate zone, rain typically only falls during one season, leaving the other seasons without rain. There is a significantdiscrepancyinRfactorcomputationinthisless humidclimateregionbecauseofthelackofrainfall.
[35]Usedamodelthatwasbasedontheeasily accessible information on that region's annual average rainfall.Theequationiswrittenasfollows:
(4)
(1)
Where Pi is monthly rainfall (mm), R is rainfall erosivity factor (MJ mm ha-1 h-1 year-1), and P is yearly rainfall (mm).
[29]useditfortheNethravathiBasinintheMiddle WesternGhatsinIndia;[30]useditfortheKuttiyadiriver basininNorthernKerala;and[31]useditfortheKaliriver basin in Karnataka. This equation shows the concept of weightedaverageprecipitationandcanbeusedinavariety ofmeteorologicalconditions.
[32] Malaysia adopted the following equation created by Kassam (1992) for his investigation of the Pahang river basin:
(2)
WherePistheinformationontheavailableyearlyaverage rainfallandRistherainfallerosivityfactor.
Thefollowingwascreatedby[36]asanother Rfactormodel:
(5)
Where"A"standsfortheaverageannualprecipitationinmm and"R"standsfortherainfallerosivityfactor.
In semi-arid climate zones, precipitation is insufficient to cover potential evapotranspiration. The numerousvarietiesofsemi-aridclimatesaredeterminedby temperaturevariation,whichrepresentstheemergenceof differentformsofecology.
[37]CreatedanRfactormodelspecificallyfor China'sdryandsemi-aridclimatezones:
International Research Journal of Engineering and Technology (IRJET) e-ISSN: 2395-0056
Volume: 9 Issue: 12 | Dec 2022 www.irjet.net p-ISSN: 2395-0072
WhereI30B isastorm'smaximum30-minintensity(mm/h), Risthemeanannualrainfallerosivityfactor(MJmmha-1h1 year-1), and Pf is yearly rainfall (mm). The paucity of rainfallinthiszoneisindicatedbyFactorI30B
IntheKianjukicatchment,Embu,CentralKenya, [2] adopted the [10] model, which was used in eastern Africa.
theChineseMiyunwatershed[43].Thisequationwasused by[44]fortheCentralSpanishPyrenees.InSantoDomingo County, Central Chile, South America, [45] applied this empiricalapproach.FortheKeiskammacatchmentinSouth Africa,[40]employed[8]modellingtechnique.OftheNun RiverwatershedinDehradun,Uttarakhand,[46]employed thismethodology.[47]appliedittoKothagiriTaluk,Nilgiri, in Tamil Nadu's northwest. For their investigation in the regionnorthofPune,Maharashtra,[48]usedthemodel.It was used to the Jaipanda watershed in Bankura, West Bengal,by[49].
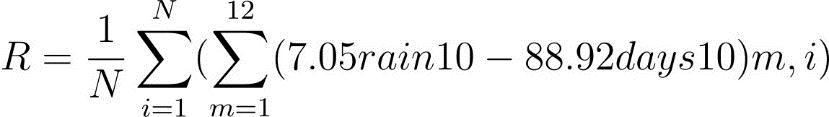
(7)
WhereJisanindexthatindicatesthenumberofyearsused to generate the mean of rainfall data, K is an index that indicatesthenumberofstormsthatoccurredinayear,nis the number of years used to obtain the rainfall erosivity factor (R), and M is the number of storms that occur in a year.E isthetotal kinetic energyproduced bythe rainfall (MJha-1),I30isthemaximumof30-minrainfallintensity (mmh-1).
For their investigation in the Lake Wollumboolacatchment,southofSydneyandslightlynorth of Jervis Bayon, on the New South Wales South Coast, Australia,[38]employedthemodelcreatedby[10].
Under typical conditions, the soil's resistance to erosionbroughtonbytheimpactofraindropsaswellasthe rateandvolumeofrunoffthatcomesfromthoseimpactsis shownbythesoilerodibilityfactor(K).Accordingto[39], soil erodibility depends on geological and soil traits as structure, texture, intrinsic material, porosity, organic content, etc. High silt percentages lead to exceptionally erodible soils despite the presence of sizable volumes of sandandclay[40].
Theamountoforganicmatterorcarboninthesoil, themolecularbondingorstructuralclassthesoilbelongsto, theparticlesize,andtherateofpermeabilityareallelements thatdeterminehoweasilysoilerodes,accordingto[8]. He producedanomographandamodelequationbasedonthe equation.
WhereMisthegrainsizeparameter,whichistheproductof thesiltcontent(%)(Particlesbetween0.002and0.1mmin diameter)and(100%clay),andOMistheorganiccontent (%) of the soil. The parameters "s" and "p" describe, respectively,thestructureandpermeabilityofthesoil.
Thisconceptwasappliedby[41]inFortHood, Texas, USA. This model was applied by [42] to the WangjiaqiaowatershedinZigui,Hubei,China.employedin
[50]Createdamodelthattookintoaccounttheamountof sand, silt, and clay in the soil as well as the degree of saturation. (9)
WhereA3isthepercentageofthesoil'sbasesaturation,A4 isthepercentageofsiltpresent(0.002-0.050mm),andA5is thepercentageofsandinthesoil.WhereA1isthepercentof unstable aggregates 0.250 mm, A2 is the product of the percentofsilt(0.002-0.01mm)andsand(0.1-2mm)present inthesample,and(0.1–2mm).Thismodelwasemployedby [2] to estimate the K factor in the Kenyan Highlands of Africa.
Using ideas from the [8] nomograph, [51] created a new model:
(10)
Kstandsforsoilerodibilityfactor(tha-1perunitof R),Mforparticlesizeparameter(%silt+%veryfinesand)x (100-%clay),'a'fororganicmattercontent(in%),'b'for soilstructurecode,and'c'forsoilpermeabilityclass.Ofthe PathriRaosub-watershedinUttarakhand,
[52] utilised it. For the Upper Subarnarekha River Basin in Jharkhand, [53] adopted this equation. Model [8] [54]modifiedasfollows: (11)
WhereM={(%silt+%veryfinesand).(100–%clay)},αis organic matter (in %), β is structure code and γ is permeabilityrating.[31]UseditfortheNethravathiBasin, themiddleregionofWesternGhats,India.
Academics are currently using existing soil mapsanddigitisingthemtocreatevectorcoveragemapsin areaswheregovernmentdepartmentsprovidesoilmapsin hard copy format. Then, using data from sources like the AgriculturalHandbookortheFAOsoilclassificationsystem, assuggestedby[55]orusedby[25],thesoilsareseparated intosoilclasses.Vectormapsweretransformedintoraster mapsusingArcGIStechnologies.
International Research Journal of Engineering and Technology (IRJET) e-ISSN: 2395-0056
Volume: 9 Issue: 12 | Dec 2022 www.irjet.net p-ISSN: 2395-0072
The methodology for applying the soil erodibility factor and rainfall erosivity factor, which primarily depend on climatic conditions and soil characteristicregressiononsoilproperties,respectively,was found to differ significantly after examining numerous RUSLEapplicationsusedallovertheworld.
Theinfluenceoflocaltopographyontherateofsoilerosion is described by the slope length (L) and steepness (S) components,whichcombinetheimpactsofslopelength(L) andslopesteepness(S)(S).Theslope'slengthincreasesboth thecumulativerun-offsandrate.Ahigherlandslopecauses runofftomovemorequickly,whichcausesseriouserosion.
When evaluating the topographic impact on erosion,manyacademicstypicallyincludebothcomponents (Land S) together. Thanks to GIS technologies, a lot of academicsarecurrentlycreatingtopographydatausingthe DEM. The DEM is produced using existing or digitalized contours at predetermined intervals. There are many formulas available for computing topography. Several researchhaveutilisedthestrategyadvisedby[15]intheir analysis. (12)
A GIS-integrated prototype of the Sediment AssessmentToolforEffectiveErosionControlwascreated by [56] in order to provide an easy GIS interface for assessingsoilerosionandsedimentproductionwithoutthe requirement for additional input parameter data beyond those for the USLE model (SATEEC). They applied the method suggested by [15] in the prototype SATEEC to computethetopographicalfactorfromtheDEM,providing anupperboundofslopelengthof122m.
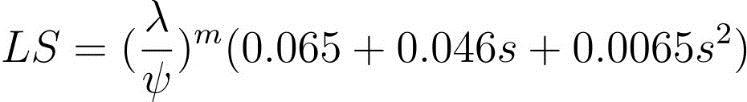
[57] developed the LS factor, which is a dimensionless factor in which L is defined as the relative slope length (metres), leaving the LS values virtually the same.Thebasicslopelengthwassetat22mandthebasic slope gradient was set at 9%. The LS factor appears as follows: (13)
thevalueof Ψis22.13forSIunitsbecause the(LS)factoristheratioofsoillossperunitareafroma fieldslopetothatfromalengthof22.13metres,whereλis the flow path length (m or feet), which is denoted as λ = (flowaccumulationXcellsize).Sstandsforthetypicalslope gradient(%).m=0.2fors<1,0.3for1<=s<3,0.4for3<=s<5, 0.5for5<=s<12and0.6fors>=12%.
[57] Changed the aforementioned model by substitutingthesineoftheslopeangle(θ)fortheaverage slopegradientpercentage(%).
Whereθistheslopeangle.Thevalueof‘m’is0.5iftheslope is5%ormore,‘m’is0.4iftheslopeis3.5–4.5%,‘m’is0.3if theslopeis1–3%,and‘m’is0.2onuniformwheretheslope islessthan1%.
ThisequationwasusedinIndiaby[53]forthe UpperSubarnarekhaRiverbasininJharkhand.[58]usedit fortheMirzapur, Uttar Pradesh,India,Khajuri watershed, Barkachha. [59] used this model in the Kallar Watershed, which is located in the northwest of Tamil Nadu, in the EasternGhats.Itwasusedby[31]inIndia'smiddlewestern Ghatsregion,theNetharavthibasin.[60]usedthisequation fortheWestBengalregion'sBakreshwarriverbasin.
Soillossissignificantlyinfluencedbythekindandquantity of plant cover [61]. In essence, vegetation prevents raindrops from impacting the soil by diffusing the kinetic energy of the rain before it reaches the soil's surface. The amount of plant cover, stage of growth, and kind of vegetation all directly affect the cover management factor (C). Before raindrops hit the soil surface, ground cover usuallydiffusestheirerosivestrength;asvegetationcover rises,soilerosiondeclines.Therefore,vegetationcoverand cropcovertypesarecrucialincontrollingrunoffanderosion rates.
Basedonwaterfeatures,agriculturalland,sparse vegetation,densevegetation,barrenland,andbuilt-upland, thecovermanagementfactorwasfirst developed by [62]. (Table1).
Table -1: Cfactordevelopedby[62]
Class of Land Use & Land Cover C factor Value
Built-up 0.000
AgriculturalLand 0.400
DenseVegetation 0.004
SparseVegetation 0.030
BarrenLand 1.000
Waterbodies 0.000
The surface cover factor has historically been determined empirically using measurements of numerous variables connectedtogroundcoversgatheredinsampleplots.The
International Research Journal of Engineering and Technology (IRJET) e-ISSN: 2395-0056
Volume: 9 Issue: 12 | Dec 2022 www.irjet.net p-ISSN: 2395-0072
weightedaveragesoillossratios(SLRs),whicharederived fromanumberofsub-factorsincludingpreviouslanduse, canopycover,surfacecover,andsurfaceroughness[64],can alsobeusedtocomputeit.
However, the method that is currently most frequentlyusedtodeterminethesurfacecoverfactoristo classify the land use and cover using satellite data using remote sensing techniques. Lu et al. (2004) employed fraction images from spectral mixture analysis (SMA) of LandsatETM+picturestoestimatethesurfacecoverintheir studyestimatingthedangerofsoilerosionintheBrazilian Amazonian region. The C factor was calculated using the equationbelowundertheassumptionthathigherlevelsof vegetationcoverresultinlesssoillossandlowerlevelsof vegetation cover result in more losses. They do, however, issue a warning that given that surface attributes are recorded at the time of image acquisition, there is still a requirement to calibrate obtained results using local (reference)datawhendevelopingtheCfactor;
For their soil erosion prediction study in Greece, [9] used the NDVI approach to determine the C factor. In accordance with [65], equation was utilised to constructtheCfactorsurfacebasedontheNDVIreadings.
(17)
Where;αandβareunitlessparametersthatdeterminethe shapeofthecurverelatingtoNDVIandCfactor.
TheCfactorwasmainlyestimatedonthebasis of various land cover types. [66] developed a model that shows the linear link between the C factor and NDVI. Vegetationdifferenceindexnormalised.Theconceptofthe NDVIwascreatedby[67];
(18)
Where,NDVI=(NIR–RED)/(NIR+RED)
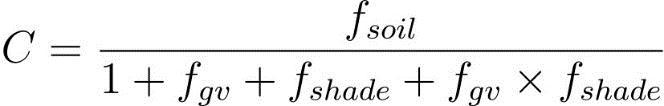
(15)
Where;C=VegetativecoverandManagementfactor,andfgv, fsoil, fshade = values of green vegetation, soil, and shade endmembers. The three fraction values of soil, green vegetation, and shade endmembers. The values of fgv, fsoil, fshade parametersrangefrom0to1andtheirsumequals1.
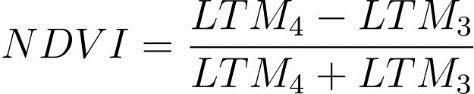
The remote sensing techniquethatismostfrequentlyusedtodeterminethe C factoristheNormalizedDifferenceVegetationIndex(NDVI). Thisindex,whichisdeterminedusingtheequationbelowfor Landsat-ETM,displayshowmuchenergytheplanetreflects under various surface cover conditions. The NDVI values' two bands range from -1.0 to +1.0. When the measured spectral response of the earth's surface is roughly comparabletobothbands,theNDVImeasurementswillbe closertozero.Alargedifferencebetweenthetwobandsis whatcausesNDVIvaluesattheboundariesofthedatarange [9].
InIndia'sJharkhandprovince,[68] employeditinthe Kharkai river basin. The Subarnarekha river basin in Jharkhand,India,wasthesubjectofitsapplicationby[69].In Bankura,WestBengal,India'sJaipandaWatershed,[49]used it.
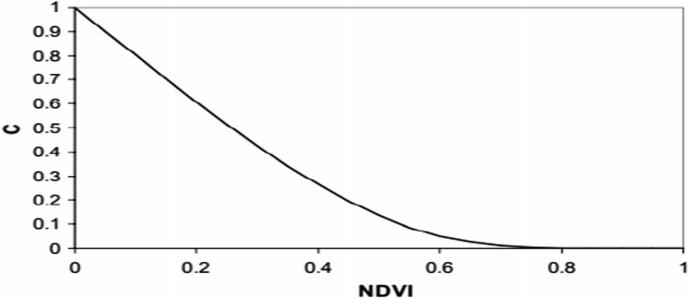
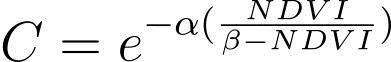
The C factor does not linearly vary with NDVI, as initiallynotedby[65].Inactuality,NDVIcausestheCfactor todeclinedramatically.HecreatedalinkbetweenNDVIand Cfactorthatdecaysexponentially;
(19)
whereα,andβareparametersdeterminingtheshapeofthe NDVI-Ccurve.Aα-valueof2andaβ-valueof1seemtogive reasonableresults[65](Fig.1).
(16)
Thereflectanceofactivelygrowingvegetationis higher in the infrared portion of the spectrum (Band 4, LandsatTM)thaninthevisibleregion(red,Band3,Landsat TM),whichresultsinahigherNDVIrating.Cloudsandwater bodies have negative or zero NDVI values, while low vegetativesurfacecoverhasvaluesbetween -0.1and+0.1 [9].
Fig.1TheexponentiallineusedforCcalculationfromNDVI [65]
ThisformulawasthebasisforalotofIndian researchers'work.FortheSiruvaniRiverwatershedinthe Attapady valley of Kerala, [27] utilised this equation. [70] usedthismodelfortheUpperSouthKoelBasininJharkhand. InKothagiriTaluk,Nilgiri,inthenorthwestofTamilNadu, [47] employed this model. [59] used this model in the
International Research Journal of Engineering and Technology (IRJET) e-ISSN: 2395-0056
Volume: 9 Issue: 12 | Dec 2022 www.irjet.net p-ISSN: 2395-0072
northwestregionofTamilNadu,theeasternportionofthe Western Ghats, and the Kallar watershed. For the Khajuri watershed,Barkachha,Mirzapur,UttarPradesh,[58]usedit. FortheKuttiyadiriverbasininNorthernKerala,[30]usedit. [29] applied this equation to the Karnataka region's Kali riverbasin.
The conservation or support practise factor (P) demonstratestheeffectsoftakingmeasurestoreducethe rate and volume of runoff, which reduces the rate and volumeofsoilerosion.ThePfactorcalculatesthepercentage of soil loss for each support technique, including contour farming, tillage, and slopes both uphill and downhill [57]. [10]. the primary support methods include cross-slope farming, terracing, contour farming, strip cropping, and grassedstreams.
Theprocessofcreatingempiricalequationsisthe onethatismostusuallyusedtocalculatetheconservation factor.[71]usedtheWennertechniquesuggestedby[72]to obtaintheconservationfactorvaluesgivenbytheequation belowinChina.Theslope,whichiseasilyobtainedfromthe providedDEM,istheonlyquantityrequiredfortheequation. Inplaceswithoutconservationandmanagementstrategies basedonthisequation,thePfactorvaluecanbeemployed.
P=0.2+0.03xS (20)
The P factor estimates the fraction of soil loss for that supporttechniqueinthepresenceofanuphillanddownhill slope, contour farming, and tillage [57] and [10]. Contour farming, terracing, strip cropping, cross-slope agriculture, andgrassedstreamsarepopularsupporttechniques.
ThePvaluesarecalculatedbydividingtherateand total amount of soil loss resulting from a certain support methodbythesoillossoccurringfromrowfarmingunder bothuphillanddownhillslopeconditions,accordingto[73]. The range of P factor values is 0 to 1. The greatest scores amongthesevaluesgotoareasdevoidofanyconservation measures(suchasgrasslandsandopenspaces),whilethe lowest ratings go to developed land and plantations that utilisecontourcropping.
Theconservationpractisefactor(P)hasnot yet been defined; the researchers primarily used the P factor's [8] idea in the study region. The P factor chart developedby[8]incorporatesallvarietiesofconservation techniques,andthetableissimplyadjustabletoresearchers' ownresearchrequirements.
Table -2: Pfactorforcontourploughingdevelopedby[8]
Land Slope (%) P Factor Value
Maximum Length (feet)
1-2 0.6 400 3-5 0.5 300 6-8 0.5 200 9-12 0.6 120 13-16 0.7 80 17-20 0.8 60 21-25 0.9 50
However, because there aren't enough conservation practises, they are frequently viewed as a single entity globally.
Thefive-factorrastermapwasoverlaidwiththesoilerosion potentialandriskmapusingGIStechnologiestodetermine theoverallloss.Usually,themapisbrokenupintodifferent danger categories, ranging from very low to very high threats. The slope and surface cover both affect risk. The Brazilian Amazonian region was the subject of a study by [74], who found that the danger of soil loss varied from extremelylowtolow.[9]foundaclearcorrelationbetween steep slopes and insufficient surface cover in the Crete watershed.
Accordingtotheextensiveliteraturestudy,theRUSLEmodel has been widely used and has shown to be helpful in estimating soil losses due to erosion in many parts of the world.DespitethefactthatRUSLEisausefulmodelforuse at local (small) scales, the integration of RUSLE and GIS techniques has improved the assessment of spatially distributedsoilerosioninvastcatchmentregions.According to the literature, the five fundamental components of the model canbederivedfrom a rangeofdata,suchasDEMs, weatherdata,soilmaps,andremotesensingimages.Because itprovidesthenecessarycapabilities,GIStechnologyenables the investigation of a larger study area (large-scale watershed)insoilerosionstudies.
Future RUSLE model-based GIS research on soil erosion shouldtakeintoaccountthefollowingsuggestions:
1. Further research into more efficient methods to determine the conservation and management component is required to enhance future studies (P).
International Research Journal of Engineering and Technology (IRJET) e-ISSN: 2395-0056
Volume: 9 Issue: 12 | Dec 2022 www.irjet.net p-ISSN: 2395-0072
2. Acrucialstepinverifyingtheaccuracyandcalibre of the results is to validate the soil erosion loss usinglocallyaccessiblereferencedata.
3. TofurtherimprovetheprecisionandutilityofGIS, additional soil erosion models, such as AGNPS, WEPP,LISEM,andEUROSEM,arealsoapossibility.
4. Because the origin and calibre of the data are so importanttoGIS,greatcaremustbegivenduring the pre-processing of the data, which includes converting to numerous formats, georeferencing, datainterpolation,andregistration.
5. A statistical analysis of the RUSLE parameters is requiredtoascertaintheireffectonsoilerosionin ordertodeterminewhichparameterismostcrucial.
[1] D. Pimentel et al., ‘Food Versus Biofuels: EnvironmentalandEconomicCosts’, Hum. Ecol.,vol.37,no. 1,pp.1–12,Feb.2009,doi:10.1007/s10745-009-9215-8.
[2] S.D.Angima,D.E.Stott,M.K.O’Neill,C.K.Ong,and G. A. Weesies, ‘Soil erosion prediction using RUSLE for centralKenyanhighlandconditions’, Agric. Ecosyst. Environ., vol.97,no.1–3,pp.295–308,Jul.2003,doi:10.1016/S01678809(03)00011-2.
[3] H.AksoyandM.L.Kavvas,‘Areviewofhillslopeand watershed scale erosion and sediment transport models’, CATENA, vol. 64, no. 2–3, pp. 247–271, Dec. 2005, doi: 10.1016/j.catena.2005.08.008.
[4] W. David, ‘SOIL AND WATER CONSERVATION PLANNING: POLICY ISSUES AND RECOMMENDATIONS’, J. Phillipines Dev.,vol.15,no.1,1988.
[5] P.Panagos et al.,‘Thenewassessmentofsoillossby water erosion in Europe’, Environ. Sci. Policy, vol. 54, pp. 438–447,Dec.2015,doi:10.1016/j.envsci.2015.08.012.
[6] W. S. Merritt, R. A. Letcher, and A. J. Jakeman, ‘A reviewoferosionandsedimenttransportmodels’, Environ. Model. Softw.,vol.18,no.8–9,pp.761–799,Oct.2003,doi: 10.1016/S1364-8152(03)00078-1.
[7] J. Ismail and S. Ravichandran, ‘RUSLE2 Model Application for Soil Erosion Assessment Using Remote SensingandGIS’, Water Resour. Manag.,vol.22,no.1,pp.83–102,Jan.2008,doi:10.1007/s11269-006-9145-9.
[8] W. H. Wischmeier and D. D. Smith, Predicting Rainfall Erosion Losses.USDA,1978.
[9] M.Kouli,P.Soupios,andF.Vallianatos,‘Soilerosion prediction using the Revised Universal Soil Loss Equation (RUSLE) in a GIS framework, Chania, Northwestern Crete,
Greece’, Environ. Geol.,vol.57,no.3,pp.483–497,Apr.2009, doi:10.1007/s00254-008-1318-9.
[10] K.G.RenardandFosterG.R, Predicting Soil erosion by water: A guide to conservation planning with the Revised Universal soil loss equation (RUSLE).USDA,1997.
[11] Renard K.G and Freimund J R, ‘Using monthly precipitation data to estimate the R-factor in the revised USLE’, J. Hydrol.,vol.157,pp.287–306,1994.
[12] FosterG.R,ToyT.E,andRenardK.G,‘Comparisonof theUSLE,RUSLE1.06c,andRUSLE2forApplicationtoHighly Disturbed Lands’, presented at the First Interagency ConferenceonResearchinWatersheds,Oct.2003,pp.154–160.
[13] S.H.R. Sadeghi,L.Gholami, A.Khaledi Darvishan, and P. Saeidi, ‘A review of the application of the MUSLE modelworldwide’, Hydrol. Sci. J.,vol.59,no.2,pp.365–375, Feb.2014,doi:10.1080/02626667.2013.866239.
[14] J.deVenteandJ.Poesen,‘Predictingsoilerosionand sediment yield at the basin scale: Scale issues and semiquantitativemodels’, Earth-Sci. Rev.,vol.71,no.1–2,pp.95–125,Jun.2005,doi:10.1016/j.earscirev.2005.02.002.
[15] I. D. Moore and G. J. Burch, ‘Physical Basis of the Length-slopeFactorintheUniversalSoilLossEquation’, Soil Sci. Soc. Am. J.,vol.50,no.5,pp.1294–1298,Sep.1986,doi: 10.2136/sssaj1986.03615995005000050042x.
[16] Smith L.P, ‘Agricultural Climate of England and Wales:ARealAverages1941-70’, Technical Bulletin,1976.
[17] C. Cox and C. Madramootoo, ‘Application of geographicinformationsystemsinwatershedmanagement planninginSt.Lucia’, Comput. Electron. Agric.,vol.20,no.3, pp. 229–250, Aug. 1998, doi: 10.1016/S01681699(98)00021-0.
[18] A. M. Dziewonski, A. L. Hales, and E. R. Lapwood, ‘Parametrically simple earth models consistent with geophysicaldata’, Phys. Earth Planet. Inter.,vol.10,no.1,pp. 12–48,May1975,doi:10.1016/0031-9201(75)90017-5.
[19] E. H. Erdogan, G. Erpul, and İ. Bayramin, ‘Use of USLE/GISMethodologyforPredictingSoilLossinaSemiarid AgriculturalWatershed’, Environ. Monit. Assess.,vol.131,no. 1–3, pp. 153–161, Jun. 2007, doi: 10.1007/s10661-0069464-6.
[20] M.Yitayew,S.J.Pokrzywka,andK.G.Renard,‘USING GISFORFACILITATINGEROSIONESTIMATION’, Appl. Eng. Agric., vol. 15, no. 4, pp. 295–301, 1999, doi: 10.13031/2013.5780.
[21] A.A.MillwardandJ.E.Mersey,‘AdaptingtheRUSLE to model soil erosion potential in a mountainous tropical
2022, IRJET | Impact Factor value: 7.529 | ISO 9001:2008 Certified Journal |
International Research Journal of Engineering and Technology (IRJET) e-ISSN: 2395-0056
watershed’, CATENA,vol.38,no.2,pp.109–129,Dec.1999, doi:10.1016/S0341-8162(99)00067-3.
[22] H.Mitasova,J.Hofierka,M.Zlocha,andL.R.Iverson, ‘Modellingtopographicpotentialforerosionanddeposition usingGIS’, Int. J. Geogr. Inf. Syst.,vol.10,no.5,pp.629–641, Jul.1996,doi:10.1080/02693799608902101.
[23] Molnar D.K, ‘Estimation of Upland Erosion using GIS’, J. Comput. Geosci.,vol.24,no.2,pp.183–192,1997.
[24] Wilson J.P and Lorang M.S, Spatial Models of Soil erosion and GIS.1999.
[25] A.A.MillwardandJ.E.Mersey,‘AdaptingtheRUSLE to model soil erosion potential in a mountainous tropical watershed’, CATENA,vol.38,no.2,pp.109–129,Dec.1999, doi:10.1016/S0341-8162(99)00067-3.
[26] V. Naipal, C. Reick, J. Pongratz, and K. Van Oost, ‘Improving the global applicability of the RUSLE model –adjustment of the topographical and rainfall erosivity factors’, Geosci. Model Dev.,vol.8,no.9,pp.2893–2913,Sep. 2015,doi:10.5194/gmd-8-2893-2015.
[27] V.Prasannakumar,R.Shiny,N.Geetha,andH.Vijith, ‘Spatialpredictionofsoilerosionriskbyremotesensing,GIS and RUSLE approach: a case study of Siruvani river watershedinAttapadyvalley,Kerala,India’, Environ. Earth Sci., vol. 64, no. 4, pp. 965–972, Oct. 2011, doi: 10.1007/s12665-011-0913-3.
[28] Arnoldus H, Boodt M, and Gabriels D, ‘An approximationoftherainfallfactorintheUniversalSoilLoss Equation’, John Wiley Sons,pp.127–132,1980.
[29] V.J.MarkoseandK.S.Jayappa,‘Soillossestimation and prioritization of sub-watersheds of Kali River basin, Karnataka, India, using RUSLE and GIS’, Environ. Monit. Assess., vol. 188, no. 4, p. 225, Apr. 2016, doi: 10.1007/s10661-016-5218-2.
[30] Baby A and Nair A G, ‘Soil Erosion Estimation of KuttiyadiRiverBasinUsingRUSLE’, Int. Adv. Res. J. Sci. Eng. Technol.,vol.3,no.3,2016.
[31] B. P. Ganasri and H. Ramesh, ‘Assessment of soil erosionbyRUSLEmodelusingremotesensingandGIS -A casestudyofNethravathiBasin’, Geosci. Front.,vol.7,no.6, pp.953–961,Nov.2016,doi:10.1016/j.gsf.2015.10.007.
[32] Agele D M, Lihan T K, and Rahim S A, ‘RISK ASSESSMENT OF SOIL EROSION DOWNSTREAM OF THE PAHANGRIVERBASINWITHRUSLEMODEL’,2013,vol.19, pp.571–580.
[33] R.Ranzi,T.H.Le,andM.C.Rulli,‘ARUSLEapproach tomodelsuspendedsedimentloadintheLoriver(Vietnam): Effects of reservoirs and land use changes’, J. Hydrol., vol.
422–423, pp. 17–29, Feb. 2012, doi: 10.1016/j.jhydrol.2011.12.009.
[34] N.deSantosLoureiroandM.deAzevedoCoutinho, ‘AnewproceduretoestimatetheRUSLEEI30index,based onmonthlyrainfalldataandappliedtotheAlgarveregion, Portugal’, J. Hydrol.,vol.250,no.1–4,pp.12–18,Sep.2001, doi:10.1016/S0022-1694(01)00387-0.
[35] HurniH, Soil conservation manual for Ethiopia. 1985.
[36] Singh G, Chandra S., and Babu R., ‘Soil Loss and Prediction Research in India’, entral Soil and Water Conservation Research Training Institute,Dehradun,1981.
[37] Bu.Z,‘Theprogressofquantitativeremotesensing methodforannualsoillossesanditsapplicationinTaihuLakeWatersheds’, Acta Pedol Sin,no.40,pp.1–9,2003.
[38] A. D. Simms, C. D. Woodroffe, and B. G. Jones, ‘ApplicationofRUSLEforerosionmanagementinacoastal catchment,southernNSW’,2003.
[39] SchwabG.O,FangmeierD.D,andElliotWJ, Soil and Water Conservation Engineering,4thed.JohnWiley&Sons, Inc.,1993.
[40] P.Mhangara,V.Kakembo,andK.J.Lim,‘Soilerosion riskassessmentoftheKeiskammacatchment,SouthAfrica usingGISandremotesensing’, Environ. Earth Sci.,vol.65,no. 7, pp. 2087–2102, Apr. 2012, doi: 10.1007/s12665-0111190-x.
[41] P.Parysow,G.Wang,G.Gertner,andA.B.Anderson, ‘Spatial uncertainty analysis for mapping soil erodibility basedonjointsequentialsimulation’, CATENA,vol.53,no.1, pp.65–78,Aug.2003,doi:10.1016/S0341-8162(02)001984.
[42] Z.H.Shi,C.F.Cai,S.W.Ding,T.W.Wang,andT.L. Chow, ‘Soil conservation planning at the small watershed levelusingRUSLEwithGIS:acasestudyintheThreeGorge AreaofChina’, CATENA,vol.55,no.1,pp.33–48,Jan.2004, doi:10.1016/S0341-8162(03)00088-2.
[43] T.Chen,R.Niu,P.Li,L.Zhang,andB.Du,‘Regional soil erosion risk mapping using RUSLE, GIS, and remote sensing: a case study in Miyun Watershed, North China’, Environ. Earth Sci.,vol.63,no.3,pp.533–541,Jun.2011,doi: 10.1007/s12665-010-0715-z.
[44] M. Lopez-Vicente, A. Navas, and J. Machín, ‘Identifying erosive periods by using RUSLE factors in mountainfieldsoftheCentralSpanishPyrenees’,preprint, Jul.2007.doi:10.5194/hessd-4-2111-2007.
[45] C.A.Bonilla,J.L.Reyes,andA.Magri,‘WaterErosion PredictionUsingtheRevisedUniversal Soil Loss Equation (RUSLE)inaGISFramework,CentralChile’, Chil. J. Agric. Res.,
Volume: 9 Issue: 12 | Dec 2022 www.irjet.net p-ISSN: 2395-0072 © 2022, IRJET | Impact Factor value: 7.529 | ISO 9001:2008 Certified Journal | Page1448
vol. 70, no. 1, Mar. 2010, doi: 10.4067/S071858392010000100017.
[46] NaqviHR,DeviL.M,andSiddiquiM.A,‘Soilloss predictionandprioritizationbasedonreviseduniversalsoil lossestimation(RUSLE)modelusinggeospatialtechnique’, Int. J. Environ. Prot.,vol.2,no.3,pp.39–43,2012.
[47] Kartic M, Annadurai R, and Ravichandran P T, ‘AssessmentofSoilErosionSusceptibilityinKothagiriTaluk Using Revised Universal Soil Loss Equation (RUSLE) and Geo-SpatialTechnology’,vol.4,no.10,2014.
[48] V.Joshi,N.Susware,andD.Sinha,‘Estimatingsoil loss from a watershed in Western Deccan, India, using RevisedUniversalSoilLossEquation’, Landsc. Environ.,vol. 10,no.1,pp.13–25,Apr.2016,doi:10.21120/LE/10/1/2.
[49] S.C.PalandM.Shit,‘ApplicationofRUSLEmodelfor soil loss estimation of Jaipanda watershed, West Bengal’, Spat. Inf. Res., vol. 25, no. 3, pp. 399–409, Jun. 2017, doi: 10.1007/s41324-017-0107-5.
[50] El-swaifySandDanglerE,‘Erodibilitiesofselected tropical soils in relation to structural and hydrologic parameters.InG.Foster(Ed.)’, Soil Eros. Predict. Control,pp. 105–114,1976.
[51] Foster G.R, McCool D.K, Renard K.G, and Moldenhauer W.C, ‘Conversion of the universal soil loss equationtoSImetricunits’, J. Soil Water Conserv.,vol.36,no. 6,pp.355–359,1981.
[52] S. Kumar and S. P. S. Kushwaha, ‘Modelling soil erosionriskbasedonRUSLE-3DusingGISinaShivaliksubwatershed’, J. Earth Syst. Sci., vol. 122, no. 2, pp. 389–398, Apr.2013,doi:10.1007/s12040-013-0276-0.
[53] S. Chatterjee, A. P. Krishna, and A. P. Sharma, ‘Geospatial assessment of soil erosion vulnerability at watershedlevelinsomesectionsoftheUpperSubarnarekha riverbasin,Jharkhand,India’, Environ. Earth Sci.,vol.71,no. 1,pp.357–374,Jan.2014,doi:10.1007/s12665-013-2439-3.
[54] Rosewell C, Soilloss A program to assist in the selection of the management practices to reduce erosion,2nd ed.1993.
[55] A.Shamshad,C.S.Leow,A.Ramlah,W.M.A.Wan Hussin,andS.A.Mohd.Sanusi,‘ApplicationsofAnnAGNPS model for soil loss estimation and nutrient loading for Malaysianconditions’, Int. J. Appl. Earth Obs. Geoinformation, vol. 10, no. 3, pp. 239–252, Sep. 2008, doi: 10.1016/j.jag.2007.10.006.
[56] K.J.Lim,M.Sagong,B.A.Engel,Z.Tang,J.Choi,and K.-S. Kim, ‘GIS-based sediment assessment tool’, CATENA, vol. 64, no. 1, pp. 61–80, Nov. 2005, doi: 10.1016/j.catena.2005.06.013.
[57] D.D.SmithandW.H.Wischmeier,‘Factorsaffecting sheetandrillerosion’, Trans. Am. Geophys. Union,vol.38,no. 6,p.889,1957,doi:10.1029/TR038i006p00889.
[58] D.Agarwal,K.Tongaria,S.Pathak,A.Ohri,andM. Jha, ‘SOIL EROSION MAPPING OF WATERSHED IN MIRZAPUR DISTRICT USING RUSLE MODEL IN GIS ENVIRONMENT’, Int. J. Stud. Res. Technol. Manag.,vol.4,no. 3,pp.56–63,Dec.2016,doi:10.18510/ijsrtm.2016.433.
[59] S.AbdulRahaman,S.Aruchamy,R.Jegankumar,and S. Abdul Ajeez, ‘ESTIMATION OF ANNUAL AVERAGE SOIL LOSS,BASEDONRUSLEMODELINKALLARWATERSHED, BHAVANI BASIN, TAMIL NADU, INDIA’, ISPRS Ann. Photogramm. Remote Sens. Spat. Inf. Sci., vol. II-2/W2, pp. 207–214,Oct.2015,doi:10.5194/isprsannals-II-2-W2-2072015.
[60] G. K. Gopal, M. Sutapa, and P. Swades, ‘Surface Runoff and Soil erosion Dynamics: A Case study on Bakreshwarriverbasin,easternIndia’,vol.3,2015.
[61] L.Benkobi,M.J.Trlica,andJ.L.Smith,‘Evaluationof aRefinedSurfaceCoverSubfactorforUseinRUSLE’, J. Range Manag., vol. 47, no. 1, p. 74, Jan. 1994, doi: 10.2307/4002845.
[62] USDA-SCS, ‘Hydrology’ in SCS national engineering handbook.WashingtonDC:USDepartmentofAgriculture., 1972.
[63] K. Ghosal and S. Das Bhattacharya, ‘A Review of RUSLEModel’, J. Indian Soc. Remote Sens.,vol.48,no.4,pp. 689–707,Apr.2020,doi:10.1007/s12524-019-01097-0.
[64] RenardK.G,FosterG.R,WeeisiesGA,andPorterJP, ‘RevisedUniversalSoillossequation’, J. Soil Water Conserv., vol.46,no.1,pp.30–33,1991.
[65] vanderKnijffJM,JonesRJA,andMontanarellaL, Soil Erosion Risk Assessment in Europe.Europeansoilbureau, 2000.
[66] MorganR, Soil Erosion and Conservation,2nded.U.K, 1995.
[67] McFarlane, D, Delroy, N., and Van, S. V, ‘Water erosion of potato land in Western Australia’, Aust. J. Soil Water Conserv.,vol.4,no.1,pp.33–40,1991.
[68] G. K. Das and R. Guchait, ‘Modeling of Risk of Soil ErosioninKharkaiWatershedusingRUSLEandTRMMData: AGeospatialApproach’,vol.5,no.10,2013.
[69] R. K. Samanta, G. S. Bhunia, and P. K. shit, ‘Spatial modelling of soil erosion susceptibility mapping in lower basin of Subarnarekha river (India) based on geospatial techniques’, Model. Earth Syst. Environ.,vol.2,no.2, p. 99, Jun.2016,doi:10.1007/s40808-016-0170-2.
International Research Journal of Engineering and Technology (IRJET) e-ISSN: 2395-0056 Volume: 9 Issue: 12 | Dec 2022 www.irjet.net p-ISSN: 2395-0072 © 2022, IRJET | Impact Factor value: 7.529 | ISO 9001:2008 Certified Journal | Page1449
International Research Journal of Engineering and Technology (IRJET) e-ISSN: 2395-0056
Volume: 9 Issue: 12 | Dec 2022 www.irjet.net p-ISSN: 2395-0072
[70] R.ParveenandU.Kumar,‘IntegratedApproachof Universal Soil Loss Equation (USLE) and Geographical InformationSystem(GIS)forSoilLossRiskAssessmentin UpperSouthKoelBasin,Jharkhand’, J. Geogr. Inf. Syst.,vol. 04,no.06,pp.588–596,2012,doi:10.4236/jgis.2012.46061.
[71] G. Fu, S. Chen, and D. K. McCool, ‘Modeling the impactsofno-tillpracticeonsoilerosionandsedimentyield withRUSLE,SEDD,andArcViewGIS’, Soil Tillage Res.,vol.85, no. 1–2, pp. 38–49, Jan. 2006, doi: 10.1016/j.still.2004.11.009.
[72] A. Lufafa, M. M. Tenywa, M. Isabirye, M. J. G. Majaliwa,andP.L.Woomer,‘Predictionofsoilerosionina LakeVictoriabasincatchmentusingaGIS-basedUniversal SoilLossmodel’, Agric. Syst.,vol.76,no.3,pp.883–894,Jun. 2003,doi:10.1016/S0308-521X(02)00012-4.
[73] I.Z.Gitas,K.Douros,C.Minakou,G.N.Silleos,andC. G. Karydas, ‘MULTI-TEMPORAL SOIL EROSION RISK ASSESSMENTINN.CHALKIDIKIUSINGAMODIFIEDUSLE RASTERMODEL’,2009.
[74] D. Lu, G. Li, G. S. Valladares, and M. Batistella, ‘MappingsoilerosionriskinRondônia,BrazilianAmazonia: usingRUSLE,remotesensingandGIS’, Land Degrad. Dev.,vol. 15,no.5,pp.499–512,Sep.2004,doi:10.1002/ldr.634.
[75] K.G.Renard,‘Usingmonthlyprecipitationdata to estimatethei*-factorin’.
[76] I. D. Moore and G. J. Burch, ‘Physical Basis of the Length-slopeFactorintheUniversalSoilLossEquation’, Soil Sci. Soc. Am. J.,vol.50,no.5,pp.1294–1298,Sep.1986,doi: 10.2136/sssaj1986.03615995005000050042x.
[77] †The International HapMap Consortium, ‘The InternationalHapMapProject’, Nature,vol.426,no.6968,pp. 789–796,Dec.2003,doi:10.1038/nature02168.
2022, IRJET | Impact Factor value: 7.529 | ISO 9001:2008 Certified Journal