International Research Journal of Engineering and Technology (IRJET) e-ISSN: 2395-0056

Volume: 09 Issue: 12 | Dec 2022 www.irjet.net p-ISSN: 2395-0072
International Research Journal of Engineering and Technology (IRJET) e-ISSN: 2395-0056
Volume: 09 Issue: 12 | Dec 2022 www.irjet.net p-ISSN: 2395-0072
1Assistant Professor, Department of Electrical Engineering, University College of Engineering, Osmania University, Telangana. India.
2Professor, Department of Electrical Engineering, University College of Engineering, Osmania University, Telangana. India ***
Abstract - The reliability of a radial feeder depends on its component’s average failure rate and restoration time. High current is one of the causes of the failure of line sections. This current consists of real and reactive components. The placement of shunt capacitors reduces the reactive current and results in a reduction of the average failure rate, hence increasing reliability. Further, the restoration time of the system is reduced by placing the fault passage indicator (FPI). In this work, first, the optimal location and rating of the shunt capacitors placement are determined based on the minimum total cost (which includes energy loss cost and capacitor costs) using the particle swarm optimization method (PSO). Second, the optimal placement of FPI on the radial feeder is considered based on the feeder reliability using the failure mode effects analysis (FMEA) method. Further, the feeder reliability is evaluated by placing both shunt capacitors and a single FPI
(iii) fault clearing time by repair or replacement, or switching action of that faulty component. The FPI is a device that enables a quick solution to reduce the fault locationidentificationtime[4,7].
In this paper, both component failure rates and power restorations are considered to improve the radial feeder reliabilitywiththeplacementoftheshuntcapacitorsanda singleFPI.
Thefollowingsectiondescribestheplacementoftheshunt capacitorandasingleFPIontheradialfeeder.
Words: Radial Feeder, Shunt Capacitor, PSO, FPI, ReliabilityandFMEA
The main function of the power system is to supply quality, quantity, and reliable power to the customers connected to the system. The reliability of the power system is affected by two factors, those are a). Components failure rate and b). Power restoration process. Reducing components failure rate and faster powerrestorationwillimprovethereliabilityoftheradial feeder.
The shunt capacitors are placed to improve the voltage profile, reduce power losses, and also to reduce the component failure rates by reducing the reactive current passing through them. During the peak load conditions operating temperature of the feeder sections increases due to high currents and causes high failure rates. The placement of shunt capacitors on the radial feeder supplies a part of the required reactive current. Hence, it reducestheoperatingtemperatureasaresultreducesthe failurerateoffeederequipmentandsections[5,8].
Theprocessofpowerrestorationtimeconsistsof(i)crew traveling time, (ii) fault location identification time, and
Theobjectiveoftheshuntcapacitorplacementintheradial feederforminimizingthetotalcost(whichincludesenergy loss cost, capacitor purchase and installation cost) and maximizing the savings is subjected to satisfy the constraints of bus voltage and the number of capacitors placed.Themathematicalexpressionoftheaboveobjective functionisdescribedinequation1. (1)
Where is the total costs in $/yr. is the annual cost perunitofpowerlossin$/kW-yr. isthetotalcapacitors purchase and installation cost in $/kVAR. & are the total active power losses and capacitors reactive power respectively[9].
Theannualtotalcostofcapacitorscanbecalculatedas: ⁄ (2)
The best location of capacitor placement on the radial feeder is identified using the loss sensitivity index (LSI). These indices predict the buses that will experience thegreatest reduction in losses with capacitor placement andwillreducethecapacitorsusageinnumber.Hence,the costofpurchase,installationandmaintenanceisless.The indicesaregivenbyequations3and4.
International Research Journal of Engineering and Technology (IRJET) e-ISSN: 2395-0056
(3) (4)
Where LSI1 and are the first and second loss sensitivity indices respectively. and are the active powerflowandresistanceinthekth linebetweeniandi+1 bus respectively, are the effective active and reactivepowersbeyondthereceivingnodei+1.[10]
ThePSOmethodisusedtooptimizetheobjectivefunction. Itbeginswithaninitialpopulationofrandomsolutionsor particles and searches for optima by updating various properties of the individuals in each generation. The particles change their positions by flying around a multidimensional search space until a relatively unchanged position has been encountered [11]. At each step time, changing the velocity of each particle flying towards its best position (pbest) and best position of the group (gbest)byupdatingthecurrentposition,anewvelocityof particle‘i’fork+1iterationisgivenby[12]
hr (7) hr (8)
(5)
Where is the velocity of particle ‘i’ at kth iteration, and are weight factors, ω is the inertia weight parameter, and are the random numbers between0and1.
Thechangeinthepositionfork+1iterationisgivenby (6)
Where indicatesthechangeinthecurrentposition.
AnFPIisaneconomical,smartdeviceandeasyto install in a radial feeder to determine the fault location time for quick power restoration from faulty conditions. After the occurrence of the sustained fault, the Power restoration may be due to the repair/replacement of components or switching of appropriate disconnecting switches. The fault location time is determined is as follows: The FPI placement on the radial feeder is shown in figure 1. Assume the average fault location time of the feeder without FPI is T0 hour. With the installation of an FPI,thefaultlocationtimeforpart1ofthefeederisT1and forpart2isT2 andaregivenby
Fig -1:RadialFeederwithasingle FPI
The following section describes the reliability evaluation withtheplacementofshuntcapacitorsandasingleFPIon theradialdistributionsystem.[4]
The load point indices such as average failure rate ( ), averagerepairtime( )andannualoutagetime( )are obtainedfromthefollowingequationsgivenby[2,3] ∑ failure/year (9) ∑ hours/year (10) hours (11)
Where and are respectively ith component average failurerateandaveragerepairtime.
System performance indices such as system average interruption frequency index (SAIFI), system average interruption duration index (SAIDI) and energy not supplied (ENS) are calculated by using equations 12, 13 and14respectively. ∑ ∑
Interruptions/customer-year (12) ∑ ∑

Hours/customer-year (13) ∑ kWh/year (14)
Where , , and respectively, average failurerate,annualoutagetime,averageloadandnumber ofcustomersconnectedtoith loadpoint(LPi).
The following section describes the failure rate modelling with the placement of a shunt capacitor and power restorationwithasinglefaultpassageindicator.
Volume: 09 Issue: 12 | Dec 2022 www.irjet.net p-ISSN: 2395-0072 © 2022, IRJET | Impact Factor value: 7.529 | ISO 9001:2008 Certified Journal | Page1353
International Research Journal of Engineering and Technology (IRJET) e-ISSN: 2395-0056
Volume: 09 Issue: 12 | Dec 2022 www.irjet.net p-ISSN: 2395-0072
Thefailureratemodelingofcapacitorplacementonfeeder sectionsisasfollows:Fortheith feedersection,beforethe placement of the shunt capacitor section failure rate is considered as an uncompensated failure rate and is indicated with After theshuntcapacitor placement, if the reactive current across the feeder section is fully compensatedthenthesectionfailurerateisconsideredas fullycompensated(85% of )andindicated with .In case of moderate levels of reactive current compensation, the resultant section failure rates ( ) are computed as givenby[5]
The followingsection describes the data andassumptions consideredforthereliabilityevaluationofaradialfeeder.
Feeder 1 of Roy Billiton Test System 2 (RBTS2) and corresponding data are considered for reliability evaluation [1]. The feeder is configured with fuses and disconnecting switches. The feeder with FPI placement is shown in figure 3 and the feeder section length data is showninTable1.
(18)
Where isthecompensationcoefficientandisgivenby (19)
Where are the reactive currents passing throughthefeedersectionsbeforeandafterthecapacitor placement.
Theoptimalplacementoftheshuntcapacitorontheradial feeder results in new reduced/moderated section failure rates, which are used to determine the feeder load point andperformancereliabilityindices.
The average restoration time with the FPI placement on theradialdistributionfeederisdeterminedas:[4]
i) If the fault clearance is associated with repair action, then the average restoration time is determinedasthesumoftheaveragerepairtime andfaultlocationtime.
ii) If the fault clearance is associated with switching action, then the average restoration time is determined as the sum of the switching time and faultlocationtime.
If the average repair time and average switching time of the feeder sections are rs and ss respectively. When a sustainedfaultinpartBoftheshowninfigure1.Thenthe restoration time of load points in part A due to switching action(sn)andinpartBduetorepairaction(rn)aregiven by hr (17) hr (18)

Fig -2:Feeder1ofRBTS2withFPIarrangement.
In the above figure, S indicates feeder sections, DS indicates disconnecting switch, TF indicates the distributiontransformerandLP indicatestheloadpoint.
Table -1: FeederSectionsLengthData
Length (km) Feeder Sections 0.60 S4,S5,S8 0.75 S1,S2,S3,S10 0.80 S6,S7,S9,S11
Loaddataofpeakload,typeandthenumberofcustomers connectedtoeachloadpointareshowninTable2.
Table -2: LoadData
Load Point Peak Load (MW) No. of Customers Type of Customers Power factor
Lp1,Lp2,Lp3 0.8668 210 residential 0.80 Lp4,Lp5 0.9167 1 institutional 0.75 Lp6,Lp7 0.7500 10 commercial 0.86
Componentreliabilitydataofaveragefailurerate,average repairtime,andswitchingtimesareshowninTable3.
Table -3: ComponentReliabilityData
Component λ r hr s hr
FeederSection 0.065f/km-yr. 4.75 0.25 DistributionTransformer 0.015f/yr. 199.25 -
International Research Journal of Engineering and Technology (IRJET) e-ISSN: 2395-0056
Volume: 09 Issue: 12 | Dec 2022 www.irjet.net p-ISSN: 2395-0072
The average fault location time is taken as 0.75 hr. [4]. Resistance and reactance data of feeder sections are showninTable4.[6]
Feeder Section R (Ω) X (Ω)
S1,S2,S3,S4 0.2712 0.2464 S5,S6,S7,S8,S9,S10,S11 0.2733 0.2506
The assumptions considered for reliability evaluation are (a).Supplyfromthemainsisassumedtobe100%reliable. (b). Fuses are 100% reliable and can successfully isolate load point failures from sections so there is no effect of oneloadpointfailureonothers.(c).FPIoperationis100% reliableandplacednexttothedisconnectingswitchonthe feeder.(d).Noalternativesupply.ThereliabilityofRBTS2 Feeder 1 is evaluated for four different case studies and thoseare
i. Case A: Feeder configuration without considering shunt capacitorandFPIplacement.
ii. Case B: Feeder configuration considering shunt capacitorplacement
iii. Case C: Feeder configuration considering a single FPI placement.
iv. Case D: Feeder configuration considering both Shunt CapacitorsandasingleFPIplacement.
The following section discusses the case studies and results.
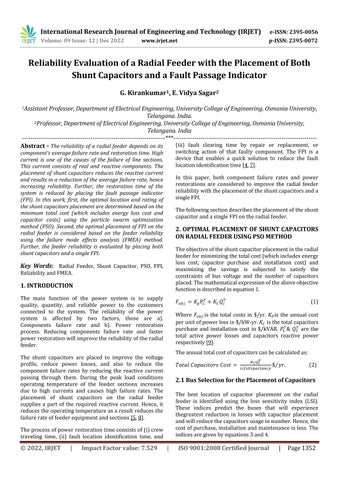
Case A is considered as the base case. The load point indices are calculated using equations 9 to 11 and the results are shown in Table 5. Feeder performance indices are calculated using equations 12 to 14 and results are showninTable6.
Table -5: LoadPointIndicesofFeeder
Load Point λ f/yr U hr/yr r hr
LP1 0.239 3.58 14.94
LP2 0.252 3.64 14.43
LP3 0.252 3.84 15.20
LP4 0.239 3.77 15.76
LP5 0.252 4.03 15.98
LP6 0.249 4.01 16.12
LP7 0.252 4.19 16.60
Table -6:
SAIFI SAIDI ENS
Feeder1 0.248 3.70 14054.7
IncaseB,theshuntcapacitorplacementlocationsforpeak load conditions are obtained by following the concept presented in section 2. The PSO simulation results with shuntcapacitorplacementsareshowninTable7
Table -7: PSOSimulationResultsonFeederParameters
Totalactivepowerlosses (kW) 195.88 160.38
%Powerlossreduction 18.12 Capacitorlocationand size(kvar)
B10 (498), B12 (468)
Costofpowerlosses ($/yr) 32908 26944
Costofcapacitors($/yr) 483.21
Minimumvoltage(pu) 0.957 0.963 Netsavings($/yr) 5481
The reactive currents in feeder sections before and after the shunt capacitor placement are shown in Table 8 New failure rates of feeder sections are calculated using equations 18 and 19 respectively and are shown in the sameTable8.
Table -8: ReactiveCurrents,CompensationCoefficientand NewFailureRatesofFeederSections
Reactive currents (A)
Section Without Capacitor With Capacitor f/yr
S1 264.11 209.61 0.80 0.0631
S2 194.34 139.80 0.73 0.0624
S3 114.98 60.38 0.54 0.0606
S4 35.38 13.32 0.28 0.0580
S5 34.87 34.87 1.00 0.0650
S6 34.89 34.89 1.00 0.0650
S7 35.39 35.39 1.00 0.0650
S8 43.96 43.96 1.00 0.0650
S9 44.29 11.70 0.39 0.0553
International Research Journal of Engineering and Technology (IRJET) e-ISSN: 2395-0056
Volume: 09 Issue: 12 | Dec 2022 www.irjet.net p-ISSN: 2395-0072
S10 35.30 35.30 1.00 0.0553
S11 35.38 13.32 0.28 0.0553
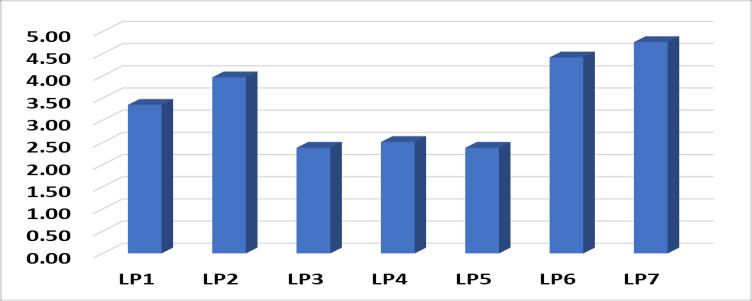
Using the new feeder section failure rates, the load point indices and performance indices are calculated and the resultsareshowninTable9andTable10respectively.
Table -9: LoadPointIndicesofFeederwithShunt CapacitorPlacement
Load Points f/yr hr/yr hr
LP1 0.226 3.55 15.74
LP2 0.237 3.61 15.23
LP3 0.240 3.80 15.82
LP4 0.227 3.73 16.44
LP5 0.240 3.99 16.63
LP6 0.230 3.94 17.17
LP7 0.232 4.09 17.59
Table -10: PerformanceIndicesofFeederwithShunt CapacitorPlacement
SAIFI SAIDI ENS
Feeder1 0.234 3.66 13878.7
ComparingcaseBwithcaseA,thepercentagereductionof loadpointsoutagetimeinthefeederisshowninfigure3.
point and performance indices are calculated and the resultsareshowninTable11toTable16.
Table -11: LoadPointIndicesofFeederwithFPI PlacementonLocationL1
Load Points f/yr hr/yr hr
LP1 0.239 3.48 14.54
LP2 0.252 3.54 14.02
LP3 0.252 3.75 14.85
LP4 0.239 3.69 15.40
LP5 0.252 3.94 15.63
LP6 0.249 3.93 15.77
LP7 0.252 4.10 16.24
Table -12: PerformanceIndicesofFeederwithFPI PlacementonLocationL1
SAIFI SAIDI ENS Feeder1 0.248 3.60 13726.2
Table -13: LoadPointIndicesofFeederwithFPI PlacementonLocationL2
Load Points f/yr hr/yr hr
LP1 0.239 3.50 14.63
LP2 0.252 3.56 14.12 LP3 0.252 3.76 14.90 LP4 0.239 3.70 15.45 LP5 0.252 3.94 15.62 LP6 0.249 3.92 15.76 LP7 0.252 4.10 16.24
Table -14: PerformanceIndicesofFeederwithFPI PlacementonLocationL2
Fig -3:Percentagereductionofthefailurerateinload pointswithshuntcapacitorsplacedonthefeeder
IncaseC,theplacementofasingleFPImeansonlyoneFPI at a time in different locations (L1, L2 and L3) on the feeder is considered. Using the concept discussed in section3,thefaultlocationtimesinpart1andpart2fora sustained fault on the feeder with FPI placement are determined using equations 7 and 8 respectively and the restoration time of load points in part 1 and part 2 are calculated from equations 17 and 18 respectively. Load
SAIFI SAIDI ENS Feeder1 0.248 3.62 13754
Table -15: LoadPointIndicesofFeederwithFPI PlacementonLocationL3
Load Points f/yr hrs/yr hr
LP1 0.239 3.56 14.87
LP2 0.252 3.62 14.36 LP3 0.252 3.82 15.13
2022, IRJET | Impact Factor value: 7.529 | ISO 9001:2008 Certified Journal | Page1356
International Research Journal of Engineering and Technology (IRJET) e-ISSN: 2395-0056
LP4 0.239 3.75 15.68
LP5 0.252 4.01 15.90
LP6 0.249 4.00 16.05
LP7 0.252 4.13 16.36
Table -16: PerformanceIndicesofFeederwithFPI PlacementonLocationL3
SAIFI SAIDI ENS
Feeder1 0.248 3.68 13968.2
Comparing with case A, the percentage reduction of annual outage time of load points with FPI placement on thefeederlocationsofL1,L2andL3incaseCareshownin figure4.
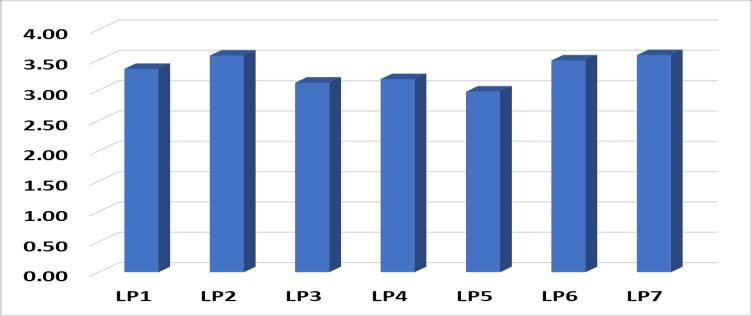
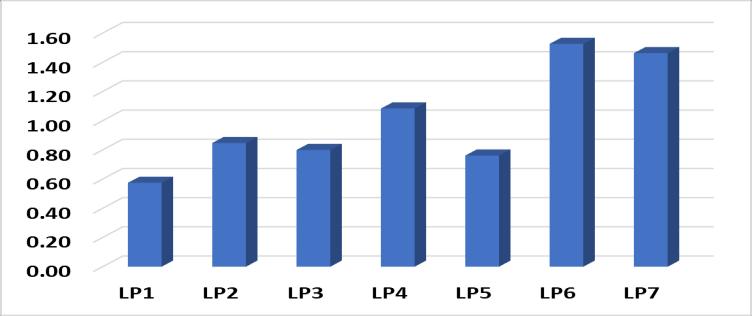
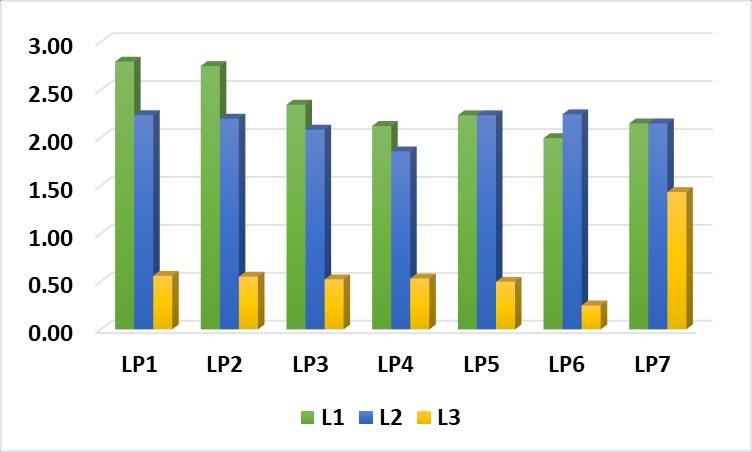
Table -18: PerformanceIndicesofFeederwiththe placementofbothshuntcapacitorsandasingleFPI
SAIFI SAIDI ENS
Feeder1 0.230 3.55 13511
The percentage reduction of load point annual outage timesincaseDcomparedwithcaseCandcaseAareshown infigure3andfigure5respectively.
Fig -4:Percentagereductionofannualoutagetimeofload points
The placement of both shunt capacitors and a single FPI are considered. Based on the feeder’s minimum values of SAIDI and ENS, the optimal location of FPI on feeder sections is considered as L1. The load point and performance indices are calculated and the results are showninTable17andTable18respectively
Table -17: LoadPointIndicesofFeederwiththe placementofbothshuntcapacitorsandasingleFPI
Load Points f/yr hr/yr hr
LP1 0.226 3.55 15.74
LP2 0.237 3.61 15.23
LP3 0.240 3.80 15.82
LP4 0.227 3.73 16.44
LP5 0.240 3.99 16.63
LP6 0.230 3.94 17.17
LP7 0.232 4.09 17.59
Fig -5:Percentagereductionofannualoutagetimeofload pointsincaseDwhencomparedwithcaseC
Fig -6:Percentagereductionofannualoutagetimeofload pointsincaseDwhencomparedwithcaseA
The reliability of feeder 1 of RBTS 2 is evaluated for four diffident case studies and presented in the above section. The numerical results clearly showing the impact of the individualandcombinedplacementoftheshuntcapacitor andFPIoperationson feederreliability. Theplacement of both the shunt capacitor and a single FPI are reducing both component failure rates from the peak load conditionsandpowerrestorationtimefromthesustained fault conditions which results in the system having better reliability operations. The percentage reduction of SAIFI, SAIDI and ENS in case D over case A are 7.26, 4.05 and 3.87respectively.
[1] R.N.Allan,R.Billinton,I.Sjarief,L.GoelandK.S.So,"A reliability test system for educational purposes-basic
Volume: 09 Issue: 12 | Dec 2022 www.irjet.net p-ISSN: 2395-0072 © 2022, IRJET | Impact Factor value: 7.529 | ISO 9001:2008 Certified Journal | Page1357
International Research Journal of Engineering and Technology (IRJET) e-ISSN: 2395-0056
Volume: 09 Issue: 12 | Dec 2022 www.irjet.net p-ISSN: 2395-0072
distribution system data and results",IEEE Trans. Power Syst., vol. 6, no. 2, pp. 813-820, May 1991., DOI:10.1109/59.76730
[2] Roy Billinton, Ronald N Allan, “Reliability Evaluation of Power Systems”, Second Edition, Plenium Press, 1996.
[3] Brown R.E, “Electric Power Distribution Reliability”, MarcelDekkerInc.,NewYork,Basel,2002.
[4] H. Falaghi,M.R. Haghifam, M. R. Osouli Tabrizi, “Fault Indicators Effects on Distribution Reliability Indices”, International Conference on Electricity Distribution, CIRED, June 6-9, 2005, pp. 1-4. DOI: 10.1049/cp:20050894.
[5] A.H.Etemadi, M.Fotuhi Firuzabad, “Distribution System Reliability Enhancement Using Optimal CapacitorPlacement”,IETGeneration,Transmission& Distribution, Vol.2, No.5, pp. 621-631, 2008. DOI: 10.1049/iet-gtd:20070515.
[6] Marvasti Vahid, Askarian Abyaneh Hossein and Mazlumi Kazem, "Maximum Loss Reduction Applying Combination of Optimal Conductor Selection and Capacitor Placement in Distribution Systems with Nonlinear Loads",IEEE 43rd International Universities Power Electronics Conference - 2008. DOI:10.1109/UPEC.2008.4651518
[7] Sandeep Pathak, “Decentralized self-healing solution for distribution grid automation: A must need of Indian distribution utilities”, IEEE Innovative Smart Grid Technologies-Asia, 10-13 November 2013, DOI:10.1109/ISGT-Asia.2013.6698710
[8] Turan Gonen, “Electric Power Distribution Engineering 3rd edition”, CRC Pres., Taylor& Francis Group,LLC,NewYork,2014.
[9] Chu-Sheng Lee a, Helon Vicente Hultmann Ayala b, Leandro dos Santos Coelho, “Capacitor placement of distribution systems using particle swarm optimization approaches”, Electrical Power and Energy Systems, Vol.64, pp. 839–851,2015. DOI: 10.1016/j.ijepes.2014.07.069.
[10] El-Ela AA, El-Sehiemy RA, Kinawy AM et al. Optimal capacitorplacementindistributionsystemsforpower loss reduction and voltage profile improvement. IET Gener Trans Distrib, Vol. 10, Iss. 5, pp. 1209-1221, 2016. DOI:10.1049/iet-gtd.2015.0799.
[11] Amara,S.Asefi,O.B.Adewuyi,M.Ahmadi,A.Yonaand T. Senjyu, "Technical and economic performance evaluation for efficient capacitors sizing and
placement in a real distribution network",IEEE StudentConf.Res.Dev.SCOReD,pp.100-105,2019.
[12] Mahmoud Ali Farrag, Ahmed Hamdy Khalil, Shaimaa Omran, “Optimal conductor selection and capacitor placement in radial distribution system using nonlinear AC load flow equations and dynamic load model”, International Transactions on Electrical Energy Systems, Vol.30,Issue5, May 2020. DOI: 10.1002/2050-7038.12316
© 2022, IRJET | Impact Factor value: 7.529 | ISO 9001:2008 Certified Journal | Page1358