Reconfiguration and Capacitor Placement in Najaf Distribution Networks Sector (design study)
DR. İSMAİL TOPALOĞLU MAHER HUSSEIN MOSSA /M.Sc.studentDepartment of Electrical Engineering Department of Electrical Engineering University of Çankırı- Çankırı-Turkey University of Çankırı
ABSTRACT
Asaresultoftheurbanexpansionincitiesandtheincreaseindemandforelectricpower,aswellasthesignificantexpansion that occurred in the power distribution systems, therefore, the redesign of power distribution systems and networks is consideredoneoftheimportantmatterstokeeppacewithdevelopments.
Designingfordistributionsystemssimulatesandanalyzeshowelectricaldistributionsystemsbehaveundervariousoperation scenarios. The analysis offers insight into the current system and helps to create a short-term or long-term growth strategy thatwilldirectsystemexpansion&futureinvestmentsrequiredforgreaternetworkperformance.
This study's target is to design the Al Jamieadistribution system (11 kV) in Najafin Iraq using the effective and powerful CYM_Dist.softwareasasimulationandanalysistool.

By sequentially reconfiguring the network and inserting capacitors in the right places and at the right sizes, the planning strategyputforthinthisthesisaimstoachievethenetwork'sidealworkingconditions.Decreasinglosses,enhancingvoltage profile,andreducingoverloadforequipmentofthenetworksliketransformersandcablesallcontributetothenetwork'speak performance. Designing a distribution system, using CYM Dist program, reconfiguring a network, placing capacitors, and minimizinglossesaresomeoftherelatedterms.
1. PREFACE
The target of distribution system designingis to optimize voltage profile, decrease line losses, account for yearly load increases throughout the designing period, and promote network dependability. Due to larger currents and lower voltage levels,distributionsystemsexperienceasubstantialamountofpowerloss;nevertheless,thislosscanbemitigateratherthan abolished,accordingtoSatish(2021).Themethodofreconfiguringthenetworkandthemethodofaddingshuntcapacitorsare the two main ways to reduce losses in the network. Network reconfiguration is the process of changing the open/closed condition of switches that are typically close (for sectionalizing) and ordinarily open (for tying) in distribution systems. Distributionnetworkperformancemaybeconsiderablyenhancebyinstallingshuntcapacitorsintheproperlocationandsize.
Literature Review:
Pradeep Kumar et al. (2011) [Pradeep Kumar, Asheesh K. Singh and Nitin Singh 2011], provided a comparison of the loss sensitivity technique (method-1) and the bus sensitivity method as two sensitivity-based solutions to the optimal capacitorpositioningsnag(method-2).Utilizingparticleswarmoptimization,capacitorsizing(PSO).Theefficacyofthesetwo approachevaluatedbasedonthevalueofactivelosses&voltageprofileofabusnetworkfollowingpropercapacitorposition.
Cristinel and Rajesh (2017) [Cristinel Ababei and Rajesh Kavasseri 2017], designed an effective heuristic technique to addressthelossreductionissuewithdistributionsystemreconfiguration.MinimumCostMaximumFlow(MCMF)problemis usetoformulatetheissueoflocatingadditionalbranchexchanges.
Pradeep Kumar (2011) [Pradeep Kumar, Asheesh K. Singh and Nitin Singh 2011], provided a comparison of the loss sensitivity technique (method-1) and the bus sensitivity method as two sensitivity-based solutions to the optimal capacitor position snag (method-2). Utilizing particle swarm optimization, capacitor sizing (PSO). On the basic of the active losses and voltage profile of the bus systems following appropriate capacitor positioning, the effectiveness of these two strategies compared
International Research Journal of Engineering and Technology (IRJET) e-ISSN:2395-0056
Volume: 09 Issue: 12 | Dec 2022 www.irjet.net p-ISSN:2395-0072
Zidan and El-Saadany (2018) [E. F. El-Saadany and Aboelsood Zidan], There is a useful method for reconfiguring the balanced and unbalanced radial distribution networks connected to the DG units. Al-Saadany and Zidan published it.The suggestedmethodbeginswithmeshnetworksbyturningoffalltieswitches.Byopeningonekeyperloopwithintheoperating limitsofthesystem,afterwhichtheradialsystemofthesystemrestored.
Khodr et al. (2016) [H.M.Khodr,ZitaA.ValeandCarlosRamos2016],developedamethodforfiguringoutwhereandhow bigswitchingandfixedshuntcapacitorsshouldbeinradialdistributionsystems.
Neelima and Subramanyam (2015) [Neelima, P. S. Subramanyam 2015], provided a comparison of the loss sensitivity technique (method-1) and the bus sensitivity method as two sensitivity-based solutions to the optimal capacitor placement problem(method-2).Capacitorsizingusingparticleswarmoptimization(PSO).
2. The Suggestion techniques
Thesuggesteddesigningapproachconsistsofthreemainpartsincludeddemandgrowthandinstallationofnewconsumersas follow:
Loadallocation,optimalnetworkreconfigurationandReactivepoweradjustmentforpotentialbuscandidatestostopviolating operationalconstraintsandwecanexplaintheabove:
This work makes use of the linked kVA load allocation approach offered by the CYM-Dist. software, that divides the substation load requirements (supplied in amps every phase by users) for the feeder in accordance with the transformers connectionofthedistribution(thevalueofKVA).
Networks reconfiguration: Switched statuses serve as the control variables in the systems reconfiguration problems. Thestatusesofswitchesarechangebetweentwomagnitude,suchas1and0forclose,openrepresently,toachieveavariety of topologies. The network reconfiguration issue's objective is to reduce energy losses thathas the following mathematical expression:2012,Manjuetal.
The above topic is subject to several important criteria or restrictions, which are as follows:
Radial network (restriction): According to this, distribution systems cannot include loops but every load bus must be servedbyaseparatesubstation.
Power source capacity (restriction): The maximum capacity of the related power source cannot be exceeds by the combinedloadsofa particularpartial network wherethevalueofPandQtotheload shouldbelessthan the maximumand minimumvalueofpowersource.
Voltage restriction:thevalueofthevoltageforeachbusinthesystemisaboutintherangenotlesstheminimumvalueor greaterthanthemaximumvalueofthevoltagetoensuresustainingthepowerqualitylevelofthesystem.
2.1 The reconfiguration technique:
The switches are then open one at a time to close the loops. The power-flow software in CYM Dist used to calculate the opening condition, which predicated on the smallest overall power loss rise. In Flavio et al., 2005, the two steps of this approachshown.
2.2 The ideal spot for a capacitor and its size
In order to find the ideal shunt capacitor valueand position in a radial distribution system, the issue is set up to minimize ohmic losses while accounting for the capacitor's costs. Simultaneously time, limitations on the electricity system limit the options. According to Hector (2013), the valuesof capacitor banks determined by standard value that causes the set of solutions to be separate. For the sake of simplification, the capacitor installed in the distributed system's operating & repair costsnottakenintoaccount.
International Research Journal of Engineering and Technology (IRJET) e-ISSN:2395-0056
Volume: 09 Issue: 12 | Dec 2022 www.irjet.net p-ISSN:2395-0072
TheCYM_Distprogramcontainsatechniqueforplacingcapacitorsthatconductssingle-topicoptimization(eitherPloss orV).
TheLimitationsaretheadditionalaspectoftheoptimizationissuethatneeddefinitionalongwiththeobjectivefunction.The dedicate distribution load flow software that estimates losses is responsible for maintaining the line flow restrictions. These limitationsaretakeintoaccountinthisresearch:
1. Bus Voltage Limitation: During the optimization phase, the value of the bus voltage must be keep within allowable operatingboundaries,wherethermsmagnitudeofbusvoltage(ith )loadshouldbelessthanfrommaximumvalueandgreater thanfromminimummagnitudeofbusvoltage.
2. Power-ConservationLimits:Overtheentiredistributionnetwork,thealgebraictotalof(incoming&exiting)power,within itlinelosses,shouldequalzero. ∑
3. The magnitude of line current where the magnitude of the current should be less than the magnitude of the line current (rated).
4. The restriction on the No. & size of acceptable shunt capacitors : The number of added capacitors expressing the formula mustbespecified,wherethevalueofkvarisgetting by thecapacitor bank inthe network shouldlessthanthe magnitudeof totalreactivepowerareneededfromtheselectednetworkasshownfollow: ∑ ........2
The best capacitor sizes and locations for this method are those that min. the target function, satisfies limitations, & satisfy equationforasinglecapacitorpositionedatthecorrectbus.
3. Sweep load flow (Forward/Backward)
LoadflowinadistributionsystemissubjecttophysicalrulesincludingKirchhofflawsandOhmslaws,whichwereincorporate intothedesignprocess'restrictions.Thebackward-forwardsweeptechnique,whichconsistsoftwostages,itisusedinradial distribution systems where it operates in a repetitive system to solve load flow equations. The forward sweep, that updates thevalueofvoltageusingcalculationsofvoltagedrop&thereverseswept,thatupdatesthevalueofcurrentsusingKirchhoff’s CurrentLaw(KCL).Thecurrentinjectedintoeachbranchiscalculateusingthebackwardsweepasafunctionoftheendbus voltages. The voltages are update while a current summation is carrying out in the network. [Milad Askari Hashemabadi , , MarjanTavakoli,FarzanehOstovarandMahdiMozaffariLegha,journal].
4. Energy losses cost
UsingCYM-Dist.built-inlossfactoralgorithm,theannualcostofsystemlossesisdetermined(equation2.23).Thelossfactor expresses the actual power loss over a certain time and under a specified loading situation. The load factor affects the loss factor(LDF) ...........................................................3
Where:Intheeq.(2.23)aconstantA=0.15isgivenoccasionally&useforthedistributionsystem[MeghanaMukerji2016].
After a load flow simulation, the yearly cost of active power losses is calculate using the empirical formula shown below [ZainulA.Jaffery,AnwarShahzadSiddiqui,MdSarwarandImranAhmadQuadri2018]. .............................................4
Where:
International Research Journal of Engineering and Technology (IRJET) e-ISSN:2395-0056
Volume: 09 Issue: 12 | Dec 2022 www.irjet.net p-ISSN:2395-0072
Plossmax Lossofpoweratmax.demandpower(kW) Lfls Factoroflosspower -TimeSeparator(h) T Timelapse(h) CF Tariffcost($)
Theyearlycostformulawillbe[G.V.SivaKrishnaRaoandP.Divya2018]: ∑ ...........................5
Where:
Qc sizeofcapacitor(kvar) k Capacitorcostaccording($/kvar) c 1,2…jistheselectedbuses.
5. CYM _ DIS PROGRAM
5.1Loads in CYM_Dist program
1-Distributed loads, which are frequently represented by the size of the distribution transformers, are the normal demand loadsinthesystem.Inmostcases,distributedloadinamodeldescribesanaccurateaverageofsystemloads.
2-Spotloadsfrequentlyreflectbig,predictableloads,suchasthosefromindustrialclients,whohavecorrectinformationand wouldnotberepresentingbyscatteredloads.SpotloadtypesaretypicallyusedinIraqtodescribeloads.
5.2 CYM_DIST database
Theprimarypartinthemodelingprocessistogatherinterdatarequired.Oncethedatahavebeenaggregateandprocess,they are then loaded into or imported from program package into CYM_Dist to produce the distribution network model, with an singlelinediagramcreatedbyautomatedmothed.
Thedistributionnetworkdesignprocessingrequiresseveraldifferenttypesofsimulationstudy,butonlyonemodelhastobe create[OwenSchelenzandKathleenO’Brien2019].
5.3Analysis feature types in CYM_Dist
The iterative software employs the backward-forward sweep technique, sometimes referred to as the ladders approach. Insteadofcalculatingtheloadflow,CYM_Dist,whichcalculatesthebranchcurrents.Numerousloadflowtechniquesbasedon the backward/forward sweep method exist. Power flow ladder associative approach is use by the program to analysis the system[ShahM.Mehryoon2009].
5.3.1Allocation
techniques of loads
ThefourloadallocationtechniquesinCYM_Distinthisthesis.
5.3.2
Power flow and CYM_Dist
The user can find both unbalanced &balanced circuit solution methods in the CYME Load Flow module. The user can select fromthefollowingthecalculationtechniquesforbalancedsystems:
I.VoltageDropthatRequireapplyapplicationCYM_Dist.
Ii.FastDecoupledthatRequireapplyapplicationCYMFLOW.
International Research Journal of Engineering and Technology (IRJET) e-ISSN:2395-0056
Iii.FullNewton-RaphsonthatRequireapplyapplicationCYMFLOW. Iv.Gauss-SeidelthatRequireapplyapplicationCYMFLOW.
5.3.3 Feature switching optimization in CYM_Dist_SOM
TheCYMEPowerEngineeringAnalysisSoftwarenowincludesaSwitchingOptimizationmoduletohelpdistributionengineers tofindthebestnetworkstructures.Byrecommendingnewplacesornewswitchingplansforexistingdevices,themodulescan decidewherethetiepointsshouldbeplaceinordertoaccomplishoneofthefollowingaims, [http://www.cyme.com/software/cymdistsom/B1170-13013-SwitchingOptimization.pdf].
6. The SUGGESTED DESIGNING METHODOLOGY
Theflowchartinfig.(6.1)Servesasanillustrationofthesuggestedplanningprocessinthisthesis.
Sellect system database


Buılt the system model
Run load allocation
By load flow, analysıs the system selected Run load growth
By load flow, Re-analysıs the system selected
Reconfiguration of the system
By load flow, Re-analysıs the system selected
Yes
Reconfiguration the system satisfied operational constraints Optimum location for a capacitor
No
By load flow, Re-analysıs the system selected
Print results
Fig. 6.1 FlowchartrepresentingthesuggestingdesigningnetworkbyCYM_Distprogram
Volume: 09 Issue: 12 | Dec 2022 www.irjet.net p-ISSN:2395-0072 © 2021, IRJET | Impact Factor value: 7.529 | ISO 9001:2008 Certified Journal | Page860
International Research Journal of Engineering and Technology (IRJET) e-ISSN:2395-0056
Volume: 09 Issue: 12 | Dec 2022 www.irjet.net p-ISSN:2395-0072
7. STADY AND DISSCUSION OF THE CASSES
Al Jamiea distribution system was select as the distribution system to use to implement the suggested strategy in Najaf city, where feed from two 33kV feeders that are the Al-North-Najaf and Al-kufa power stations (132/33 kV), which have a combinedcapacityof (2*31.5MVA), supplythe Al- Jamiea (33/11kV) substation.A broadarea witha mixtureof residential, commercial,industrial,andtradingloadsisservedbyfourteen(11kV)feedersthatleavetheAl-Jamieasubstation.Duetothe impossibilitytoacquirefurtherinformation,onlyfourfeedersaretakeintoconsiderationinthiswork.
7.1 Third case: Al_ Jamiea station feed Al_Jamiea distribution network
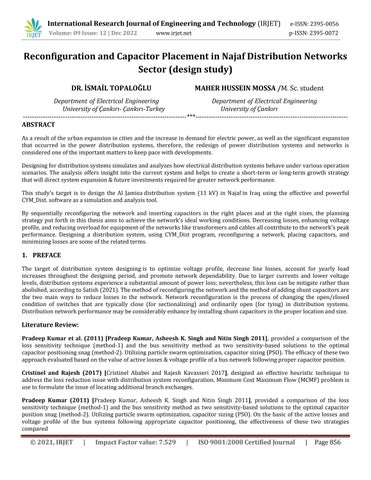
Al_JamieadistributionnetworkisapartofthepowersystemsinNajaf network,thatistheratedvoltageis11kV,baseMVA= 100, & frequency of 50 Hz including (150) line sections, (146) buses, & six tie switches. Figure (7.1) depicts the Al Jamiea system'sschematicdiagramcreatedbyCYM_Dist (Initial configuration) Approximately94%of thedemandfortheAl Jamiea feedersisresidential,while6%iscommercial.
Accordingtothetable7.1,theloaddurationcurveisseparateintothreeloadingrates(high,medium,&low)duringtheyears oftheplannedperiod
Table 7.1 Loaddurationcurve(Al_Jamieasubstation)
Percentage load (%) Yearly time load (%) Annual period (h) 100 33 2886 70 52 4549 40 15 1315
Al_Jamieasystemmodelingbasedonthepreciselocationsofeachbus.InaccordancewiththeWorldwidePositioningSystem, thesedimensionsobtainedfromtheIraqiMinistryofElectricity(GPS). Theprocessofbuildingthemodelintheprogramand givinganaccuratedescriptionofthelengthsusedisdonebyenteringthedimensionsxandyintheprogram
A useful system from Najaf's distribution network was using to put the suggested strategy into practice. Four 11kV distributionfeedersmakeupthesystem,whichoriginatesatAl-Jamieastation.ThedataofthesystemsisobtainfromtheIraqi MinistryofElectricity(MOE).
Inthisstudy,variouspresumptionsaretakingbeforebeginning:
1. Whenusingthebalancevoltageiterativedroptechnique,theloadflowiterationsarelimitedtoamaximumof40,Asforthe amountofconvergenceerrorinthevoltagevalue,itisadjustedbyspecifyingit0.01%asamaximum.
2. CostofelectricalenergyaccordingtotheIraqiMinistryofElectricitywhichis0.1USD/kWh(tariffcost).
3. The busvoltages (rms value) will be adjust beyond suitable tolerance border (5%) after employing both optimal system reconfiguration&capacitorlocation.
4. Decreasing losses (KW) for the peak demand load (average) and for the last year of designing horizon are the aim functionsoftheoptimumsystemreconfiguration&capacitorlocation
5.Harmonics'impactisdisregardsandthestabilityignoredinthisthesis.
6.Thepowerfactorofeachloadisthesame.
The load factor for the Al Najafdistribution network is 100%, while it is 65% used of the selected feeders in this work.the distributionofloadsateachphaseforallsectorsisbasedonthevalueofthecurrentaswellasthepowerfactorattheendof thefeeder.Inadditiontothesizesofthetransformersinthefeeder(downdistributiontransformerswithaconversionratioof 11/0.4andthetypeofdelta-star).
International Research Journal of Engineering and Technology (IRJET) e-ISSN:2395-0056
Volume: 09 Issue: 12 | Dec 2022 www.irjet.net p-ISSN:2395-0072
Table 7.2a TheFeederscurrentofAl_Jamieanetwork
Feeder Current at every phase(A) Power factor per. (%)
Al Jamiea_1 245 80
Al Jamiea_2 205 80
Al Jamiea_3 225 80 Al Jamiea_4 175 80
Table 7.2b Al_Jamieanetwork(Secondarytransformersizes)
Number of Spot load Transformers sizes 2,3,6,11,26,27,30,31,32,34,36,37,40,41,43,46,48,49,50,56,59,63,64,68,69,71,78,82,85,88, 89,91,94,95,96,97,107,111,112,113,115,117,118,120,121,125,128,130,132,134,149.
250KVA 4,7,8,9,12,13,14,18,19,20,21,22,23,25,29,35,38,54,58,60,67,73,84,87,90,92,98,101,102,105, 109,110,123,126,138,142,144,150. 400KVA
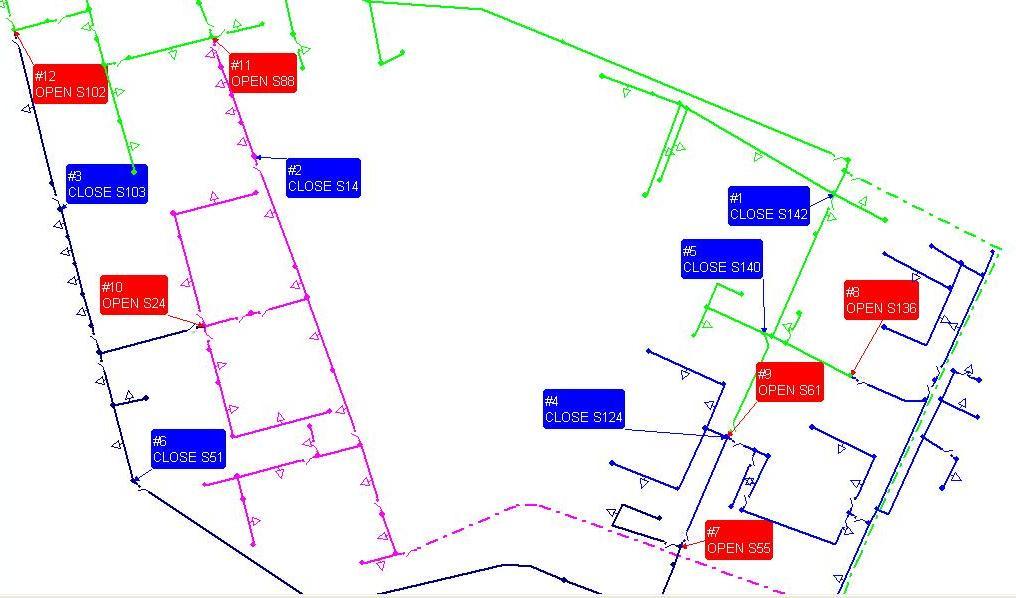
Fromwhatmentionaboveregardingtheselectedelectricalnetwork(Al_Jamiea)inthecityofNajaf,initiallywewoulddescribe theinitialconfigurationofthenetworkintheCYM_Dist.program,asshowninFigure(7.1)
Fig. 7.1 Al Jamieanetworkindicateno.oftransformers(Initialconfiguration)
International Research Journal of Engineering and Technology (IRJET) e-ISSN:2395-0056
Volume: 09 Issue: 12 | Dec 2022 www.irjet.net p-ISSN:2395-0072
Itisnecessary toexaminetheloadflowofthecurrentnetworkbeforeimplementingtheshort-termdesigningtoit.Applying load growth study to the network allows for the examination of its resilience and effectiveness in the face of yearly load growth.Figure 7.2 illustrateshowthe network is evaluatedusing the percentageyearlyloadincrease rate solely(household andcommercialloads)overtheupcoming5years(2021-2025).
Fig. 7.2 Al_Jamieanetwork(Loadgrowthingfeeders)
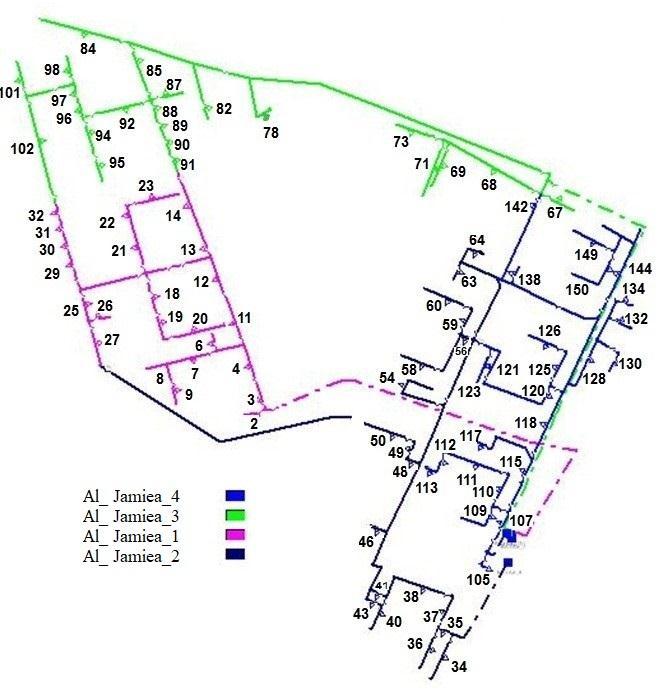
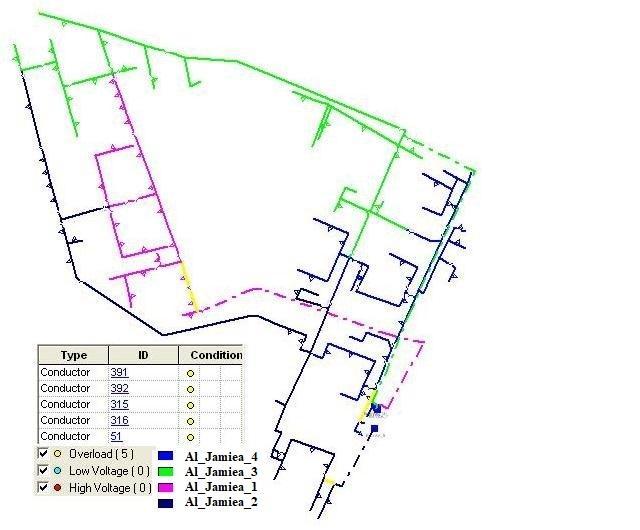
As seen in fig. (7.3), there are five portions that are operating under overload conditions (All estimates are for peak demand onlyanddoneforthelastyearoftheplannedperiod.)
Energylossesafterloadgrowthinthespecifiednetworkandforallsources in2021were271.04kW,asdemonstratedbythe modeling results in table (7.4). The final power loss after reconfiguring the network to reduce losses and evenly distribute loadsbetweenfeederswas228.26kW,andtheoveralldecreaseinpowerlossesafterreconfiguringthenetworkwas42.78kW (15.78%ofitsinitialvalue).Infig.(7.3),theidealsetupdisplayed.Asexampleforchangingprogressofswitchesinthefeeder isthattheactionoftheIDswitch(S55)isopenandforswitchS142isclose.
Table 7.4 Al_Jamieanetworkmaximumdemandloadoverviewbeforeandafterloadincrease,afternetworkreconfiguration, andafterkvaradjustment
International Research Journal of Engineering and Technology (IRJET) e-ISSN:2395-0056
Volume: 09 Issue: 12 | Dec 2022 www.irjet.net p-ISSN:2395-0072
2021
Afterloadinggrowth 2025
Afterreconfiguration ofNetwork
kVA 4499.28 69.54 4568.82
PowerFactor 0.801 0.702 0.801
k.W. 4745.11 91.01 4836.22 kvar 3554.48 0+5.66 80.97 3635.45 kVA 5927.55 121.55 6049.1 PowerFactor 0.801 0.74 0.8
k.W. 4290.98 69.48 4360.46 kvar 3216.07 0+5.48 62.01 3272.6 kVA 5361.98 94.01 5455.99 PowerFactor 0.801 0.74 0.8
Aftercompensation kvar
Jamiea _2
Beforeloadinggrowth 2021
k.W. 4290.98 44.8 4335.78 kvar 3215.07 3086.01+5.49 39.9 163.47 kVA 5361.97 60.87 4339.53
PowerFactor 0.801 0.74 0.99
loading System Total (adjusted value capacitor + capacitances of conductor Network loosing Power supply
k.W. 3024.88 23.58 3048.46 kvar 2264.79 0+2.69 22.96 2287.75 kVA 3778.80 33.23 3812.03
PowerFactor 0.8 0.68 0.8
Afterloadinggrowth 2025
Afterreconfiguration ofNetwork
kW 4036.02 41.91 4077.93 kvar 3019.98 0+2.68 42.93 3062.91 kVA 5042.02 61.02 5103.04
PowerFactor 0.8 0.69 0.8
kW 4118.01 51.91 4169.92 kvar 3082.85 0+2.64 55.01 3137.86 kVA 5142.97 76.01 5218.98
PowerFactor 0.8 0.69 0.8
Aftercompensation kvar
kW 4118.01 33.94 4152.97 kvar 3083.56 2204.31+2.65 35.54 911.84 kVA 5144.10 44.99 4249.87
PowerFactor 0.8 0.691 0.96
International Research Journal of Engineering and Technology (IRJET) e-ISSN:2395-0056
Volume: 09 Issue: 12 | Dec 2022 www.irjet.net p-ISSN:2395-0072
Jamiea _3
Loading System
Beforeloadinggrowth 2021
Afterloadinggrowth 2025
Afterreconfigurationof Network
Total (adjusted value capacitor + capacitances of conductor
Network loosing Power supply
k.W. 3286.64 65.93 3352.57 kvar 2457.61 0±6.45 63.81 2514.96 kVA 4105.02 93.01 4198.03
PowerFactor 0.801 0.722 0.802
kW 4338.9 118.01 4456.91 kvar 3245.02 0±6.43 112.55 3350.9 kVA 5418.91 163.1 5582.01
PowerFactor 0.801 0.721 0.802
kW 4123.01 75.82 4198.83 kvar 3084.02 0±6.62 69.30 3145.89 kVA 5148.95 103.01 5251.96
PowerFactor 0.801 - 0.731 0.802
Aftercompensationkvar kW 4124.94 49.91 4174.85 kvar 3086.01 2635.49+6.66 45.76 489.38 kVA 5151.79 67.801 4204.02 PowerFactor 0.801 0.73 0.989
Beforeloadinggrowth 2021
k.W. 2581.01 10.8 2591.81 kvar 1934.28 0+2.33 11.43 1944.02 kVA 3225.11 15.721 3240.82 PowerFactor 0.801 0.68 0.802
Afterloadinggrowth 2025
Afterreconfigurationof Network
k.W. 3446.97 20.01 3466.98 kvar 2584.43 0+2.32 20.5 2602.61 kVA 4309.03 29.02 4338.05
PowerFactor 0.801 0.68 0.802
k.W. 4039.01 31.05 4070.06 kvar 3026.58 0+2.4 32.7 3056.87 kVA 5047.03 45.04 5092.07
PowerFactor 0.801 0.68 0.802
International Research Journal of Engineering and Technology (IRJET) e-ISSN:2395-0056
Volume: 09 Issue: 12 | Dec 2022 www.irjet.net p-ISSN:2395-0072
Aftercompensationkvar
k.W. 4044.06 21.06 4065.12 kvar 3030.32 2224.38+2.41 22.12 825.64 kVA 5053.10 30.40 4147.39
PowerFactor 0.8 0.68 0.981
Fig. (7.3) Al_Jamieanetwork(Optimalconfiguration)
Clearlythatthesystemisstillworkinginabnormalconditionsafterimplementingtheloadflow(fivepartsareworkingunder overloadedconditions,asillustratedinfigure(7.4).Reactivepowercompensationmaythereforebeusetoaddressthisissue byboostingthesizesofthesefeeders.Figure(7.5)depictstheidealcapacitorinstallationsites,whiletable(7.6)liststheideal capacitor placement and dimensions. The loading summary of load growth (before and after), network reconfiguration, and the value of kvar correction is shown in Table (7.4). The overall summary of data is show in Table (7.7) for feeders in the network.Figure(7.6)displaystheoverallnetworklossesforfeeders(KW).
International Research Journal of Engineering and Technology (IRJET) e-ISSN:2395-0056
Volume: 09 Issue: 12 | Dec 2022 www.irjet.net p-ISSN:2395-0072
Table (7.6) Al_JamieaNetwork'sidealcapacitorplacementandsizingforcasesofmaximum load(100percentloading)
Al_Jamiea_1:P.F0.989(corrected),capacitorvoltage11kv
Node
Total magnitude of kvar Decreased of Loosing (kilowatt) 14 950 7.65 16 950 11.41 4 1360 4.85
Total 3250 23.91
Al_Jamiea_2:P.F0.969(corrected), capacitorvoltage11kv
Node
Total magnitude of kvar Decreased of Loosing (kilowatt) 39 925 3.12 49 465 4.2 29 925 10.88 Total 2315 18.2
Al_Jamiea_3:P.F 0.988(corrected),capacitorvoltage11kv
Node
Total magnitude of kvar Decreased of Loosing (kilowatt) 66 1375 5.75 96 475 9.6 85 850 10.4 Total 2800 25.75
Al_Jamiea_4:P.F0.979(corrected),capacitorvoltage11kv
Node
Total magnitude of kvar Decreased of Loosing (kilowatt) 115 925 1.85 56 925 5.54 119 425 2.47 Total 2275 9.86
International Research Journal of Engineering and Technology (IRJET) e-ISSN:2395-0056
Volume: 09 Issue: 12 | Dec 2022 www.irjet.net p-ISSN:2395-0072
Fig. 7.4 Al_JamieaNetworkafterapplication(reconfigurationsystemmethod)(withabnormalconditions)
Fig. 7.5 Al_Jamieanetwork(Optimalcapacitorplacement)
International Research Journal of Engineering and Technology (IRJET) e-ISSN:2395-0056
Volume: 09 Issue: 12 | Dec 2022 www.irjet.net p-ISSN:2395-0072
Table 7.7 Al Jamieanetwork(SummaryofresultsbyCYM_Dist)
Before growthing of load at 2021
Jamiea _1
After growthing of load at 2025
After System reconfiguration After Compensation kvar
Voltagevalue(max.)perunit 10 10 10 10
Voltagevalue(min.)perunit 0.983 0.974 0.985 0.986 kWperunitphase(totalactivepower) 1728 3023 233 1497
TotalReactivepowerloss(kvar)perphase 156 2723 2059 1329 powerloadperphase(TotalkW) 1203 15825 1431 1431 loadperphase(Totalkvar) 900 1179 1071 1071
TotalapparentpowerkVAloadperphase (totalvalue) 1501 1975 1788 1786
Table 7.7 continued
Jamiea _2
Before growthing of load at 2021 After growthing of load at 2025 After System reconfiguration After Compensation kvar
Voltagevalue(max.)perunit 10 10 10 10 Voltagevalue(min)perunit 0988 0982 0974 0986
TotalPowerloss(kW)perunitphase (active) 772 1402 1751 1142
Totalreactivepowerloss(kvar)per phase 7.92 14.42 18.20 11.79
powerloadperphase(TotalkW) 1012.0 1351.2 1371.9 1371.9 loadperphase(Totalkvar) 758 1010 10278 10279
TotalapparentpowerkVAloadperphase (totalvalue) 1265 1690 17149 17148
Table 7.7 continued
Jamiea _3
Before growthing of load at 2021 After growthing of load at 2025 After System reconfiguration After Compensation kvar
Voltagevalue(max.)perunit 1.0 1.0 1.0 1.0 Voltagevalue(min.)perunit 0.973 0.964 0.973 0.982
TotalPowerloss(kW)perunit phase(active) 22.14 39.07 25.37 16.67
Totalreactivepowerloss(kvar /phase) 21.30 37.49 23.11 15.30
powerloadperphase(TotalkW) 1095.9 1448.01 1376.9 1376.8 loadperphase(Totalkvar) 820 1082 1030 1030
TotalapparentpowerkVAloadper phase(totalvalue) 1369 1807 1720 1720
International Research Journal of Engineering and Technology (IRJET) e-ISSN:2395-0056
Volume: 09 Issue: 12 | Dec 2022 www.irjet.net p-ISSN:2395-0072
Accordingtotable(7.4),thetotalnetworkpowerlossesare151.29,269.36,229.29,and149.97kW,respectively,before,after load rise, after systemreconfiguration, and after kvar correction. Thus, 118.07 kW are save between the case with load increaseandthecasewithkvarcorrection.
Table7.8showstheyearlycostsoflossesusingequations(4)and(5);theoverallnetsavingcostofthemaximumdemandis 32.45*103 $/year.
Table 7.8 Yearlycostoflosses(Al_Jamieasystem)($/year)
Feeder name
Feeder load factor (%)
Before growthing of load at 2021
After growthing of load at 2025
After System reconfiguration
After Compensation kvar
Jamiea_1 65 6.73 12.04 9.175 6.53
Jamiea_2 65 3.12 5.53 6.848 4.92
Jamiea_3 65 8.71 15.57 10.01 7.153
Jamiea_4 65 1.43 2.64 4.101 3.23
Totallosscost($) 19.99 35.78 30.134 21.833
Fig.(7.7a,b,c,andd)depictthebusvoltageprofilesofselectedfeedersofAlJamiea'snetwork.
1.beforegrowthingofload
2.aftergrowthingofload
3.afterreconfigurationofthesystem.
4.4.aftercapacitorpositioning
It is demonstrate that the total voltage valueswould drastically decrease within the defined limits after implementing load increase. By using the network reconfiguration approach, these values were improved, and they further improve after allocatingcapacitorstothesefeeds,bringingthemclosertoonep.u.
International Research Journal of Engineering and Technology (IRJET) e-ISSN:2395-0056
Volume: 09 Issue: 12 | Dec 2022 www.irjet.net p-ISSN:2395-0072
1
0.995
0.99
0.985
1.005 Voltage value (P.U)
0.98
0.975
0.97
No. of Buses
0.995
1.005 Voltage value (P.U)
1
0.99
0.985
loading growth(before) loading growth(after) switching optimization(after) capacitor placement (after) 0.98
Fig. 7.7a FeederAl Jamiea_1(Voltageprofile) Fig. 7.7b FeederAl Jamiea_2(Voltageprofile)
loading growth(before) loading growth(after) switch optimization(after) capacitor placement (after)
No. of Buses
International Research Journal of Engineering and Technology (IRJET) e-ISSN:2395-0056
Volume: 09 Issue: 12 | Dec 2022 www.irjet.net p-ISSN:2395-0072
1.01
Voltage value (P.U )
Before load growth After load growth
Voltage value (P.U)
1
0.99
0.98
0.97
0.96
0.95
1.002
1
0.998
0.996
0.994
0.992
0.99
0.988
No. of Buses
Fig. 7.7c FeederAl_Jamiea_3(Voltageprofile)
Before load growth After load growth
After switching optimization After capacitor placement
After switching optimization After capacitor placement 0.986
No. of buses
Fig. 7.7d FeederAl_Jamiea_4(Voltageprofile)
International Research Journal of Engineering and Technology (IRJET)
e-ISSN:2395-0056
Volume: 09 Issue: 12 | Dec 2022 www.irjet.net p-ISSN:2395-0072
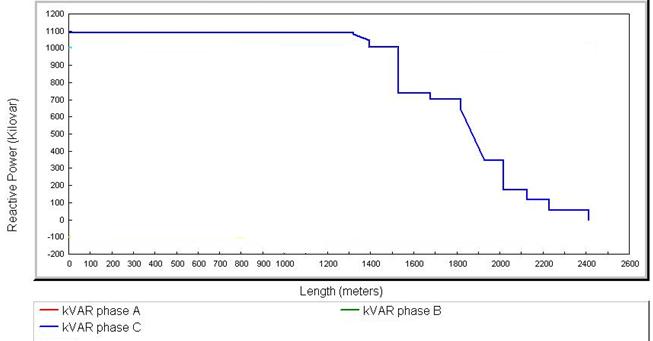
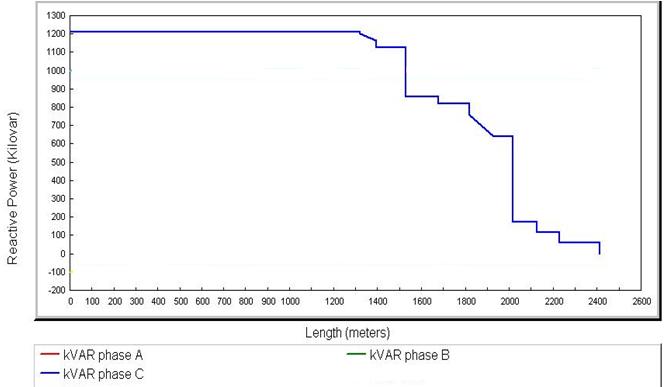
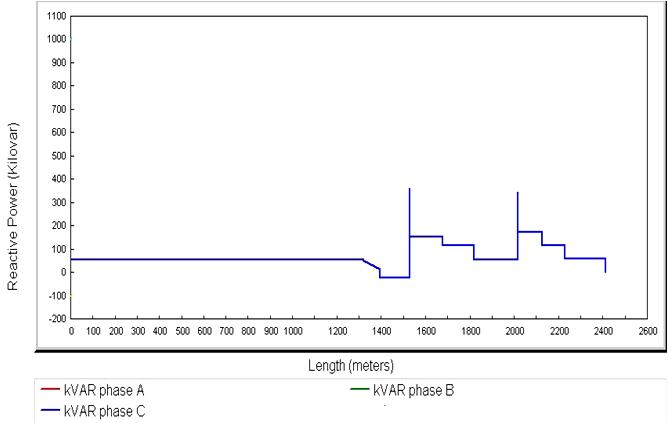
For Al_ Jamiea, Fig. (7.8) depicts the influence of the completely downstream kvarprofile in relation to lengths. The longest route from the substation that feeds this system to bus 21 is 1 feeder of each segment. Figure (7.8a) considers the behavior before load increase.. Considered in Figure 7.8b is the behavior following load increase. Figures 7.8c and 7.8d depict the behaviorfollowingnetworkreconfiguration&kvarcorrection,respectively.
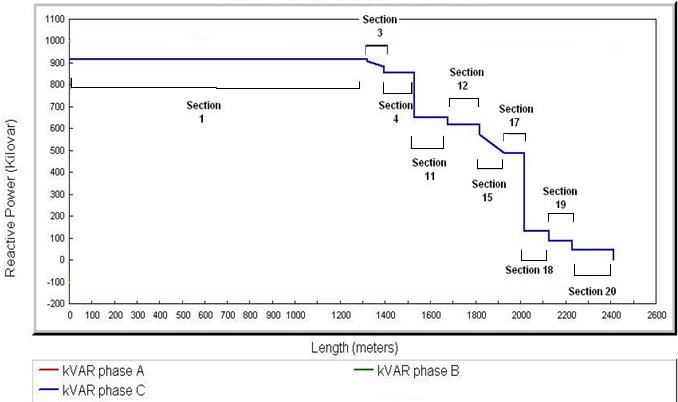
At Section 1 (1319m in length) has 914.3 downstream kvar per phase before adjusting; when load increases, this value increases to 1210 kvar/phase (above the max. value).After implementing systemreconfiguration, the kVar/phase is then decreaseto1091.ThekVar/phaseincreasedto54.5attheendofthedesignprocesswhenthecapacitorswereinstall,andso on for the remaining portions. The total active &reactive power losses will be decrease since the capacitor-equipped parts serveasasourceofreactivepower.Eachfeeder'stotalP.F.hasincreased,asseenintable(7.4).
Fig. 7.8a Al_Jamiea_1beforeloadgrowth(kvarprofile)
International Research Journal of Engineering and Technology (IRJET) e-ISSN:2395-0056
Volume: 09 Issue: 12 | Dec 2022 www.irjet.net p-ISSN:2395-0072
Fig. 7.8 b Al_Jamiea_1afterloadgrowth(kvarprofile)
Fig. 7.8 b Al_Jamiea_1afterloadgrowth(kvarprofile)
International Research Journal of Engineering and Technology (IRJET) e-ISSN:2395-0056
Volume: 09 Issue: 12 | Dec 2022 www.irjet.net p-ISSN:2395-0072
Fig 7.8 d Al_Jamiea_1aftercapacitorplacement(kvarprofile)
8. CONCLOSION OF WORK
Theoutcomesof3simulationprocessesperformedwhenconstructingdistributionsystemsusingtheCYM_Distprogram;
Loadflowthennetworkreconfigurationandcapacitoroptimalallocation
The recommended method then verified and confirmed through application to typical distribution network with a perfect matchofoutcomestothosereportedintheliteratureutilizingbothoptimumreconfiguration&capacitorpositioning
Inaddition,theresultsfromdesigningintheAl_JamieadistributionnetworkintheNajafcityinIraqbytheCYM_Distprogram showthatthereductioninpowerlossesafterapplyingtheproposedtechniquebyusethereconfigurationofselectednetwork inadditionwithoptimalcapacitorposition.
Thesystem'soverallvoltageprofilehasalsoenhanced,anditisnowpossibletoseethatthesystemisrunningnormallywith norestrictionsbeingbroken.
REFRENCES
Satish Kumar Injeti and Navuri Prema Kumar, “Planning and Operation of Active Radial Distribution Networks for Improved Voltage Stability and Loss Reduction”, World Journal of Modeling and Simulation, England, UK, Vol. 8, No. 3, February2012
KwangY.Lee,Jin-O.Kim,Joong-RinShin,Jae-ChulKimandYoung-JaeJeon,“AnEfficientSimulatedAnnealingAlgorithmfor NetworkReconfigurationinLarge-ScaleDistributionSystems”,IEEETransactionsonPowerDelivery,Vol.17, No.4,pp.10701078,October,2018
International Research Journal of Engineering and Technology (IRJET) e-ISSN:2395-0056
Volume: 09 Issue: 12 | Dec 2022 www.irjet.net p-ISSN:2395-0072
RajaAyyanar,Tang,XiaolinMaoandYingying,“DistributionSystemModelingByCYM_DistforStudyofHighPenetrationof DistributedSolarPhotovoltaics”,PublishedbyIEEE,ArizonaStateUniversity,USA,2020.
AliAlbakri,“DesignandAnalyzingStudyofanEnergySavingSchemeforanIndustrialDistributionNetworkinNajafRegion ByProfessionalPowerSystemSoftware(EDSA)”,JournalofKerbalaUniversity,Vol.4No.1,2019.
P. S. Subramanyam, Houssem Rafik P. S. Subramanyam, “Introduction to Power Engineering”, Umm Al-Qura University, KingdomofSaudiArabia,2011.
Pradeep Kumar, Asheesh K. Singh and Nitin Singh, “Sensitivity Based Capacitor positions: A Comparative Study”, InternationalConferenceonIndustrialandInformationNetworks,ICIISSriLanka,IEEE,December,2011
“CooperPowerSystem,CYM_DistSummary,” http://www.cyme.com/software/cymdist/B1170-12023-CYMDIST- Summary.pdf
Y. S. Shishodia and Tanuj Manglani, “Reduction in Power Losses on Distribution Lines Using Bionic Random Search Plant GrowthSimulationAlgorithm”,InternationalJournalofRecentResearchandReview,Vol.III,September2012.
R. Thahab, “Load Behavior and Characteristics for the Iraq Power System”, M. Sc. Thesis, University of Technology, December2019.
Rajesh Kavasseri & Cristinel Ababei “Speeding-up system Reconfiguration by Minimum Cost Max. Flow Based Branch Exchanges”,IEEEEvolutionaryComputationConf.,pp.1-7,2017.
CYME International – CYM_DistBasicAnalyses – Users Guide,” http://www.cymetd.com/manuel/dist50/eng/CYME_5-02Basic_Analyses_User_Guide_EN_V1-2.pdf
“CYMEReferenceManual”, www.scribd.com/doc/136501684/CYME-502-Ref-EN-V1-2
Satish Kumar Injeti and Navuri Prema Kumar, “Planning and Operation of Active Radial Distribution Networks for Improved Voltage Stability and Loss Reduction”, World Journal of Modeling and Simulation, England, UK, Vol. 4, No. 3, February201
W.H.E. Liu ,Q.Zhou,&D. Shirmohammadi,“SystemFeederReconfigurationforServiceRestorationandLoad Balancing” IEEETransactionsonenergySystems,Vol.12,No.3,pp.655-661,May,1997.
MoreinformationabouttheNetworksinIraq(Najafcity)fromtheministryofElectricity.