International Research Journal of Engineering and Technology (IRJET) e-ISSN: 2395-0056

Volume: 09 Issue: 12 | Dec 2022 www.irjet.net p-ISSN: 2395-0072
International Research Journal of Engineering and Technology (IRJET) e-ISSN: 2395-0056
Volume: 09 Issue: 12 | Dec 2022 www.irjet.net p-ISSN: 2395-0072
1Mtech Student, Dept. of Civil Engineering (Structural Engineering) VEC Ambikapur,C.G. India 2Assistant Professor and PhD Scholar VEC Ambikapur,C.G. India 3 PhD Scholar VEC Ambikapur,C.G. India ***
Abstract - Seismic vulnerability assessment to being structure has gained nation-wide attention, particularlyafter 2001 Gujarat Earthquake and 2005 Kashmir Earthquake. There isn’t important trouble available in literature for seismic evaluation of existing bridges althoughbridgeisavery important structure in any country. In order to evaluate existing bridges and to suggest design of retrofit schemes performance based nonlinear pushover analysis is applied in some international codes but no such inclusion is found in Indian Codes. In order to draw comparisonbetweenpushover analysis schemes with Indian method of Seismic analysis, the present project aimed to carry out a seismic evaluation of RC Bridges using nonlinear static (pushover) analysis. The two series of model bridges are analyzed using displacement coefficient method (FEMA 356), capacity spectrum method (ATC40), displacement modification method (FEMA440) and equivalent linearization method (FEMA 440). Each series consist of five bridges one with varying span and other with varying pier height. Few parameters that are used for bridge analysis are modified in this study. The evaluation results presented here shows that the modeled bridges designed as per IS codes falls short to meet the desired performance level as per non-linear pushover scheme.
Key Words: NonlinearPushoverAnalysis,FEMA,ATC40
Indiahashadanumberoftheworld’sgreatestearthquake sincethelastcentury TheHimalayanregionofIndiaismore pronetoearthquakewheretheseismicmagnitudeisabout of8.0richerscaleandleadstodrasticallyhighdamage.After 2001GujaratEarthquakeand2005KashmirEarthquake,the resignation-wide attention to the seismic vulnerability assessmentofoldstructure.TheISCodeforseismicdesignis alsorevisedbecausemagnitudeofearthquakechangesits effectwasdangerousafterstudyingpasteffectoverseismic proneregion.Manystructuralengineersgavetheireffortfor its revision so that the building that they make should be safe against seismic effect. The magnitudes of the design seismicforceshavebeenconsiderablyenhancedingeneral, andtheseismiczonecategoryofsomeregionshasalsobeen upgraded.Datapresentinvariousliteraturelike IITM-SERC Manual, 2005 available that presents step-by-step procedurestoevaluatemulti-storeybuildings.Forseismic analysis we follow static nonlinear analysis also called pushoveranalysiswiththehelpofcodeFEMA356
The attention for existing bridges is comparatively less. Bridgeprovidesabettertransportationsystem.But,alarge numberofbridgesweredesignedandconstructedwithout consideringseismicforces.Itismusttodesignandcheckthe bridges in seismic condition. For retrofitting of existing bridges,buildingsoranytypeofstructurecurrentlythere are no guidelines that will assist engineer in maintaining structurelife.Inordertoaddressthisproblem,thepresent work aimstocarryouta seismicevaluationofRCbridges usingnonlinearstatic(pushover)analysis.Nonlinearstatic (pushover)analysisasperFEMA356isnotcompatiblefor bridgestructure.Bridgesarestructurallyverydifferentfrom amulti-storeybuilding
It is used to find strength, drift of building already exists, effectonearthquakeloadinganditsdemandcurve,itsfailure chancesetc.ForworkinginpushoverATC40andFEMA356, eurocodesPCM3274areused.Thebuildingsareconverted tomathematicalmodelsusingnonlinearloaddeformation characteristicsofeveryelementandmonotonicallyloadsare applied. The target displacement and lateral loads are implemented where target displacement is the maximum displacementbuildingcanbearduringseismicforces.
Theseismic demandparametersare global displacements (atroofforanyotherreferencepoint),storeydrifts,storey forces,componentdeformationandforces.
Response characteristics that can be obtained from the pushoveranalysisaresummarizedasfollows:
1.Forceanddisplacementcapacitiescurvesareestimated forthestructure.
2.Wewillgetaxialforces,shearvalues,bendingmomentsof elementsthatarebrittleinnatureandforductilematerials deformationdemandisestimated.
3.Elementswhichfailsandtheireffectonstability.
4. Identification of the critical regions, where the inelastic deformationsareexpectedtobehighandidentificationof strength irregularities (in plan or in elevation) of the building.
International Research Journal of Engineering and Technology (IRJET) e-ISSN: 2395-0056
Volume: 09 Issue: 12 | Dec 2022 www.irjet.net p-ISSN: 2395-0072
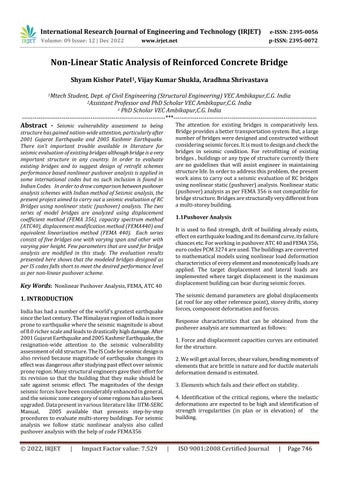
Inthislateralloadismonotonicallyincreasedaccordingto predefined distribution pattern along building height. (Fig1.1a).thedisplacementtobuildingismaintaineduntil controlnodesreachesthetargetdisplacementoratastateof buildingcollapse.Crackingpattern,plastichingegeneration and failure is observed. Plot between nodal displacement andbaseshearisdrawningraph.
1.AlthoughliteraturereviewonapplicationofAdaptive pushover analysis for RCC Bridge and seismic performanceofbridgepiers.
2. Carryout bridge modelling in suitable software and designthebridgeasper designcodeIRC21-2000&IRC 6-2002andperformpushoveranalysis.
3. We will perform pushover on bridge models with differentspans
4. Repeat the Bridge modelling and pushover analysis withvaryingpierheights.
5. Compare the result of non static linear pushover demandwithdesigndemandbasedonIndiancodesand arriveataconclusion.
Fig 1.1:Schematicrepresentationofpushover
Generationofbaseshear–controlnodedisplacementcurve is single most important part of push over analysis. The curveobtainedisalsocalledpushoverorcapacitycurveand givestargetdisplacement.Sothepushoveranalysismaybe carried out twice: (a) first time till the collapse of the building toestimatetargetdisplacementand(b)nexttime tillthetargetdisplacementtoestimate theseismicdemand Thevaluesoflateralforces,storeydrift,targetdisplacements arecalculatedusingpushoveratvariouslevelofbuildings. These values are then compared with the values of predefinedlimitsofsamestructuralcapacity.
Orthogonalaxisisconsideredforindividualanalysisunless and until it is not needed we didn’t perform it using bidirectionalaxis.Whereresultsthatareobtaineddependon control nodes and load pattern. The lateral load generally appliedinbothpositiveandnegativedirectionsalongwith gravityload(deadloadandaportionofliveload)tostudy theactualbehavior.
Theobjectivesofstudyareasfollows:-
1.Tostudythestandardpushoveranalysisproceduresand otherimprovementin pushovermethodologyavailablein literature.
2.To carry out a detailed exhaustive study of pushover analysisforanumberof reinforcedconcretebridgesusing standardpushoveranalysisandother improvedpushover method.
3.To compare seismic analysis results performed as per Indianstandardswiththe resultsofpushoveranalysisfor bridges.
6.Theperformanceofdifferentmodelsarecomparedto eachother.
Accuratemodelingofthe nonlinearpropertiesofvarious structuralelementsisveryimportantinnonlinearanalysis. In the present study, piers were modeled with inelastic flexuraldeformationsusingpointplasticmodel. Weshould provide Mass distributions, stiffness; strength should be represented by the model. Modeling of the material propertiesandstructuralelementsusedinthepresentstudy arediscussedhere.
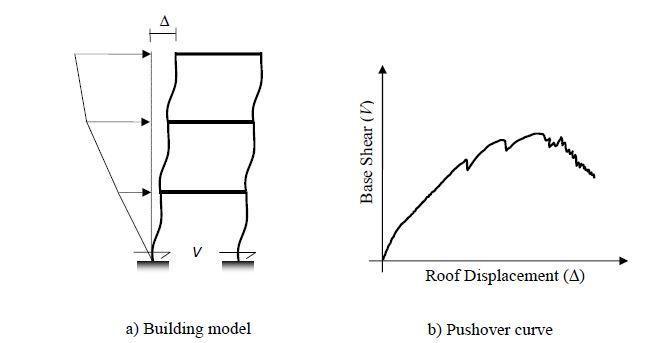
3.1 Structural Elements - We have modeled the 3D elements of Piers, Cap, Girders decks for performing pushover.Thegirder-pierjointsaremodeledbygivingendoffsets to the frame elements, to obtain the bending momentsandforcesatthebeamandcolumnfaces.Thepiercapjointsareassumedtoberigid(Fig.3.1).Thepierendat foundation was considered as fixed. Moment releases are appliedatbothendsofallthegirders.Thisisdonetoobtain simplysupportedconditionasperactualstructure.Allthe pierelementsaremodeledwithnonlinearpropertiesatthe possible yield locations. Deck is not modeled physically. Weightandmassofdeckisalsoconsideredinthedeadload ofstructure.
3.2 Bridge Geometry-Inthisstudytwosetofbridgesone withfixedspanandvaryingpierheightandtheother with fixedpierheightandvaryingspanaremodeled.
3.3 Fixed Span Bridges -Thebridgeconsideredconsistsof two spans each of 30m. The bridge deck is supported by single-span concrete girders. Girders are placed on the concrete pier-caps through the bearing and locked in the transversedirection.Thesupportingpiersheightsaresame forsinglebridgeandarevariedtoobtainthedesiredseries. Bridge mode in WBRH5M, NWBR H10M. NWBR H15M, NWBRH20M&NWBRH25Mwithpierheightsof5m, 10m,
International Research Journal of Engineering and Technology (IRJET) e-ISSN: 2395-0056
15m,20mand25mareusedin thestudy. Thewidthofthe bridgeis10.5m
Fig. 3.1: TypicalCross-sectionaldetailsofthebridge
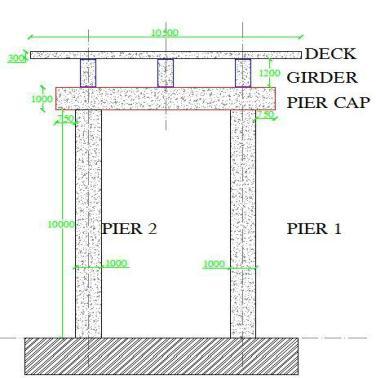
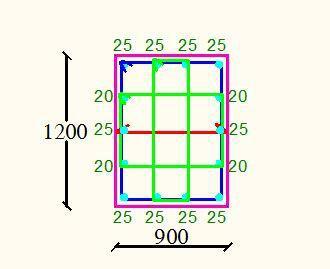
Fig. 3.2: TypicalDetailsofthepiersection
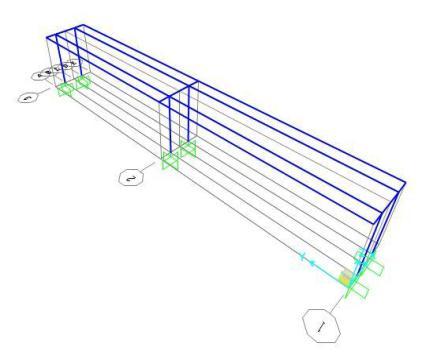
3.4Fixed Pier Height Bridges -The Bridge considered consists of two spans of same length. The bridge deck is supported by single-span concrete girders. Girders are placedontheconcretepier-capsthroughthe bearingand locked in the transverse direction. The supporting piers heightis15mandsameforallbridgesandspanlengthare varied to obtain the desired series. Bridge models NWBR S20M, NWBR S30M. NWBR S40M, NWBR S50M & NWBR S60M with span of 20m, 30m, 40 m, 50m and 60m are adoptedforthestudy. Thewidthofthebridgeis10.5m Fig. 3.1presentsa sectionview ofthe bridgein Y-Zplanethat showsthepieranddeckarrangementanddimensions.Pier cross-sectionisofrectangularsizeasshowninFig.3.2 The Bridge is modeled using commercial software SAP 2000 V18.0.1.Ultimate.A3Dcomputermodelisshowninbelow.
3.5 Modeling of flexuralplastic hinges. –Thedevelopment ofsoundmodeltoexplicitlydefinethenonlinearbehaviorof thestructuralelementsisintegralintheimplementationof pushover analysis. In the present study, a point-plasticity approach is adopted for modeling nonlinearity of RCC elements,plastichingesareassumedtobeappliedinorder toconcentratetheloadatspecificpointinframes. Piersin this studyare modeled with flexure (P-M2-M3) hinges at possibleplasticregionsunderlateralload(i.e.,bothendsof thebeamsandcolumns).
Plastic hinges are assumed at an offset of .05L from both ends. Lateral load are applied with flexural hinges so that actualresponseisseeninRCCcomponent.Inpracticaluse, mostoftenthedefaultpropertiesprovidedintheFEMA-356 and ATC-40 documents are preferred due to convenience and simplicity .SAP-2000 performs nonlinear static pushoveranalysisincorporatewiththeimplementationof default flexural hinge properties based on FEMA356andATC-40.Italsoallows modifying the default properties.Inthisstudytheconceptofgeneratedproperties isusedinSAP2000,whengeneratedpropertiesareused,the program which combines its built-in criteria (FEMA356andATC-40)withthedefinedsectionpropertiesforeach object to generate the final hinge properties. Moment curvature analysis is carried out in order to get hinge properties which depend on reinforcement and area of element.Therelationbetweenconcrete,rebars,Hingesits lengthisneededforcalculation Only axial forcesare only requiredforpierflexuralhinges,whererotationareneeded alongwithgravityloadconditions.
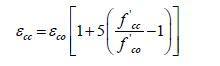
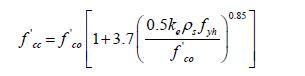
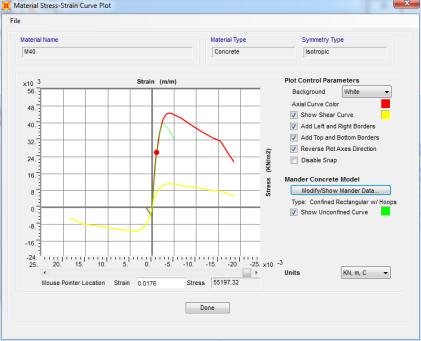
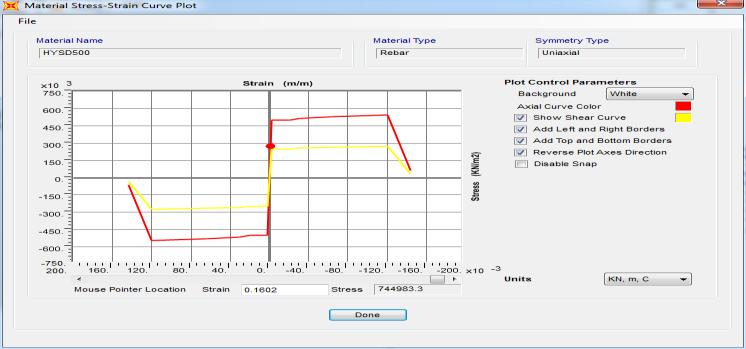
3.6Stress-Strain Characteristics for Concrete-Thestressstraincurveofconcreteincompressionformsthebasisfor analysis of any reinforced concrete section. The characteristic and design stress-strain curves specified in mostofdesigncodes(IS456:2000,BS8110)donottruly reflect the actual stress-strain behavior in the post-peak region, as (for convenience in calculations) it assumes a constant stress in this region (strains between 0.002 and 0.0035).Microcracksandsofteningareseeninexperimental testing.Also,modelsasperthesecodesdonotaccountfor strength enhancement and ductility due to confinement. However,thestress–strainrelationspecifiedinACI318M02 consider some of the important features from actual behavior.A previous study(Chugh,2004) onstress- strain relation of reinforced concrete section concludes that the model proposed by Panagio tacos and Fardis (2001) represents the actual behavior best for normal-strength concrete. Accordingly, this model has been selected in the present study for calculating the hinge properties. This modelisamodifiedversionofMander’smodel(Mander et al., 1988)whereasingleequationcangeneratethestress fc correspondingtoanygivenstrain εc:
Volume: 09 Issue: 12 | Dec 2022 www.irjet.net p-ISSN: 2395-0072 © 2022, IRJET | Impact Factor value: 7.529 | ISO 9001:2008 Certified Journal | Page748
International Research Journal of Engineering and Technology (IRJET) e-ISSN: 2395-0056
Volume: 09 Issue: 12 | Dec 2022 www.irjet.net p-ISSN: 2395-0072
fc=f` ccx r/r-1+xn where,x=εc/εcc;r=Ec/EcEsec;Ec=5000.f’’ co -1;Esec=f`cc/εccandf` ccis the peak strength expressedasfollows:
Fig3.4: Plotofstress-straincharacteristicsforM-40grade ofconcreteasperModified Mander’smodel
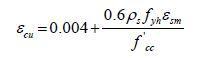
Theexpressionsforcriticalcompressivestrains(ref.Fig.5.6) areexpressedinthismodel asfollows:
,f' co is unconfined compressive strength=0.75 fck, ρs=volumetric ratio of confining steel, fyh=grade of the stirrupreinforcement,εsm=steelstrainatmaximumtensile stressand k eisthe“confinementeffectivenesscoefficient”, havingatypicalvalue of0.95forcircularsectionsand0.75 forrectangularsections.
The advantage of using this model can be summarized as follows:
1.Asingleequationdefinesthestress-straincurve(boththe ascendinganddescendingbranches)inthismodel.
2. The same equation can be used for confined as well as unconfinedconcretesections.
3. The model can be applied to any shape of concrete member section confined by any kind of transverse reinforcement (spirals, cross ties, circular or rectangular hoops).
4. The validation of this model is established in many literatures.
3.7
SteelTheconstitutiverelationforreinforcingsteelgiveninIS456 (2000)iswellacceptedinliteratureandhenceconsidered forthepresentstudy The‘characteristic’and‘design’ stress strain curves specified by the Code for Fe-500 grade of reinforcingsteel(intension orcompression)areshownin Fig.3.6.
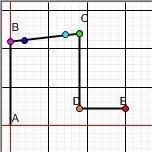
3.8 Moment-Rotation Parameters – The input of hinges that is found by moment curvature
Fig3.5: Stress-strainrelationshipforreinforcement–IS 456(2000)
Arepresentloadedcondition
Bshownominalyieldstrengthandyieldrotationθy
Cshowultimatestrength,ultimaterotationθu
Drepresentresidualstrengthlimitedby=20%ofyield strength
Eshowmaximumdeformationcapacity=15θyor θu, whicheverisgreater.
Fig. 3.6: Idealizedmoment-rotationcurveofRCelements [; ;.
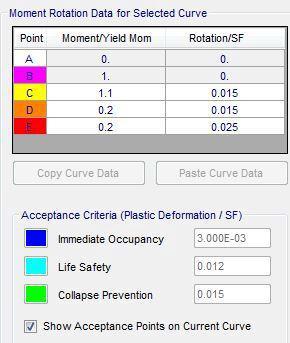
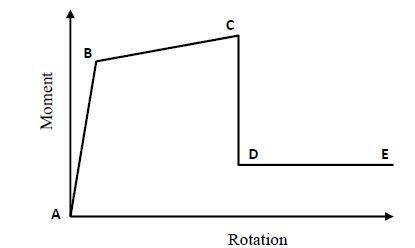
Fig. 3.7: Generatedmoment-rotationcurveofRCelements withacceptancecriteria
International Research Journal of Engineering and Technology (IRJET) e-ISSN: 2395-0056
Volume: 09 Issue: 12 | Dec 2022 www.irjet.net p-ISSN: 2395-0072
Inthisstudyhingesaredefinedasautohingetypeswhich arebasedontableinFEMA356.Table6-8(ConcreteColumnFlexure).Itemisselectedasdefininghingebehaviortype.
ComponenttypeisprimarywithdegreeoffreedomasP-M2M3 type. Transverse reinforcement is conforming. The moment-rotationcurveusedbySAP2000alongwithvarious performancelevel
The two series of model bridges are analyzed using displacement coefficient method (FEMA 356), capacity spectrum method (ATC 40), displacement modification method (FEMA 440) and equivalent linearization method (FEMA440). Pushoverinloadcontrolmannerisappliedfor gravity loads and lateral analysis in transverse axis is performedindisplacementcontrolledform.ForZoneVIRC 112:2011and6:2016PGAvalue0.36gresultsareobtained.
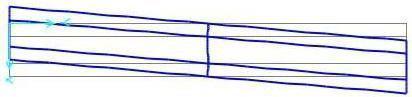
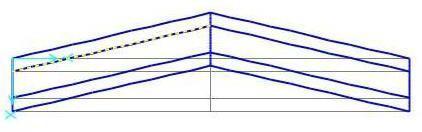
Modal Properties- Linear dynamic modal analysis was performed to obtain the modal properties of thebridge models. Table 4.1 shows the details of the important modes of the bridge intransverse direction (X direction). The table shows that participating mass ratio in thefirst mode and cumulative mass participating ratio for first four modes for modeledbridges. Theaveragecontribution of first mode in modal mass participation is 54.4%while theaveragecumulativemassparticipatingratioforfirstfour modesis96.4%.forbuildingthatarenormalhighermodeis obtainedandisvaluable.Fig-4.1andfig.4.2 show1st four mode shapes. We assume 100% fundamental modes in structuralresponsewhichisnotforbridges.
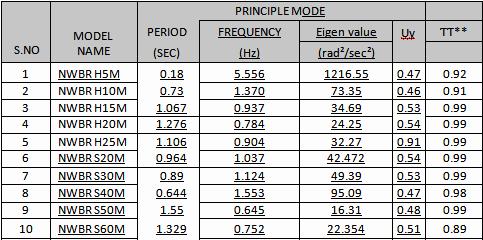
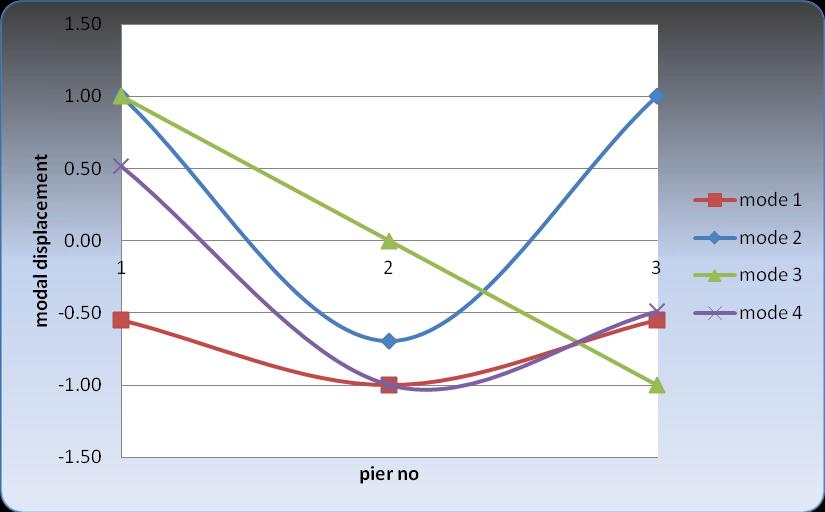
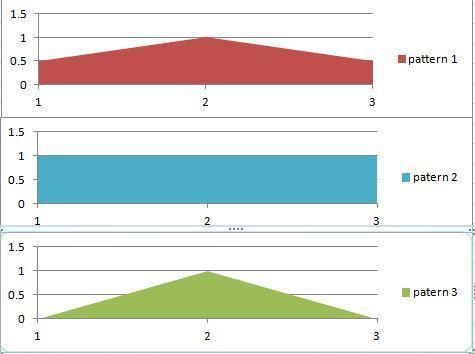
Table4.1:ElasticDynamicPropertiesoftheBridgefor Lateralvibration(X-direction)
Uy=modalmassparticipationforfirstmode
ƬƬ**= cumulative mass participating ratio for first four modes
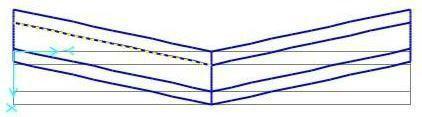
Fig.4.1:Firstfourmodesofthebridge(normalizedtoPier# 2)
Fig.4.2:Differentlateralloadpatternused
PushoverAnalysis-Pushover analysis is carried out using FEMA 356 displacement coefficient method, ATC 40 capacity spectrum method, FEMA 440 equivalent linearization method (modifiedCSM)aswellasFEMA440 displacement modificationmethod(ImprovementforDCM). A triangular load pattern was used for standard pushover analysis(FEMA356).Fig.4.3showstheloadpatternusedfor standardpushoveranalysis.
International Research Journal of Engineering and Technology (IRJET) e-ISSN: 2395-0056
Volume: 09 Issue: 12 | Dec 2022 www.irjet.net p-ISSN: 2395-0072
fledged time history analysis, hence capacity curves for variousbridgeswithloadpattern1arefurtherdiscussed.
a)Firstmode b) Secondmode c)Thirdmode d)Fourthmode
Fig.4.3:Firstfourmodesofthebridge(planview)
Lateral Load Pattern-Three different load patterns are usedtorepresenttheloadintensityproduced byearthquake as shown in fig 4.3. The first pattern, which is the Trapezoidal Pattern, is based on lateral forces that are proportionaltothetotalmass assigned to eachnode. The second pattern, which is uniform pattern, is based on standardloadpatternasperFEMA356. The third pattern, which is triangular, is based on shape of principle mode deformationasshowninfig4.2
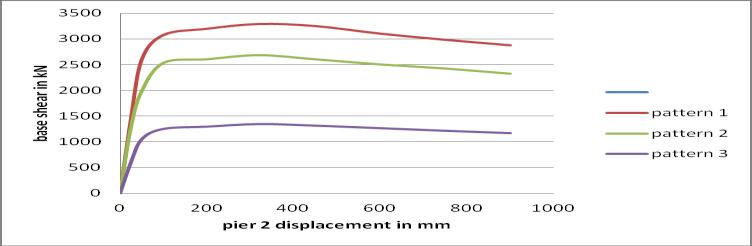
Capacity Curve -Capacity curve of the bridge as obtained fromthefourpushoveranalyses(displacement coefficient method capacity spectrum method, displacement modificationmethodandequivalentlinearizationmethod) and three different load patterns are plotted and presented in Fig. 4.4. Fig. 4.4 shows that load pattern1 estimates a very high base-shear capacity of the bridge in transverse direction as compared to the triangular load patternanalysis.Howevertheestimatedductilityisalmost same for allthree load patterns. Fig 4.4 demonstrates the influenceoflateralloadpatternonthecapacitycurveofthe structure. Lower shear capacity of bridge for triangular pattern load is caused by large deviation in base shear of individual piers. At performance point the base shear for pier2isalmostsameforallloadpatternsbutatpier1and pier 3 there is large variation in base shear for different patternresultinginvariationsinthetotalshearcapacityof bridge.
Therearedifferentloadpatternatdifferentnodesi.e.load pattern1 give conservative results and closer to the full
Fig.4.4:CapacitycurveofthebridgeNWBRS30M
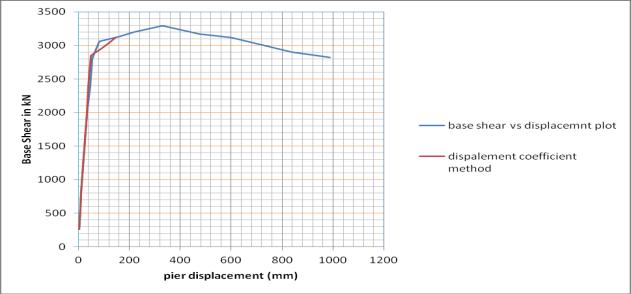
Fig. 4.5:CapacitycurveofthebridgeNWBRS30MbyDCM
Capacity Curve for Displacement Coefficient Method- The Pushover analysis has not been introduced in the Indian Standardcodeyet.ThustheproceduredescribedinFEMA 356 is adapted to accommodate seismic parameters of IS:1893-2016
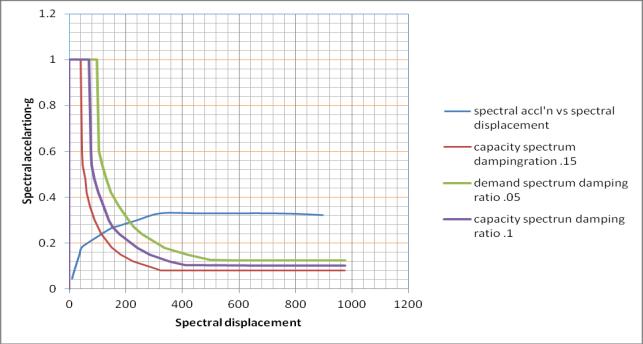
The curve is plotted acc to ADRS format And ATC -40 value are altered acc to IS 1893:2016, and comparison of demandspectrumofCa,Cvarefound.Inthistestwehave takenCavalueas0.18andCvvaluesas0.245formediumsoil andhysteresisbridgebehaviorsastypeB
Typical pushover curve plotted for bridge model NWBR S30MbyCSMmethodisshowninfig4.6.
Fig.4.6:CapacitycurveofthebridgeNWBRS30MbyCSM
Capacity Curve for Equivalent Linearization MethodImprovementofcapacityspectrummethod.Inthismethod
International Research Journal of Engineering and Technology (IRJET) e-ISSN: 2395-0056
Volume: 09 Issue: 12 | Dec 2022 www.irjet.net p-ISSN: 2395-0072
effectivedampingandtimeperiodisfoundoutbyusingSAP AcctoFEMA440AndcurveisplottedforbridgeNWBRs30 byELM.asinfig4.7.
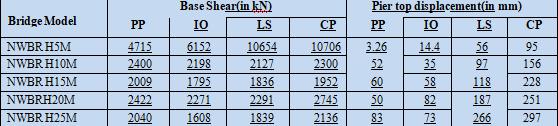
Series1–performanceofbaseshearfor5mpierishighest whichdecreasessuddenlyasheightincreases.
NWBRH5Mvaluesofbaseshearishighascomparedtoother bridge.
Ifheightislowstiffnessisveryhighandthusbaseshearis veryhighwithlowdisplacement.
Table4.3:BaseShearandDisplacementforSeries1 (varyingheightmodels)
Fig.4.7:CapacitycurveofthebridgeNWBRS30MbyELM
Capacity Curve for Displacement Modification Methodimprovement of displacement coefficient method (FEMA356).Demandspectrumparameters,siteclassSsand SlaresameasDCM method. EffectofSSIareincludedinthe analysis. The coefficients C1and C2 are calculated by new simplified expressions Typical pushover curve plotted for bridgemodelNWBRS30MbyDMMmethodisshowninfig4
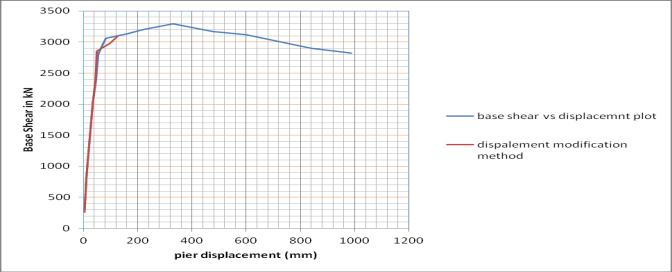
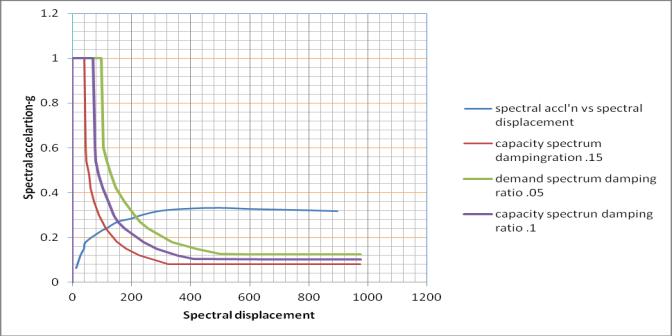
Table4.4:BaseShearandDisplacementforSeries2
(varyingspanmodels)
Fig.4.8:CapacitycurveofthebridgeNWBRS30MbyDMM
Target Displacements and Performance Point-Target displacementsandbasesheararecalculatedforfourdifferent pushoveranalysismethodsatperformancepoint
Table4.3showsbridgemodelNWBRS30Mbaseshearvalue andtargetdisplacementvalues. AcctoFEMA440And400.
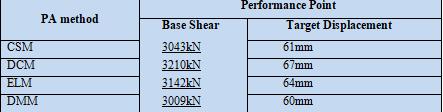
Base shear is same while DCM overestimates the shear demand slightly; the deviation is small enough to be neglected.thevaluesbetweenshearandtargetdisplacement ofCSMandDCMisreducedinELMandDMMmethod.
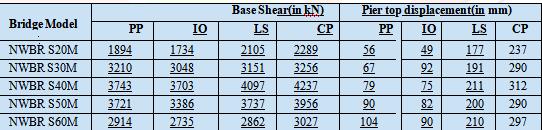
Table-4.2
NWBRS30M
PerformancepointofbridgesliesinIOandLSexceptlasttwo
whichhaslargedisplacementatLSandCPanddisplacement issmallforfirstbridgethenincreasesinother.
Series 2 is different from series 1 where for smallest span base shear is lowest and gets on increasing s span also increasesbutislessinlastbridge.
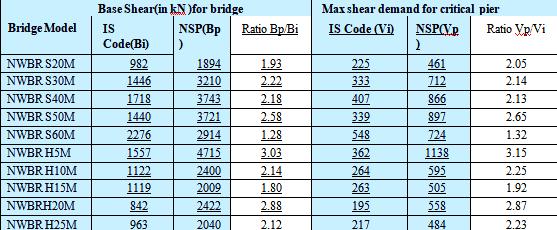
DemandComparisonwithIndianStandardCode-Thereview oftheIndiancodeprovisionsforRCpierdesigninlightof theinternationalseismicdesignpractices,andimportanceof employingtheperformancebaseddesignconceptinbridge design necessitates. To analyse any bridge model iS code 1893:2016part1isusedalongwithIRC-6:2016,and1122011. And the result are compared in NSP and IS code method.
Thecomparison isbasedontotalbasesheardemandof bridgeand maxsheardemandof critical pierasshownin table4.5,fig4.9andfig4.10. Inlinearstatic methodshear demand is multiplied by 1.5 FOS for coda demand. Base shearcomparisonofbridgetellsusthatpushoverdemand
International Research Journal of Engineering and Technology (IRJET) e-ISSN: 2395-0056
curveishighinIScodeprovisionforallmodels.Bp/Biratio formodeldemanddifferenceiscalculated.Wheresmallest pier has highest difference 3.03 while largest has smallest 1.28.
spectrum analysis (IRSA)”, Intnl Workshop on PBSD, Bled, Slovenia;publishedinPEERRep.2004-5.
4. Bernardo Frère,(2012), “PushoverSeismicAnalysisof Bridge Structures”, Departamento de Engenharia Civil, Arquitectura e Georrecursos, Instituto Superior Técnico, TechnicalUniversityofLisbon,Portugal.
5. Chiorean, Cosmin G.(2003), “ApplicationOfPushover Analysis On Reinforced Concrete Bridge Model”, Research Report No. POCTI/36019/99.
6. Chopra AK, Goel RK. (2000) “Evaluation of NSP to estimate seismic deformation: SDF systems”. Journal of Structural Engineering.2000;126(4):482–90.
The ends of bridges are restrained so that its dynamic characteristics differ from buildings.By analyzing the structure using Displacement Coefficient Method (FEMA 356), Capacity Spectrum Method (ATC 40), Displacement Modification Method (FEMA 440) and Equivalent LinearizationMethod(FEMA440)itwasconcludedthat:
i.Highbaseshearintransversedirectionisobtained
ii.Modalmassoffirstmodeis54.4%andofotheris96.4%
iii.CSMandDCMvaluesarereducedoverELMAndDMM
iv.Pushovercurveascomparedtocodalarehighsoinstead ofnonlinearstaticanalysis,staticanalysisispreferred.
v.TheTargetdeflectionintransversedirectionforlongest span bridge is more than 100 mmand highest bridge is morethan80mm.
vi. Performance point lies between Immediate Occupancy andLifeSafetylevelofperformance.
1. Akkar S.D., Miranda E.M.,(2005) ‘StatisticalEvaluation of Approximate Methods for Estimating Maximum Deformation Demands on Existing Structures’, Journal of Structural Engineering, ASCE, 131(1), 160-172.
2. Albanesi T., Biondi S., Petrangeli. (2002) ‘Pushover analysis: An energy based approach.’ Proceedings of the 12th European Conference on Earthquake Engineering, Paper 605. Elsevier Science Ltd.
3. Aydinoglou, M. N. (2004) “An improved pushover procedure for engng practice: Incremental response
7. Chopra, A.K. and Goel, R.K. (2004)“Amodalpushover analysisproceduretoestimate seismicdemands forunsymmetrical-plan buildings”. Earthquake Engineering and Structural Dynamics. 33,903-927.
8. Chopra, A.K., Goel, R.K. and Chintanapakdee, C. (2004).“EvaluationofamodifiedMPAprocedureassuming higher modes as elastic to estimate seismic demands”. Earthquake Spectra. 20(3),757-778.
9. Chung C. Fu and Hamed AlAyed, “Seismic Analysis of BridgesUsingDisplacement-BasedApproach”, Department of Civil & Environmental Engineering University of Maryland.
10. Craig D. COMARTIN etal.(2004), :ASummaryofFEMA 440: Improvement of Nonlinear Static Seismic Analysis Procedures”, 13th World Conference on Earthquake EngineeringVancouver,B.C.,CanadaAugust1-6,2004Paper No.1476
11. Eurocode 8 (2004), “Design of Structures for Earthquake Resistance, Part-1: General Rules, Seismic Actions and Rules for Buildings”, European Committee for Standardization (CEN), Brussels.
Fajfar, P. (2000). “A nonlinear analysis method for performance-based seismic design”. Earthquake Spectra, 16(3),573–592.
12. Federal Emergency Management Agency, FEMA 440: Improvement ofNonlinear Static Seismic Analysis Procedures (Washington,2005).
13. FEMA 356 (2000),“Pre-standardandCommentaryfor theSeismicRehabilitationofBuildings”, American Society of Civil Engineers, USA
14. FEMA 440 EquivalentLinearizationguidance.
Volume: 09 Issue: 12 | Dec 2022 www.irjet.net p-ISSN: 2395-0072 © 2022, IRJET | Impact Factor value: 7.529 | ISO 9001:2008 Certified Journal | Page753