International Research Journal of Engineering and Technology (IRJET) e-ISSN: 2395-0056

Volume: 09 Issue: 12 | Dec 2022 www.irjet.net p-ISSN: 2395-0072

International Research Journal of Engineering and Technology (IRJET) e-ISSN: 2395-0056
Volume: 09 Issue: 12 | Dec 2022 www.irjet.net p-ISSN: 2395-0072
1,2,3Department of Computer and Electrical Engineering 1,2,3University of Energy and Natural Resources- Sunyani, Ghana ***
Abstract - This paper introduces voltage stability analysis method in finding critical or less stable load buses in electrical power system. Voltage stability analysis technique discussed in this research are the Active Power- Voltage curve (PV) and Active Power-Reactive Power (PQ) curve analysis methods. The P-V curve method was utilized in determining the weak buses of a standard IEEE 30-bus system. The standard IEEE 30-bus system was simulated with Matlab software using Newton Raphson Continous PowerFlowalgorithm
Key Words: Critical bus, PQ curve analysis, PV curve analysis, Voltage stability analysis, Weak bus
EAK or critical buses in electrical power system can be describedasaloadbusthatexperienceexcessivevoltage decline with small load increase or variation. Load buses placed far from a generation bus can also experience high voltage drop from load variation. Weak buses have small activepowermarginandthereforeexcessiveloadincrease can cause them to exceed their voltage limit. Identifying weak buses in electrical power system have become an essentialactivityinelectricalpoweroperation[1].Therole ofidentifyingweakbusesforrenewableenergyintegration has become crucial due to recent increase in renewable energy sources. Renewable based energy sources have been experiencing rapid development all over the world. Renewable sources minimize pollution and reduces excessive dependence on fossil fuels. Wind Power energy has become one of the leading renewable energy sources on a global scale. The rapid growth of renewable energy around the world is partly due to the recognition of their benefits to the environment which has led to the establishment of renewable based policy implementation in most developed countries [2]. The growth of the renewable energy sources around the world makes it necessary to adopt stability analysis for especially load buses to ensure high efficiency and stability. Method for investigating steady-state voltage region was presented in [3]. The stability region was determined by gradually increasing the active power demand on a load bus while monitoring its voltage level. The method provided the active power requirement for a given load connected to a loadbus.However,theanalysis failedtopresentapproach for finding voltage limit for the buses in the electrical powersystem.
Voltage stability analysis for normal and contingency operational grid was introduced in [4]. The analysis deployed active PV curve analysis to investigate voltage limitsforstableoperationofwindenergyintegratedpower grid.Theanalysisconcludedthatthelevel ofloaddemand onthegridincreaseswithanincreaseinwindpenetration andadditionofcompensators. However,principlesbehind the selection of location for both renewable energy and compensator was not discussed. Voltage stability analysis forelectricalpowersystemwithwindenergyconnectedat multiple location was presented in [5]. According to the analysiswindenergyplacedatmultiplelocationswasable toincreasesystemloadabilityandreducerealpowerlosses ascomparedtoasinglelocationinthegridsystem.
Although the multiple location approach seems to be effectiveinimprovingvoltagestabilityofthepowersystem but the identification of the best connection points might prove to be more difficult since a precise analysis for the multiple locations was not highlighted. In most renewable energy integrated systems reactive power compensators are integrated at the weak bus of the electrical power system [4]. In this paper, the approach for extracting the weakbusesofpowersystemispresented.Themethodthat isutilizedinweakorcriticalbusidentificationinthispaper istheP-Vcurvemethod.
The two methods discussed in this paper for voltage stabilityanalysis(VSA)aretheP-VcurveandtheP-QCurve methods.TheP-Vcurvemethodisusedforidentifyingthe weakbusesintheIEEE30bussystem.
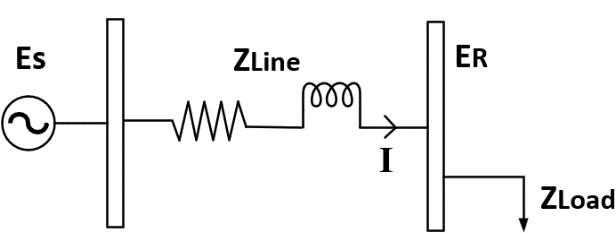
Active power demand at a load bus influences voltage level atthebus.P-Vcurveisutilizedinfindingthevoltage variation at a bus due to active electrical power transfer froma sourcetotheloadbus(Fig.1).Astheloaddemand increases highcurrentistransferred totheload bus while voltage level gradually reduces. Voltage level reduction continuesforexcessiveloaddemandwhichcausesthebus toeventuallytoreachorevenexceeditvoltagelimit.
International Research Journal of Engineering and Technology (IRJET) e-ISSN: 2395-0056
Volume: 09 Issue: 12 | Dec 2022 www.irjet.net p-ISSN: 2395-0072
the collapse margin the more stable the bus or the power system.
Fig1.Schematicdiagramoftwobussystem
Distanceto CriticalPoint
VoltageStability Limit StableRegion
UnstableRegion
The variation of voltage level on a bus due to active power demand also affect the reactive power level on the bus.P-Qcurvegeneratesthelevelofreactivepowerthatis required to be added or absorbed from a bus to maintain thebusvoltage.Asaresult,foreveryactivepowerdemand the corresponding reactive power for the bus is determinedandthisinformationareusedinplottingthePQ curve. The maximum reactive power for a given bus is dependentonpowerfactorofthesystem[7-11].Asshown in Fig. 2b the maximum reactive power maxQ can be determined by finding the intersection of the voltage stability boundary of the P-Q curve and the power factor line.Thedifferencebetweenthe theinitialreactivepower
0Q and maximum reactive power becomes the reactive powermargin.Thevoltagestabilityboundaryisutilizedin findingthevoltagestabilityoperatingregionofa busfora givenvoltagerangeorlimits.
max0 m QQQ (2)
Fig.2.P-VCurveAnalysis
VoltageStability Boundary
Power Factor Line Q Pmax P
Fig.
3 P-QCurvePlotAnalysis
ThecriticalpointasseenontheP-Vcurverepresentthe highest demand that a load bus can contain. As shown in Fig.2aiftheloaddemandexceedsthecriticalpointthebus becomesunstableandthereforeaverysharpvoltagedrop occurs on the load bus [4 6]. As given in equation (1) The difference between the maximum active power demand max P andtheinitialdemand 0P ontheloadbusisreferredto as the active power margin m P . The active power margin can be referred to as the collapse margin. The collapse marginisusedasthevoltagestabilityindicator,thehigher
2.2 Configuration of an IEEE 30 Bus System
AnIEEE30bussystemwithtotalgenerationcapacityof 335 MW and reactive power range of -95 MW and 405.9 MVar is used for the study. The configuration of the IEEE 30 bus sytem is shown in Fig. 3. The total active power demand of the IEEE 30 bus system is 189.2 MW with reactive power demand of 107.2 MVar [6]. The power factor of the system was selected as 0.8. The algorithm employed in the voltage stability analysis is the continuation electric power flow algorithm which is a NewtonRaphson’spowerflowiterativesolution.
International Research Journal of Engineering and Technology (IRJET) e-ISSN: 2395-0056
Volume: 09 Issue: 12 | Dec 2022 www.irjet.net p-ISSN: 2395-0072
Figure3. SchematicDiagramofIEEE30-BusTestSystem
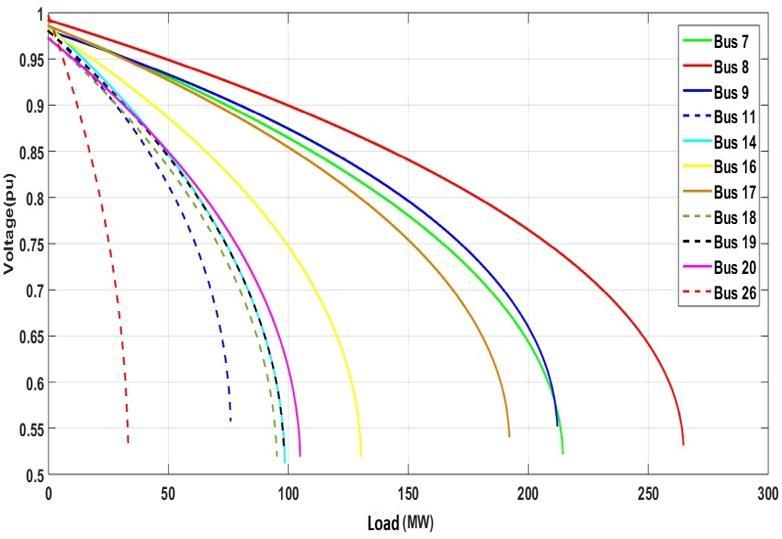
P-V curve for load buses after Newton Raphson continuous power flow simulation is shown in Fig. 4 and Table 1. The P-V curve analysis is conducted only for a certain load bus. Load buses connected directly to generatorbusesareexcludedintheP-Vcurveanalysis.The effectofloadvariationonvoltagestabilityisexaminedonly on load buses with no connection link to a generator bus. As a result, load buses selected for the P-V curve analysis arebus7,8,9,11,14,16,17,18,19,20and26.Bus3,4,5, 6, 10, 12, 15, 21, 24, 25, 28, 29 and 30 are connected to generator bus and are therefore excluded. Difference between the initial active power demand and the maximumpoweronaloadbusisreferredtoasthecollapse margin.Loadbuswithlowcollapsemarginisconsideredas a weak bus. Therefore, load margin of the selected load busesiscomparedtodeterminetheweakbusesintheIEEE 30system.AsillustratedinFig.4andTable1thebuswith the highest load margin is bus 8 with a margin of 234.6 MW. Bus 26 had the least collapse margin with only 29.7 MWwhichmakesitthemostunstableortheweakestload bus.
The weakest bus also called the critical bus can be selected as the optimum connection point for reactive power compensators such as static-var compensators and renewableenergysources[2].
Figure4.P-VCurvePlotsofLoadBusesofIEEE30Bus System
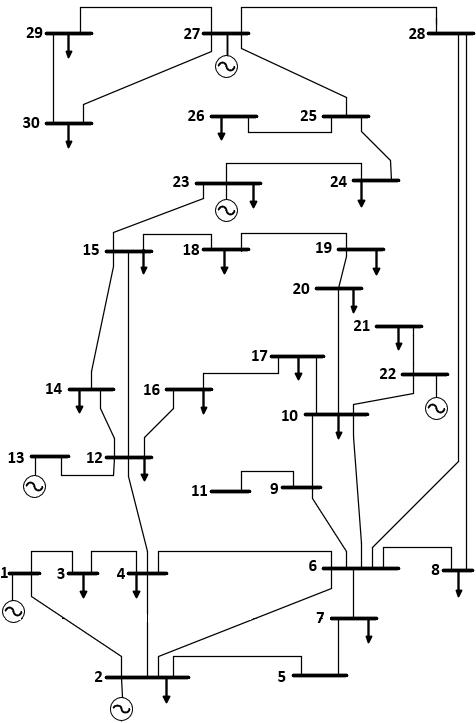
Table1.Maximumdemandandcollapsemarginofload busesofIEEE30bussystem
LoadBus Initial Demand (MW)
Maximum Demand(MW) CollapseMargin (MW)
7 22.80 214.42 191.62 8 30.00 264.60 234.60 9 0.00 212.10 212.10 11 0.00 75.92 75.92 14 6.21 98.53 92.32
16 3.52 130.32 126.80 17 9.01 192.10 183.09 18 3.22 95.22 92.00 19 9.50 98.22 88.72 20 2.20 104.91 102.71 26 3.51 33.20 29.69
Method for identifying weak or critical buses in electrical power system was introduced in this paper. The P-Vcurvemethodwasutilizedinidentifyingtheweak bus by comparing the active power margin of the load buses. Newton Raphson Continuous Power flow algorithm was utilized in carrying out the P-V curve method from which active power demand of a load bus was computed. The active power demand which are also used to compute for thecollapsemarginoftheloadbuseswereusedforfinding the weak or less stable bus. Information on bus stability helps to identify the strong and weak regions of the electrical power system and also to determine the right locationforcompensators.
International Research Journal of Engineering and Technology (IRJET) e-ISSN: 2395-0056 Volume: 09 Issue: 12 | Dec 2022 www.irjet.net p-ISSN: 2395-0072
[1] Y.Chi,Y.Liu,W.WangandH.Dai,“VoltageStability Analysis of Wind Farm Integration into Transmission Network,” International 43Conference on Power System Technology, PowerCon2006,pp.1-7,22-26October2006.
[2] GWEC, “Global Wind Report 2021”, Global Wind Energy Council, 25 March 2021. https://gwec.net/global-wind-report-2021/
[3] Nguyen Tung Linh, "Voltage stability analysis of grids connected wind generators," 2009 4th IEEE Conference on Industrial Electronics and Applications, 2009, pp. 2657-2660, doi: 10.1109/ICIEA.2009.5138689.
[4] BukolaB.Adetokun,ChristopherM.Muriithi,Joseph O. Ojo, "Voltage stability assessment and enhancement of power grid with increasing wind energy penetration," International Journal of Electrical Power & Energy Systems, 2020, ISSN 0142-0615.
[5] I.S.Naser,O.Anaya-LaraandK.L.Lo,"Studyofthe impact of wind generation on voltage stability in transmission networks," 2011 4th International Conference on Electric Utility Deregulation and Restructuring and Power Technologies (DRPT), 2011,pp.39-44,doi:10.1109/DRPT.2011.5993859.
[6] Z. Chen, Y. Hu and F. Blaabjerg, “Stability Improvement of Induction Generator-Based Wind Turbine Systems,” IET Renewable Power Generation,Vol.1,No.1,pp.81-93,March2007
[7] E.CammandC.Edwards,“ReactiveCompensation Systems for Large Wind Farms,” IEEE/PES Transmission and Distribution Conference and Exposition,pp.1-5,21-24April2008
[8] Fritz W. Mohn, C. Zambroni de Souza: Tracing PV andQVCurveswiththeHelpofaCRICContinuation Method, IEEE Trans. on Power Systems, Vol. 21, Nº 3,pp.1115-1122,2006.
[9] Monyei, Chukwuka & Viriri, Serestina & Adewumi, Aderemi & Davidson, Inno & Akinyele, Daniel. (2018). A Smart Grid Framework for Optimally Integrating Supply-Side, Demand-Side and Transmission Line Management Systems. Energies. 11.10.3390/en11051038.
[10] P.Kundur: Power: SystemStabilityand Control, NY: McGraw-Hill,1994
[11] I. K. Otchere, B. Arhin, K. A. Kyeremeh and E. A. Frimpong, "Investigation of Voltage Stability for Transmission Network with High Penetration of Wind Energy Sources," 2020 IEEE PES/IAS PowerAfrica, 2020, pp. 1-5, doi: 10.1109/PowerAfrica49420.2020.9219937.
2022, IRJET | Impact Factor value: 7.529 | ISO 9001:2008 Certified Journal |