International Research Journal of Engineering and Technology (IRJET) e-ISSN:2395-0056

Volume: 09 Issue: 11 | Nov 2022 www.irjet.net p-ISSN:2395-0072

International Research Journal of Engineering and Technology (IRJET) e-ISSN:2395-0056
Volume: 09 Issue: 11 | Nov 2022 www.irjet.net p-ISSN:2395-0072
1M.E. Student, Department of Civil Engineering and Applied Mechanics, Shri G. S. Institute of Technology and Science, Indore, India
2Assistant Professor, Department of Civil Engineering and Applied Mechanics, Shri G. S. Institute of Technology and Science, Indore, India ***
Abstract - The increase in number of vehicles per capita leads to uncertainties in travel time and there is growing worry over traffic management on urban roads. It is getting difficult to manage traffic as traffic influencing events, travel demand and physical feature highly vary travel time. This leads to the problems like congestion and travel time delay. Therefore, there is a need to consider the performance of urban corridors and an effort has been made to examine Travel time reliability. The termtraveltimereliabilityreferred as “dependability or consistency of travel time as measured from various times of the day”. It was found that growth in traffic volume, growth in population and delay are major problems for congestion. Methodslikeplanningtime,planning time index and buffer index are most commonly estimated which provides valuable information about the reliability of urban corridors. The travel time reliability can efficiently be utilized as a method in performance evaluation of traffic stream. The impact of a few other significant traffic characteristics, such as waiting delay and congestion delay, have also been reflected. Here this paper reviews and examinedvarious existingreliability matrices andcongestion matrices. The study thenaddressprocedureforcalculatingthe travel time reliability measures.
Key Words: Travel time reliability, Congestion, Buffer index, Planning time index, travel time index.
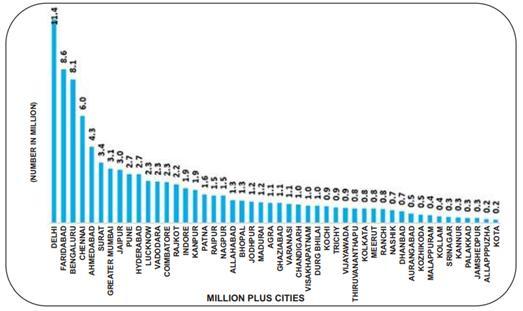
Transportation is the strength of any developing country, and road transport is most common mode of transit. The usage of road transportation increases the number of vehiclesontheroad.India’svehiclepopulationhasexploded with an average growth rate of 9.91% during 2009-2019. Duetothesevastincreaseinnumberofvehiclescitiesofour country becoming congested and which causing delays in traveltimealsocausingincreaseinairpollutionandnoise pollution.InFig-1wecanseeDelhihashighestnumberof registeredmotorvehicles,afterwardFaridabad,Bengaluru, Chennai and Ahmedabad. These five cities accounted for about 40.61% and 41.49% respectively of the total registered vehicles in respect of the reported Million Plus Cities in 2018 & 2019 [1]. For the purpose of evaluating metropolitannetworksandcorridorsfortrafficmanagement and control, travel time has emerged as a critical performancestandard.Traveltimereliabilityisoneofthe
criteria used to assess the quality of traffic service on an urban road. Numerous disciplines, including electronic systems, electrical systems, transportation systems, etc., have researched reliability [2]. As a foundation for the creationofarobustandsustainabletransportationsystem, thisreviewpaperintendstoelaborateonthestateoftheart instrategiestoreducetrafficcongestionontheroads.
Fig -1: TotalRegisteredMotorVehiclesinmillionPlus Cities ason31stMarch,2019(inmillion)
The travel time reliability is an important feature of transportation system performance. Travelers and transportationprofessionalsvaluereliabilityforavarietyof reasons like many transportation system users, whether they are vehicle drivers, transit riders, or others, find it important for on-time performance of the entire transportation system [2]. FHWA defines that the travel time, a fundamental measure in transportation, can be definedasthetimetakentotraversearoutebetweenany twopointsofinterest.Highvariationinreliabilityindicates reduction in the performance of roadway due to traffic influencingeventsandpresenceofphysicalfeatures.These arethereasonstraveltimeforsimilartripatdifferenttimes ofadayoroverthedaybecomeinconsistent.Researchers devisedanumberofmeasurestocapturetheseanomalies [3].Traveltimereliabilitymeasurestheperformanceofan urbanarterial.Inabroadersensereliabilityisanattributeof mobility and congestion. The buffer time measure like planningtime(95%Traveltime),planningtimeindex,buffer time index was introduced as performance indicator. And
© 2022, IRJET | Impact Factor value: 7.529 | ISO 9001:2008 Certified Journal | Page673
International Research Journal of Engineering and Technology (IRJET) e-ISSN:2395-0056
Volume: 09 Issue: 11 | Nov 2022 www.irjet.net p-ISSN:2395-0072
the congestion measure volume, speed and congestion frequencygraphsthesehelpstoviewthevariabilityintraffic condition and find the unreliable period of day [4]. The buffer time indicates the unexpected delays and planning time considers both unexpected delay and typical delay. SharmiliBanikobservesthatallbuffertimemeasureswere able to depict the field condition to a great extent day. Planning time differs by only 0.87% between the sections whereas planning time index differs by almost 40%. This showsthateventhoughthe95%percentiletraveltimesare almost equal, section is more unreliable at this period. Overall,thesemeasuresconnecttothewaydecisionsmade by the travers. Measures like buffer time index has to be cautiously used because of the unstable indication of changes in reliability over time [4]. However, buffer time index has to be cautiously used because of the unstable indication of changes in reliability as it can move in a direction opposite to the mean and percentile-based measures[5].Saptarshisenfindsthatthehigherthevalueof planningtimeindexindicatesunreliablemodeoftransport, asacommuterhastoincludethisextratimewhileplanning their journey time. Once the travel time increases which forces the passengers to shifts their mode from public to private [6]. Aathira K Das finds that to build the priority foundationofimprovementfortheroadonashort-termand long-termbasis,onecancalculatetheTravelspeedIndices values for peak and off-peak conditions and identify the congestion patches along the route for every kilometer of length[7].PagidimarryGopiusedaLicensePlatematching techniqueformeasuringthetraveltimereliabilityinstudy corridor in a study in Delhi city. they identify the requirement of travel time reliability measurement for trafficmanagementofurbancorridorinIndia[2].Reliability is so important for transportation system users; transportation planners and decision-makers should considertraveltimereliabilityakeyperformancemeasure.
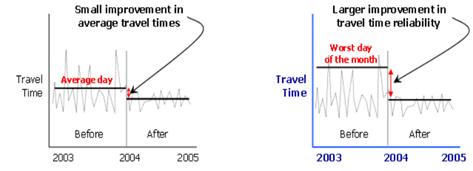
themonth),andthisreliabilityimprovementismuchbetter thantheimprovementinaveragetraveltime.[3]
The measurementoftravel time reliabilityisan emerging practice,yetafewmeasurementsappeartohavetechnical worth and are understandable to non-technical audience. Themajorityoftheseindicatorscomparedayswithalong delay to days with a short delay. The four recommended measuresareoutlinedbelow:90thor95thpercentiletravel time,bufferIndex,planningtimeindex,andthefrequency withwhichcongestionsurpassessomepredictedthreshold. [3],[8]
95th percentile travel time: Itisthe95thpercentiletravel time of the measured travel time of the route it indicates how bad delay will be on heaviest travel days. This is measured in seconds or minutes which can be easily understood by commuters. Users familiar with the route (suchascommuters)canseehowbadtrafficisduringthose fewbaddaysandplantheirtripsaccordingly.Thismeasure has the disadvantage of not being easily compared across trips, as most trips will have different lengths. It is also difficulttocombinerouteortriptraveltimesintoasubarea orcitywideaverage.Severalreliabilityindicesarepresented belowthatenablecomparisonsorcombinationsofroutesor tripswithdifferentlengths.
Buffer index (BI): Buffer index represents the extra time that most travelers add to their average travel time when planningtripstoensureon-timearrival.Thistimeisadded to account for unexpected delay. It is expressed in percentage.Buffertimeindexissignifiedasfollows:
Buffertime=95thpercentiletraveltimeforatrip–averagetraveltime
Or BI=
Planning time index (PTI): Planningtimerepresentsthe totaltraveltimethatshouldbeplannedwhenanadequate buffertimeisincluded.Itistheratioof95thpercentiletravel timetofreeflowtraveltime.
InFig-2two-linecharts,eachdepictingdailytraveltimeover two-year period, with first year representing travel time beforeatrafficmanagementimprovementandthesecond year representing travel times before traffic management improvement. In first chart, the improvement in average travel times is shown, and this improvement in average traveltimeisquitesmall.Insecondchart,theimprovement intraveltimereliabilityisshown(basedontheworstdayof
Toend,thedelaybroughtonbyridingpublictransportation also serves to demonstrate reliability. The dependability decreases as the delay increases. Planning time index Is signifiedasfollows:
PTI=
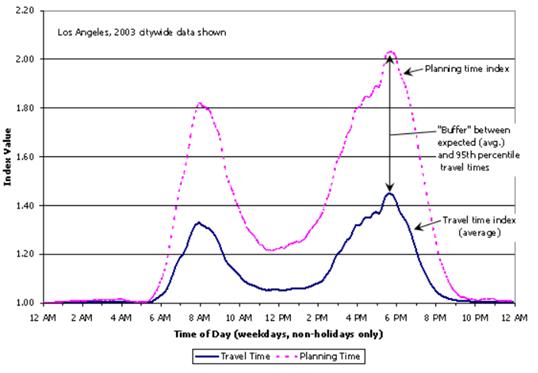
These metrics which are discussed above are straight forwardtocomprehend,andtheyaresimpletocalculate.Fig
© 2022, IRJET | Impact Factor value: 7.529 | ISO 9001:2008 Certified Journal |
International Research Journal of Engineering and Technology (IRJET) e-ISSN:2395-0056
Volume: 09 Issue: 11 | Nov 2022 www.irjet.net p-ISSN:2395-0072
3showstherelationshipbetweenthetraveltimeindex,the bufferindex,andtheplanningtimeindex.Thetravel time index represents the average additional time required duringpeaktimesascomparedtotimesoflighttraffic.The bufferindexrepresentstheadditionaltimethatisnecessary abovetheaveragepeak travel time,whereas theplanning time index represents the total travel time that is necessary.[3]
1.4.1 Recurring congestion- Inthemajorityoflargecities, trafficiscongestedeverydayduringpeakhours.According to FHWA, around half of the congestion that traffic users encounterisrecurrent.Thefollowingaretypicalcausesof recurringcongestion:
I. BottleneckandCapacity:Bottleneckaretheprimary source of congestion. When more lanes are converging on a road, bridge, or tunnel than these facilities can accommodate during peak flow times, bottlenecks develop. It may also happen if a road's capacityisexceededbydemand.Anyroad'scapacity tellsyouhowmuchtrafficitcansupportatitspeak. Capacitymaybeaffectedbyquantityandbreadthof lanes,thedistancerequiredtomergeatinterchanges, andtheorientationoftheroad.
II. Lack of infrastructure: One of the main causes of congestion,particularlyindenselypopulatedplaces, isalackofinfrastructure.Thenumberofautomobiles likewiserisesalongwiththepopulationgrowthrate. Congestionariseswhentheavailableinfrastructure cannotaccommodatethegrowingnumberofcars.
Fig-3: Reliabilitymeasuresarerelatedtoaveragecongestion Measures
Lastly, the reliability is also indicated with the help of the delay caused by travelling in public buses. The more the delay,thelessisthereliability.Thedifferenttypesofdelay focussedinthispresentstudyareasfollows:[9]
I. SignalDelay:Thevehiclestoppingwithinadistanceof 100 m from the ‘stop’ line under the influence of signal which incurs the delay in the travel time is termedassignaldelay.
II. Bus Stop Delay: These delays are attributed to boarding and alighting of individual passengers at specifiedbusstopsonly.
III. WaitingDelay:Thisincludesanyextradelayoccurred duetounnecessaryhaltatemptystoppages.
IV. CongestionDelay:Anydelaycausedbythecongestion createdduetothehugevolumeoftrafficduringthe peakhours
Urban or metropolitan regions may have congestion for a numberofcauses,includinghighdemand,signals,incidents, workzones,weather-relatedfactors,orspecialevents.Road trafficcongestionmaytypicallybesplitintotwotypes,based onavarietyofprimaryreasons.[9]
III. Variation in traffic flow: Because daily traffic demandsvarydaytodayresultsinhighervolumein somedaythanother.A delaycouldhappenifthese variabledemandsexceedthesetcapacity.
IV. Poorlytimedsignalsortrafficcontrollerdesigns,such as stop signs, speed bumps, or train crossings, can obstructaregulartrafficflow,causingcongestionand traveltimevariations.
1.4.2 Nonrecurring congestion- non-recurringcongestions typicallyhappenedasaresultofunexpectedcircumstances, suchastrafficaccidents,constructionzones,badweather,or otheruniquesituations.Nonrecurringcongestioncancause freshcongestiontostartupduringoff-peaktimesandcan alsolengthenthetimeittakesforrecurringcongestion to clear.Examplesoftypicalnon-recurringcongestioninclude [9],[10]
I. Vehicleaccidents,breakdowns,anddebrisinthelanes oftravelarethemostfrequenttypesoftrafficevents. These incidents interfere with the regular flow of traffic,typicallybyobstructingthelanes,whichfurther reducescapacity.
II. Work zones: Work zones are areas where there are constructionprojectstakingplacethatwillphysically alterthesurroundingsoftheroute.Thesemodifications resultinchangestothenumberorwidthoftravellanes, lane "shifts," lane diversions, the elimination or decreaseofshoulders,andmomentaryclosuresofthe road.
© 2022, IRJET | Impact Factor value: 7.529 | ISO 9001:2008 Certified Journal | Page675
International Research Journal of Engineering and Technology (IRJET) e-ISSN:2395-0056
Volume: 09 Issue: 11 | Nov 2022 www.irjet.net p-ISSN:2395-0072
III. Weather:Variationsintheoutsideenvironmentorthe weathercanhaveanimpactontrafficflowanddriver behavior.Thesecouldalterthewayroadsarebuilt,as wellastrafficcontroldeviceslikesignalsandrailroad crossings.About28%ofallhighwaycrashesand19% of all fatalities are caused by weather-related road conditions.Additionally,extremewindgusts,torrential rain,orsnowcanhaveanimpactonbothvehiclespeed andvolume.
IV. Other exceptional events: These events call for modificationsintrafficflowthatoftendeviatefromthe typicalflowpattern.Theseoccasionscouldbeconcerts, sportinggames(gamedays),orothersocialgatherings. During special occasions, a sudden increase in traffic demand might overload the infrastructure and cause congestion.
Congestion measures are used to evaluate transportation networkperformanceandidentifyissueregions.Theycan define how well the system achieves its stated aims and objectives,aswellasexplaindifferencesinuserexperiences. Delay,riskofdelay,meanspeed,journeytime,andvehicle hours travelled are some of the factors that indicate how longusersarestuckintraffic.othermeasurements,suchas thevolume-to-capacityratio,whichiscommonlystatedasa levelofservice,showhowwellthesystemisperformingata givenplace[11].Aspartofanoverallperformanceprogram theFHWA[5]encouragesagenciestoconsidertraveltime experienced by users as a source for congestion measurementinadditiontoothermeasures.theyalsoclaim thatpresentcongestionmeasurementsareinsufficientfor evaluating the true impact of congestion on the transportationssystemfromtheperspectiveofusers, and thattheyareunabletoadequatelymeasuretheimpactsof congestionmitigationtechniques(Bureauoftransportation statistics). Numerous congestion measures have been devisedtakingintoaccountvariousperformanceparameters in order to assess the level of congestion. Congestion measuresare(i)speed,(ii)traveltime,(iii)delay,(iv)level ofserviceand(v)congestionindex.Table-1illustratethese categories. Improving traffic management and control requiresmeasuringthelevelofcongestion[9].
Speed Travel Time Delay Level of service Speed Federal
Average speed Travel rate Delay rate Delay ratio
Volume to capacity ratio (V/C)
Congestion index Travel time index Planning time index
Improving traffic management and control requires measuring the level of congestion. The real conditions of traffic on the roads have a significant impact on the subsequent decision-making processes towards a sustainable transport system. In order to create a transportationsystemthatisresilientandsustainable,the assessment method used to determine the severity of the congestionshouldbefeasiblefordecision-makerstouse.
Inthestudyoftraveltimereliabilityandcongestionfirstly weneedtochooseappropriatemeasureunderIndianTraffic conditionforselectedstudycorridor.Datacollectionismain part of any study so it is important to find methods for gatheringdataandcreateatimelineplanfordoingso.Data collection mainly includes Traffic Volume, Travel Time, Average Speed etc. Data can be collected by Intelligent Transport System (ITS), GPS and surveys. Three different typesofsurveys thespeedanddelaystudy,trafficvolume count survey, and vehicle license plate survey have been conducted to assess the operational effectiveness of the chosen urban corridor. Numerous performance measurementswererecorded,anddevelopmentsintraffic datagatheringtechnologyproducedenormousamountsof datainbothreal-timeandhistoricalsettings.Thenwecan Calculate reliability measures - 95th or other percentile traveltime,Bufferindex–Evaluationofbufferindexforeach roadandeffectofnon-motorizedvehicleonbufferindexis studied,Planningtimeindex-studyisdoneontheimpactof non-motorizedvehiclesontheplanningtimeindexandthe evaluationoftheplanningtimeindexforeachroad.Thetime modelisinfluencedbydifferentparameters.Oneofthemost important variables is speed. Distance is another main variable for determination of travel time, meanwhile increase in length of segment will obviously increase the traveltime.Modelhasbeendevelopedusingsoftwarelike SPSS, VISSIM, Excel etc. for statical analysis, micro simulation, Regression analysis linear or multiple. At last development of travel time reliability models using parametersaffectingcongestionisdoneandthenvalidated themodelinselectedstudycorridorusingappropriatetests t-test,ANOVAtest,chi-squaretestetc.butinSPSSsoftware’s has been limited up to maximum 1500 cases and 50 variablesandwhenlimitexceedsyouhavetocreatenewfile.
ThissectioncoverliteraturerelatedtoTraveltimereliability measuresoftransportationandcongestiondelayandhow reliabilityparameterscanbeadoptedforcomputingtravel timedelayforurbancorridors.Thedetailedliteraturehas beendiscussedbelow.
(Sharmili Banik, et al. 2021), have done a case study of Chennaicityforbetterunderstandingandrepresentationof
International Research Journal of Engineering and Technology (IRJET) e-ISSN:2395-0056
Volume: 09 Issue: 11 | Nov 2022 www.irjet.net p-ISSN:2395-0072
applicability of travel time reliability measures. For this purpose,datahasbeencollectedforonemonthperiodusing GPS fitted on buses that are operated in study corridor. AuthorcomparedvariousstaticalrangemeasureslikeBuffer time, Tardy trip, Probabilistic and Congestion measures. Fromthemeasureandfindingtheyobservedthatmanyof themeasuresgivedifferentreliabilityindications.[4]
(Ahmed Hassan Mohamed, et al. 2021), in this paper author focuses on the elements that influence travel time reliability of bus transport. Travel Time was used as the dependentvariable,whileelementsdiscoveredduringdata collections that appeared to affect bus travel time dependability were used as independent variables to determine factors affecting travel time reliability. ANOVA wasusedtoanalyzethedifferenceamonggroups.Thiswas followed by more in-depth examination utilizing the SPSS statical software. Travel Time is strongly affected by the numberofbusstoppings,lengthoftheroute.Thereliability ofallroutesduringtheweekdayislowbecauseofdelaysin departure.Thenumberofsignalizedintersectionsalongthe route affects reliability. Meanwhile, more passengers boarding and paying cash increased the travel time reliabilityofbuses.[12]
(M.M. Harsha, et al. 2021), heretravel timevariability is investigated by utilizing travel time distribution that accounts various temporal and spatial aggregation.travel time distribution is evaluated with regard to temporal aggregations (peak period, off-peak period) and spatial aggregations (route level and segment level) using AutomaticVehicleLocationdatafromfourtransitroutesin Mysore City, Karnataka, India. The findings of route and segmentlevelstudyshowthatthegeneralizedextremevalue distributionhasthehighestaccuracyandrobustnessvalues. The distribution has been shown to be superior in characterizingpublictransittriptimevariability.[13]
(C. P. Muneera, et. al. 2020),hereinthispaperauthortakes travel time index formeasurementofreliability for urban roads.Statisticalmeasuresoftraveltimeindexofeachroad arecalculatedforreliabilityestimation.Authordevelopeda modelfortraveltimeindexwithtrafficflowratetopredict the travel time reliability. This paper also focuses on proposinglevelofservicecriteriausingtraveltimereliability measure. The results obtained will be useful for traffic managementandplanning.[14]
(Saptarshi Sen, et al. 2019),didthestudytodeterminethe traveltimereliabilityofvariouspublictransportationmodes along a specific route in the Kolkata city. The state governmentbus,privatebusandminibusin-vehiclejourney timereliabilitywereestimatedandthenresultsiscompared tometrorailway.Accordingtothefindings,thejourneytime reliabilityofallbuskindsrangesfrom45to65percentof the metro railway’s reliability. The parameters such as Buffertime,BufferIndex,planningtimeandPlanningtime index,werealsoestimated,providingusefulinformationon
thebusreliability.Othersignificanttrafficparameters,such ascongestiondelayandwaitingtimedelay,havealsobeen explored in relation to reliability. According to delay measurement,Resultsshowsbusesexperienceahighsignal andcongestiondelayduringpeakhours.[6]
(Anish Kumar Bharti, et. al. 2018), authorillustrateshow travel time reliability can be used to quantify the level of service (LOS) for urban arterial and inter-urban highway corridors on Indian roadways. Automatic vehicle license plate number data were gathered using the TrafficMonitoringsystemtoestimatetraveltimes.Theyfully usevideo-basesystemtoanalyzewhichissetinentryand exitofthesection.Accordingtothefindingsofthetriptime analysis, the urban uninterrupted and intercity highway routes'respectivePTIthresholdsforLOSBwere1.37and 1.01respectively.Thissuggeststhattheurbanuninterrupted studyroutehasa1.37-timeslongertraveltimethanthefree flowcorridor.[15]
(Pagidimarry Gopi, et. al. 2014), author did research to assessthetraveltimereliabilitymeasuresofanunbroken urban arterial corridor in the Delhi Road network during peak and non-peak hours. Various existing travel time reliabilityindicesarestudiedandexaminedinordertodo this. The benefit of travel time reliability is that it can be utilized as a new evaluation technique in performance evaluationandastraveltimerelatedinformationtosystem users.Planningtimeindex,PlanningTime,andBufferTime Indexareamongthereliabilitymeasurementsinvestigated. Thefindingsshowthatdependabilitymeasuresarebetterin assessingtheeffectivenessofurbanarterialcorridors.[2]
(Ravi Sekhar, et. al. 2013), the author aims to study the reliability of travel time under the influence of various demandandsupplysidecomponentsinthetransportation system. For one week, data on traffic volume, speed, and travel time were collected in order to assess travel time reliability on study corridor and calculated relevant reliability metrics. A microscopic traffic simulation model was constructed using VISSIM software to investigate the influence of various demand and supply side variables on trip time reliability. The created simulation model was successfully tested with observed data, and the study revealedthattimeincreasesby5.3and6timesforscenarios ofa50%increaseindemandandalaneclosureforaround 30minutes,respectively.[16]
(Srinivas S. Pulugurtha, et. al. 2010),hereauthordesign anddemonstratehowamethodologyforestimatingjourney timeand fluctuations, travel delayindex owing tocrashes andtheirseverity,congestionscore,andnetworkconnection reliabilityworks.Thecomputationstakeintoaccounttraffic volume, link capacity, travel speed, collisions and their severity, and the projected time it takes for normal traffic conditions to return after a crash. Because travel demand and crash occurrence vary depending on the time of day, temporalchangesintraveltimeandcrashesforeachlinkare
© 2022, IRJET | Impact Factor value: 7.529 | ISO 9001:2008 Certified Journal | Page677
International Research Journal of Engineering and Technology (IRJET) e-ISSN:2395-0056
Volume: 09 Issue: 11 | Nov 2022 www.irjet.net p-ISSN:2395-0072
alsoinvestigated.Sensitivityanalysisisalsousedtotestand evaluatethereliabilityoflinksbasedonweightfluctuations to integrate recurrent and nonrecurring congestion components.[17]
(Tanzina Afrin, et al. 2020),hereauthorreviewscurrent road traffic congestion measures like speed, travel time, delay,levelofservice,congestionindices,federalapproach. Thesecongestionmeasurecomparedusingareal-timetraffic trackerdataset.Theanalysisofcongestionwasperformed daily and weekly. The weekly research revealed a little variationinpeak congestion periodsfromdaytoday.The data analysis reveals the pros and downsides of each measure.Thispaperreviewscurrentroadtrafficcongestion measurements and offers helpful suggestions for the constructionofalong-termandrobusttrafficmanagement system.[9]
(Ashwini Thakare, et. al. 2020), in this paper author envisioned a possible approach to reduce delay. The geographical spread (Origin & Destination) pattern for Nagpurisbeingdevelopedforthestudy.Vehiculartracking system is used for identifying possible delays. The study used questionnaires, GIS, observation techniques. The resultswillquantifytheelementsthatcausesdelaysintravel alongacertainroute.Dependingonproblemsolutionswill helps in reducing congestion and queue length, results in lesser fuel consumption and also less cost of transportation.[14]
(Satya Ranjan Samal, et. al. 2020), author aims to investigate and assess the possibility of using a modeling technique to predict congestion indices under heterogeneoustrafficcondition.Videographicdata,traffic volume and travel time was measured in peak hours congestionindicesareevaluated.Authormainlyfocusseson congestionintermsoftraveltimereliabilitymeasurements to determine the operational effectiveness of urban road network. From result it is found that travel time and congestion indices varied according to vehicular composition.[8]
(Roshani Dhapudkar, et. al. 2018),inthisauthorlooked intotrafficparametersincludingspeed,flowanddensity,as well as the relationship between them. The videographic data were captured from traffic stream and analyzed it to lookatkeytrafficmetricsincludingspeed,flowanddensity. It is found that traditional traffic stream equations are insufficientfortheseheterogeneoustrafficflows.Asaresult, wellneedtodeviseanewequationtoaccountfortheIndian scenariosheterogeneoustraffic.Theydiscoveredthetraffic stream parameters after a thorough investigation. They obtaina standard relationshipbetween the parameters of thetrafficstream.[18]
(Sourabh Jain, et. al. 2017), did their research to better understand congestion on urban arterial and sub arterial havingheterogeneoustrafficcondition.Thepredictedtravel
time for a journey is calculated using sectional traffic characteristics(flowandspeed)attheoriginanddestination points of road segments, as well as other highway and segmenttrafficvariablessuchasdiversionroutes.Usinga congestionindex,predictedjourneytimeiscombinedwith freeflow timetodetermine thestateofcongestiononthe segments. This type of advancement could aid with the comprehensionoftraffic.[19]
(Aathira K Das, et. al. 2016), did research to make a concertedefforttoaddresstrafficcongestionmeasurement usingV-Boxtripspeedprofiles.Despitethefactthatthere are variety of traffic congestion measures, there is still a needforasimpleandeffectivemannerofpresentingtraffic congestiononenroutesegments.M-TCMtrafficcongestion model,whichismulti-linearregression,isusedtocalculate the congestion condition along a route. Traffic congestion Index, the model’s output, serves as the foundation traffic qualityperformance,allowingtrafficengineerstotakethe necessary actions to minimize Traffic Congestion Index values by implementing appropriate traffic engineering solutions.[7]
The current study focused on Travel time reliability and congestionmeasuresforurbanroadsunderheterogeneous traffic condition. Additionally, the FHWA Report 2006's reliability measures like buffer time, buffer time index, planningtimeindexandplanningtimewereappliedhere. Traveltimereliabilityandcongestionmeasurementcriteria can be adopted based on speed base or travel time base matrices. For a road length, daily and weekly analyses of congestionwereconductedinpeakandoff-peakhoursofthe day.InIndia,traveltimereliabilityisnotusuallyconsidered toevaluatetransportationplanningorcorridorperformance evaluation.Thiscompressivereviewfocusondemonstrating the value of travel time reliability and its significance for Indianurbanroads.
This study identified the requirement of travel time reliability measurements for measuring performance of urban roads in traditional measures. The following Conclusionscanbeobtainedfromtheliterature:
1. Thestatisticalindicatoroftraveltimereliability,the traveltimeindexexhibitsapositiveexponentialrise with traffic flow rate. This analysis forecasts how muchtraveltimepassengerswouldneedtoarriveon timeatvarioustrafficflowratesonurbansinglesin heterogeneoustrafficconditions.
2. It is observed that many of the measures give different reliability indications. This may be due to the fact that some measures use non-robust characteristicsofthetraveltimedistribution.
© 2022, IRJET | Impact Factor value: 7.529 | ISO 9001:2008 Certified Journal | Page678
International Research Journal of Engineering and Technology (IRJET) e-ISSN:2395-0056
Volume: 09 Issue: 11 | Nov 2022 www.irjet.net p-ISSN:2395-0072
3. Itwas notedthat thereis goodagreement between standard deviation, percent variation, width, buffer time,planningtime,miseryindex,andfrequencyof congestion with reference to the dependability condition.Thesemeasurementsdomatchquitenicely withoneanother.
4. On-timearrivalandUnreliabilityIndexdonotagree well with the other measurements or each other. It simply displays a linear connection, If the measurements are connected nonlinearly, this will notindicatethat.
5. Thestudyoftraveltimereliabilitywillbehelpfulfor roadplanningandtrafficparametersmanagementto reducetrafficjamdensityandincreaseflowofroad.
6. This will be helpful for identifying various factors responsiblefordelays.
7. After studying Travel Time Reliability measure, we caneasilyfindmaximumdelayandflowdelay.
8. Itwillbebeneficialforfindingthecongestionpatches alongtherouteforeverykmoflengthtodevelopthe prioritybasisofimprovementfortheroute.
9. Thisstudypredictsallocationsoftraveltimeforthe usersforon-timeperformanceatdifferenttrafficflow rate on urban roads under heterogeneous traffic condition.
[1]“RTYB-2017-18-2018-19”.
[2]P.Gopi,S.N.Sachdeva,A.K.Bharati,andE.-A.Professor, “Evaluation of Travel Time Reliability on Urban Arterial.” [Online].Available:www.ijert.org
[3] “Travel Time Reliability: Making it there on time,” Federal Highway Administrartion, 2017. https://ops.fhwa.dot.gov/publications/tt_reliability/ttr_repo rt.htm(accessedNov.17,2022).
[4] S. Banik, A. Kumar, and L. Vanajakshi, “Travel Time Reliability,”inInternationalEncyclopediaofTransportation, Elsevier, 2021, pp. 109–121. doi: 10.1016/b978-0-08102671-7.10318-5.
[5]“TravelTimeReliabilityImplementationfortheFreeway SISFinalReport,”Florida,2010.
[6]S.Sen,T.Chowdhury,A.Mitra,andS.K.Roy,“Assessing Travel Time Reliability of Public Transport in Kolkata: A CaseStudy,”inLectureNotesinCivil Engineering,vol.34, Springer,2019,pp.21–34.doi:10.1007/978-981-13-71622_3.
[7]A.K.Das,K.Saw,B.K.Katti,M.T.Student,P.D.Scholar, andV.Faculty,“TrafficCongestionModellingwithReference to Speed Profiles under Mixed Traffic Conditions: A Case Study of Surat Corridor.” [Online]. Available: www.grdjournals.com
[8] T. v Mathew, G. J. Joshi, N. R. Velaga, and S. Arkatkar, “LectureNotesinCivilEngineeringTransportationResearch Proceedings of CTRG 2017.” [Online]. Available: http://www.springer.com/series/15087
[9]T.AfrinandN.Yodo,“Asurveyofroadtrafficcongestion measurestowardsasustainableandresilienttransportation system,”Sustainability(Switzerland),vol.12,no.11.MDPI, Jun.01,2020.doi:10.3390/su12114660.
[10]M.Baykal-Gursoy,A.R.Benton,P.C.L.Gerum,andM.F. Candia, “How Random Incidents Affect Travel-Time Distributions,” IEEE Transactions on Intelligent Transportation Systems, vol. 23, no. 8, pp. 13000–13010, Aug.2022,doi:10.1109/TITS.2021.3119024.
[11]K.LymanandR.L.Bertini,“Usingtraveltimereliability measurestoimproveregionaltransportationplanningand operations,”TranspResRec,no.2046,pp.1–10,2008,doi: 10.3141/2046-01.
[12] A. H. Mohamed, I. A. I. Adwan, A. G. F. Ahmeda, H. Hrtemih,andH.Al-Msari,“IdentificationofAffectingFactors ontheTravelTimeReliabilityforBusTransportation.”
[13] M. M. Harsha and R. H. Mulangi, “Probability distributionsanalysisoftraveltimevariabilityforthepublic transit system,” International Journal of Transportation Science and Technology, 2021, doi: 10.1016/j.ijtst.2021.10.006.
[14] T. v Mathew, G. J. Joshi, N. R. Velaga, and S. Arkatkar, “LectureNotesinCivilEngineeringTransportationResearch Proceedings of CTRG 2017.” [Online]. Available: http://www.springer.com/series/15087
[15]A.KumarBharti,C.RaviSekhar,andS.Chandra,“Travel timereliabilityasalevelofservicemeasureforurbanand inter-urbancorridorsinIndia.”
[16]R.S.ChalumuriandS.Gangopadhyay,“Analysisoftravel timereliabilityofanurbancorridorusingmicrosimulation techniques Nanoenergetic materials View project
EVALUATION OF ECONOMIC LOSS DUE TO IDLING OF VEHICLES AT SIGNALIZED INTERSECTION AND MITIGATION MEASURES (ELSIM-ESC0204) View project,” 2015. [Online]. Available: https://www.researchgate.net/publication/280557062
[17]S.S.Pulugurtha,M.Asce,andN.Pasupuleti,“Assessment ofLinkReliabilityasaFunctionofCongestionComponents”, doi:10.1061/ASCETE.1943-5436.0000156.
© 2022, IRJET | Impact Factor value: 7.529 | ISO 9001:2008 Certified Journal | Page679
International Research Journal of Engineering and Technology (IRJET) e-ISSN:2395-0056 Volume: 09 Issue: 11 | Nov 2022 www.irjet.net p-ISSN:2395-0072
[18] R. Dhapudkar, V. S. Ghutke, Y. Gajare, and A. Prof, “AnalysisandModelingofHeterogeneousTrafficinNagpur City(Nh-07).”
[19] S. Jain, S. S. Jain, and G. Jain, “Traffic Congestion Modelling Based on Origin and Destination,” in Procedia Engineering, 2017, vol. 187, pp. 442–450. doi: 10.1016/j.proeng.2017.04.398.
© 2022, IRJET | Impact Factor value: 7.529 | ISO 9001:2008 Certified Journal | Page680