International Research Journal of Engineering and Technology (IRJET) e-ISSN:2395-0056

Volume: 09 Issue: 11 | Nov 2022 www.irjet.net p-ISSN:2395-0072
International Research Journal of Engineering and Technology (IRJET) e-ISSN:2395-0056
Volume: 09 Issue: 11 | Nov 2022 www.irjet.net p-ISSN:2395-0072
1PG
2Professor
Abstract - The present study was undertaken with an aim to study the Hydrological and Water Quality parameters of the Doni River Basin using SWAT Model. For model application, the Basin area was divided into 7 sub-basinsand15HRUs.TheBasincomprisesmainlyof6 landuse(withmorethan85%agricultureareacoverage). Afterthesuccessfulexecutionofthemodel,for20yearsit shoes that evapotranspiration and potential evapotranspirationofstudyareawasfoundtobe195mm and402mmrespectively.Afterthesuccessfulexecutionof the model, it shows the sediment yield to be highest in SeptemberandOctobermonthsthetotalsedimentloading was found to be 1.86Ton/ha. The Average annual basin values of nutrients like Organic N, Organic P, NO3 yield, NO3inrainfall,OrganicPinSoil,andOrganicN inSoilare themainroleinthewaterqualityissues.SWATmodelwas simulated for the period of 20 years (year 1998–2018) and the correlation coefficient was found out to be 0.80, which shows the good relationship between rainfall and runoff values. Available hydrological data (i.e. from 19982018) was split into two groups for calibrating and validating parameter of the model (1996 and 1997 was takenaswarmupperiods).
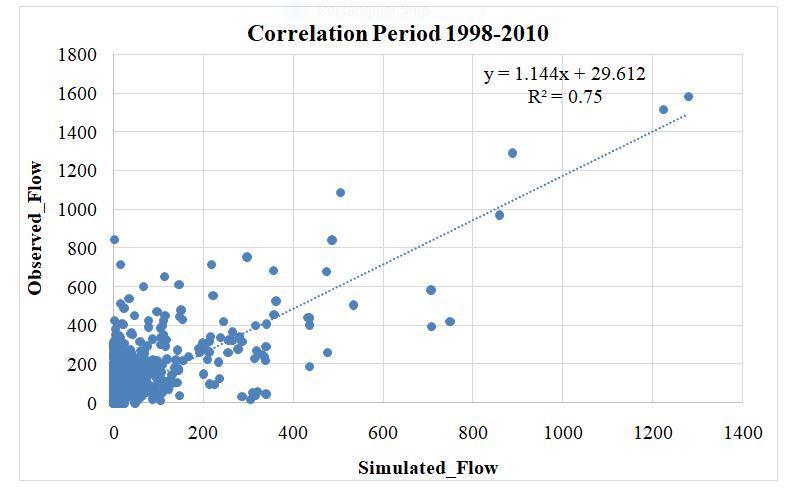
ThemodelwascalibratedatTalikotegaugingsiteondaily basis time scale. The model was auto-calibrated and validated using SWAT cup SUFI-2 software. Model performance was analyzed based on quantitative statistical analysis and visual comparison between observed and simulated flows. Nash and Sutcliffe Efficiency (NSE) and R2 was taken as the main objective function during calibration and validation. The average daily calibration and validation showed good model response with NSE of 0.71 and 0.78 respectively. The coefficient of determination (R2) for daily calibration and validation was 0.75 and 0.80 respectively. Overall, the model in simulating streamflow at Talikote gauging site can be rated as very good and the calibrated model could be used for runoff simulation for this agriculture dominatingwatershed.
***
The Soil and Water Assessment Tool (SWAT) model (Arnoldetal.,1998)isacontinuous,longterm,distributed parametermodelthatcansimulatesurfaceandsubsurface flow, soil erosion and sediment deposition, and nutrient fate and movement through watersheds. SWAT has been applied worldwide for hydrologic and water quality simulation. SWAT, developed by Agricultural Research ServicesofUSDA,hasgainedpopularityintherecentpast, witnessing continued refinement and is being used in the present study to quantify basin runoff. SWAT is a hydrological model functioning on a time step of daily or monthly. Today, SWAT is widely used to assess the environmental impacts of land use on water quantity and quality in small agricultural fields to continental-size watersheds with varying soil types, topography and land uses. Furthermore,SWAT,beingacontinuoustimemodel, is capable of simulating periods ranging from 1 to 100 years, providing output on daily, monthly or annual time scales.SWATmodelhasbeenappliedtodifferentbasinsof India for simulating runoff and sediment yield and the results have been found to be reasonably satisfactory. The Doni River is the important tributary to Krishna River,it joins theKrishnato the southwest of the town ofTalikote atthedownstreamoftheAlmattidam.Suddenflashfloods occur in the rainy season near Katnalli and Basavana Bagewadi.Itispronetoirregularfloodingandwaterisnot suitable for use even for washing. Hence, SWAT model is used to estimate the Hydrological and Water Quality parameters and also, Model calibration and validation were conducted through sensitivity analysis and uncertainty analysis using the SUFI-2 algorithm in SWAT CUP.
Hydrological modelling can be defined as the characterization of real hydrologic features and system by
International Research Journal of Engineering and Technology (IRJET) e-ISSN:2395-0056
Volume: 09 Issue: 11 | Nov 2022 www.irjet.net p-ISSN:2395-0072
the use of small-scale physical models, mathematical analogues, and computer simulations. Hydrologic modeling is used to answer environmental transport questions where water excess, scarcity, or dissolved or solid content is of primary importance. Because of the nature of environmental predictions, there is no singlebestmodel.
Precipitation, runoff, Soil loss are some of the parameters that play an important role in deciding the status of the watershed.Inaddition,thesestudiesmustbeconductedto implement the watershed management practices. The objectivesofthepresentstudyis;
Tosetuphydrologicalmodelforstudyarea.
To Estimate Runoff using daily rainfall data for different sub basins of Doni River basin using SWAT.
Arnold et al., (1998) SWAT model was used to estimate thesedimenttransportation,erosionofsoilandhydrology in Trinity River basin located at Texas that is RichlandChambers watershed. Necessary input data’s are being arrangedtothemodel bytheuseofGISinterface.Efficient use GIS interface for SWAT model for data management andcollection.Fromthisstudyitisunderstoodthat,SWAT predicts stream flow, soil erosion and sediment transportation.
Manguerra et al., (1998) SWAT model is been used in Animal Science (3.28 km2), Greenhill (113.8 km2) and Camp Shelby watersheds. In this study, hydrologic response units concept is adopted which is sufficient to representspatialvariabilityintheriverbasin.Inthisstudy, division of watershed can be done in presence of site specific water impoundments. Improved runoff is predictedthroughrelativeeasyandautomatedreturnflow tostreamflow,curvenumberswithspaceandtime.
To calibrate and validate the model for monthly timestep.
Toassesshydrologicalandnutrientcomponentin thestudyarea
To study rainfall runoff relationship in the study area.
Arnold et al., (1995, 1996), Neitsch et al., (2001) SWAT (Soil and Water Assessment Tool) model was developed for the watershed. It is physical based model i.e. related with movement of sediment and water, growth of crop and nutrient cycling. It predicts runoff, sediment yield, chemical yield, impingement of managing land on water and vegetal land over varying soils. It is continuous time simulatedmodel.
Bingner (1996) SWATmodelwasusedforGodwinCreek Watershed which is located in northern Mississippi for a period of 10 years. SWAT predicts runoff of various watershed or basins over period of time. The study gave thesensibleresultsinwhichindividual stormsimulations were lesser than those of storms aggregating on annual basis. This study states that SWAT accuracy can be increased if sub basins are split into various sub basins which resulted into increased variance in vegetative land coverandsoil.
King et al., (1999) SWAT model is used to evaluate “SCS daily curve number and Green-Ampt Mein-Larson” methods which simulates excess rainfall on river basins with multiple rain gauges. In this study, SWAT is modified toobtainbreakpointrainfalldataandroutestreamflowon daily time basis for Green-Ampt method. This study reportsthatthereisnoimportantadvantagecanbegained by the use of point of discontinuous rainfall and routine timebasiswhileevaluatingthelargebasins
M. P. Tripathi, R. K. Panda, N. S. Raghuwanshi2 and R. Singh(2004) The Nagwan watershed of Upper Damodar Valley situated in Hazaribagh District of Bihar State in eastern India was selected for the study. The watershed has a drainage area of 92.46 km2 Model simulated monthly rainfall for the period of 18 years was compared with observations. Simulated monthly rainfall, runoff and sediment yield values for the monsoon season of 8 years (1991–1998) were also compared with their observed values. In general monthly average rainfall predicted by the model was in close agreement with the observed monthly average values. Also, simulated monthly average values of surface runoff and sediment yield using generated rainfall compared well with observed values during the monsoon season of the years 1991–1998. The model performance was also evaluated for the monthly averagevaluesofrainfall,runoffandsedimentyieldforthe monsoon season of the years 1991 to 1998 Mean rainfall109.78mm sediment yield during monsoon season- 4.09 t/ha
Kangsheng Wu, Carol A. Johnston(2007) Objective to compare the effects of calibrating the Soil and Water Assessment Tool (SWAT) watershed model with different
International Research Journal
Engineering
Technology (IRJET) e-ISSN:2395-0056
Volume: 09 Issue: 11 | Nov 2022 www.irjet.net p-ISSN:2395-0072
climatic datasets representing drought (1948–1949) versus average (1969–1970) conditions. The 901 km2 watershed of the South Branch Ontonagon River (USGS gauging station 04039500 at Ewen, MI) was selected for study. The effects of the different climatic conditions on parameter response and sensitivity were evaluated,and performance of the two calibration versions was compared using a common validation period, 1950–1965. For the drought- and average-calibration periods, models were well calibrated, as indicated by high Nash-Sutcliffe efficiencycoefficientsSurfacerunoffwasestimatedbythe SCS Curve Number method from daily precipitation records using default values provided in SWAT, which were acceptable based on land use and soil data in the studyarea. TheMuskingum method wasused forchannel water routing. Model calibration was conducted by comparing the SWAT simulated data with the USGS observeddischargeat04039500onmonthlybasis.Special attention was given to the calculation and evaluationof potential evapotranspiration (PET), The Priestley–Taylor model was used in SWAT to estimate PET. evaluationof potential evapotranspiration (PET), The Priestley–Taylor modelwasusedinSWATtoestimatePET.
Shimelis G. Setegn, Ragahavan Srinivasan and Bijan Dargahi(2008) The main objective of this study was to testtheperformanceandfeasibilityoftheSWATmodelfor prediction of streamflow The Lake Tana basin comprises an area of 15,096 km2 including the lake area. It was applied to the Lake Tana Basin for the modeling of the hydrological waterbalance. Thesensitivityanalysisofthe model to sub basin delineation and HRU definition thresholds showed that the flow is more sensitive to the HRU definition thresholds than sub basin discretization effectDespitedatauncertainty,theSWATmodelproduced good simulation results for daily and monthly time steps. The calibrated model can be used for further analysis of the effect of climate and land use change as well as other differentmanagementscenariosonstreamflowandofsoil erosion.
S.S. Panhalkar(2014) study is to derive the parameters required for runoff modeling using the geospatial database and estimate the runoff of the Satluj basin. For the present study, Satluj basin up to the Bhakra dam has beenselectedasastudyregion.Thegeographicallimitsof the Satluj basin right from start up to the Bhakra dam lie between Latitudes 31_N to 33_N and Longitudes 76_E to 80_E. The Catchment area of the river Satluj upto the Bhakra dam is about 56,874 sq. km Average annual rainfall and snowfall are 485 mm and 168 mm respectively. The total sediment loading is 51.27 T/HA. Theaverageannualsurfacerunoffis79.67mm.
Venkatesh (2018) SWAT is been used and calibrated for River Manimala basin which is situated in Kerala covering anarea of780km2 andevaluatecomponentsofhydrology forthebasintotargetonprotectionandmanagement.The runoff and rainfall at station Thondara the data is used in thisstudyfrom2000to2007.Fromtheresultsitisshown that runoff is “influenced by these parameters such as CN, ESCO,andSOL_AWC,whereasbaseflowwasinfluencedby lower values of GW_REVAP and ALPHA_BF.” Additionally, the values of “RMSE and NOF suggest for acceptance of rainfall-runoff model.” With lower values of RMSE and NOF, calibration can be adjusted as good which is admissibleforassessingengineerproblemandapplication. The calibrated parameter values can also be used for furtherstreamflowsimulationsinthiscatchment”
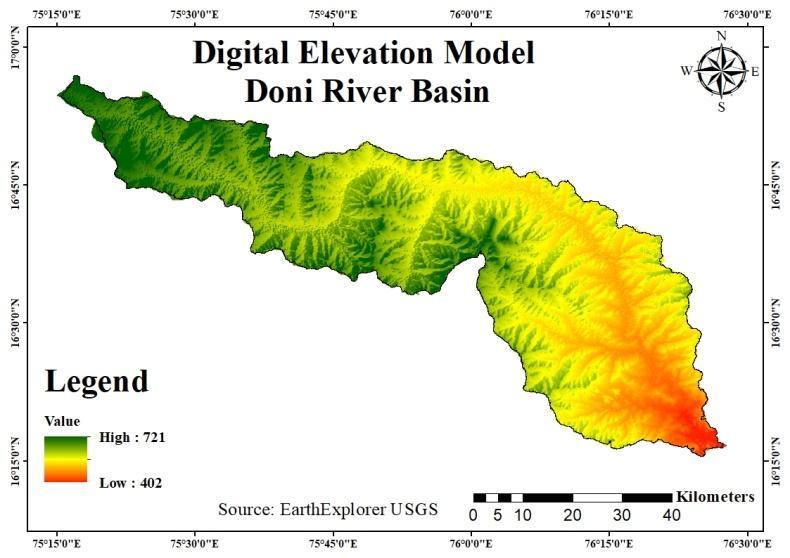
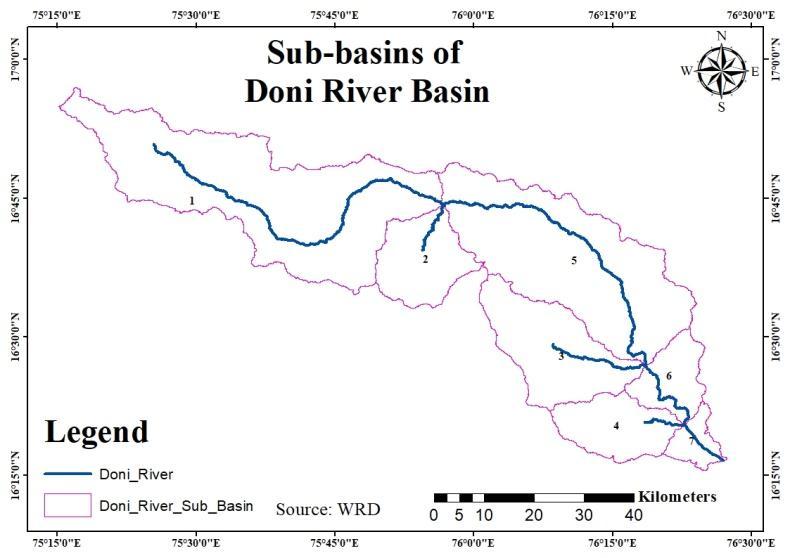
TheDoniRiverbasinistakenasstudyareaforthepresent work, which lies on the Krishna River basin in Vijayapura district.Ithasalongitudeof 770, 15 ' , 22''E to770, 26 ' , 15'' E and latitude of 130, 27', 45'' to 130, 15 ' , 30'' N and Doni is the major tributary of Krishna River. The basin areauptotheconfluencepointofDoniwiththeKrishnais about 2900 km2. However, the Central Water Commission has established a gauging site upstream of the confluence coveringabout 1344.18 km2ofDoniwatershed.
TheriverDonioriginatesabout7KmsouthofJathtownin sangali district, Maharashtra to the west of Vijayapura districts of karanataka. It joins theKrishnato the southwestofthetownofTalikoteatthedownstreamofthe Almatti dam. While its total length is 176 km and Sudden flash floods occur in the rainy season near Katnalli and BasavanaBagewadi.
The Doni River has a winding course and due to its salt content, saline layersare formedon the banks of the river during summer. Its valley is rich with fertile alluvial soil. Duringrainyseason,duetoflood,itisquitecommontosee small embankments washed away and thick beds of slush accumulate.
International Research Journal of Engineering and Technology (IRJET) e-ISSN:2395-0056
Volume: 09 Issue: 11 | Nov 2022 www.irjet.net p-ISSN:2395-0072
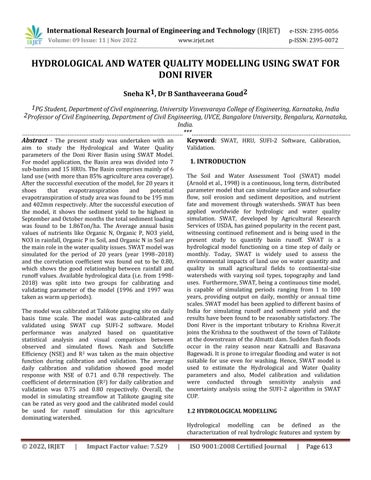
acquired through shutter radar topographic mission (SRTM) is available for the globe. The DEM was filed by ArcSWATinordertoavoiderroneousflowdirectionraster. TheclippedDEMishavingtheelevation rangingfrom402 mto721mandtheresultedDonidigitalelevationmodelis shownbelowMap.
Fig 1: Location Map of Doni Watershed
In the present study, SWAT2012interface was used to meet the objective of the study. The model works in GIS environment and has some hardware and software requirement. The software required for the interface includes.
1.MicrosoftWindows10Operatingsystem.
2.ArcGIS-ArcView10.4
3.ArcGISSpatialAnalyst10.4extension
The SWAT is a multi-parameter model and requires spatial catchment information with supporting database. Theinputfilesarecreatedusingthefollowingdatasets.
A. SPATIAL DATASET: Digital Elevation Model (DEM), Landcover/LanduseMap,SoilMap.
B. DATABASE FILES : Soil database, Land use database, Weather generation table, Precipitationtable,Runoff data table, Temperature data table, Relative humidity data table,Windspeeddatatable.
Locationofoutlet,weathergenerationgauges,raingauges, temperature gauges, relative humidity gauge and wind station,Landcoverlookuptable,Soiluselookuptable.
The DEM of the study area was downloaded from USGS earth explorer where elevation data at 30 m resolution
Fig 2:DEM of Doni River
Fig 3: LULC Map of Doni River

LULCData obtained from Karnataka StateRemote Sensing Application Center (KSRSAC), which stood very much usefulinderivingdifferentlandusesandlandcoverofthe study area considered. Major classes classified include water,forest,barrenland,agricultureland,rangelandand agriculture Land. The Land Use map of DoniRiver Basin is showninMapbelow.
International Research Journal of Engineering and Technology (IRJET) e-ISSN:2395-0056
Volume: 09 Issue: 11 | Nov 2022 www.irjet.net p-ISSN:2395-0072
The soil map was obtained from the K(KSRSAC) and converted symbology as per Food and agricultural organization (FAO), Global. Soil data of Doni River Basin has been divided mainly into two groups i.e. clayey and Loamymajorityof thesoilinDoniRiver Basinfallsunder clayeysoilclass.Soil mapof Doni RiverBasin isshownin Map.
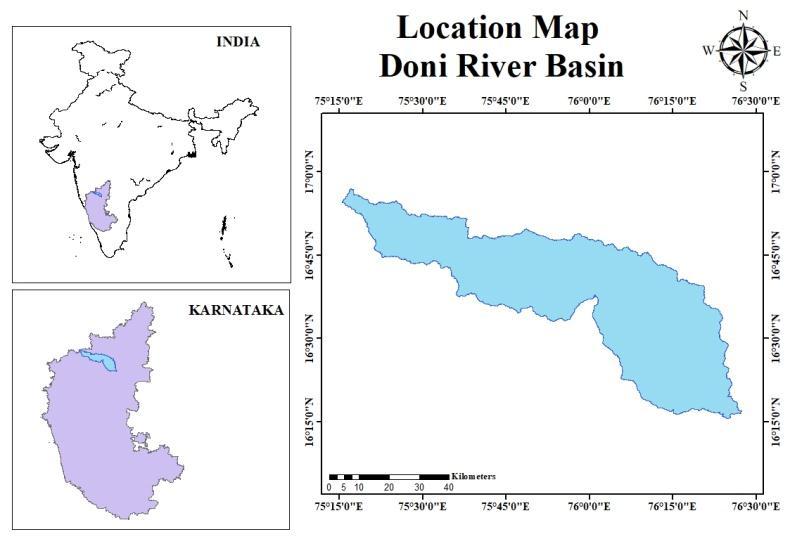
SWAT,basinisdividedintothenumberofsub-basins.This is done due to the varying land, soil, slope within basin. Further subbasins are divided into number of Hydrologic Response Units (HRUs). The HRU is an area with unique combination of land use, soil class and slope. The user manual of SWAT model explains the set of procedure to simulate the model, which are as follows: (1) Watershed delineation (2) HRU analysis (3) Import weather data (4) Creationofinputfile(5)RunSWATisshownFigure.
Fig 4: Soil Map of Doni River
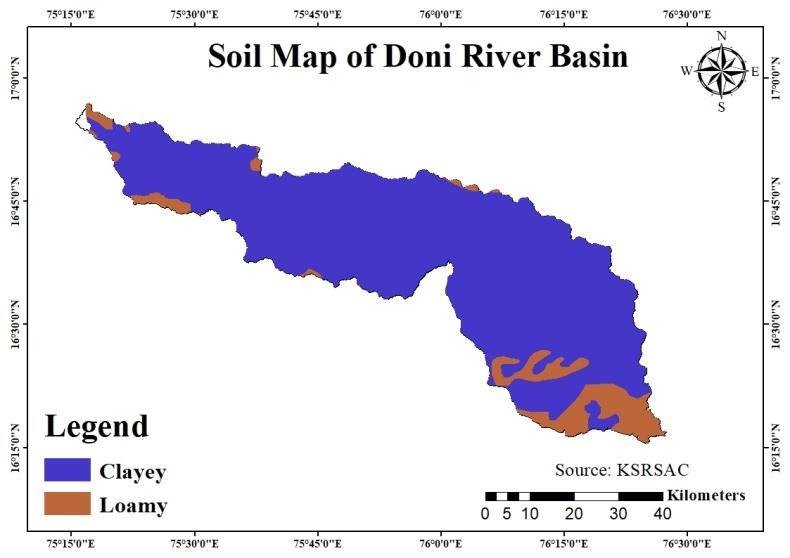
Table 1: Data Sets Used
Sl.No Data Used Source
1 SoilMap(2018)
2 LandUse&Land Cover map(2018)
3 Rainfalldata (1996-2018)
KarnatakaStateRemote SensingApplicationCenter (KSRSAC)andsymbolizedas perFoodandagricultural organization(FAO),Global soil
KarnatakaStateRemote SensingApplicationCenter (KSRSAC),Bengaluru
WaterResources Department(WRD), Bengaluru
4 DigitalElevation Model(2021,30m resolution) USGSEarthExplorer(SRTM)
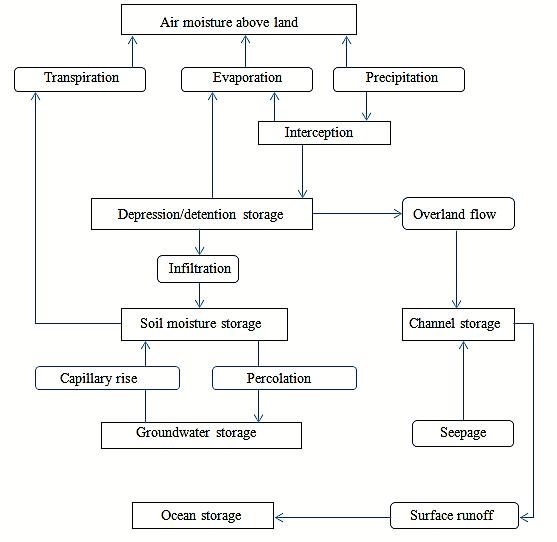
Fig 5: Flow chart representation of SWAT model.
The Penman Monteith (Monteith 1965) method was used forestimationofpotentialevapotranspiration(PET)andit uses MUSLE (Modified Universal Soil Loss Equation) for soillossestimation(WilliamsandBerndt1977).
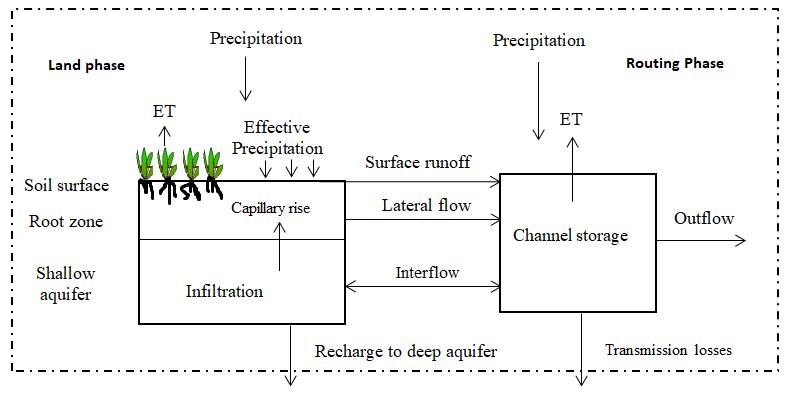
Fig 6: Water balance in land phase and routing phase
International Research Journal of Engineering and Technology (IRJET) e-ISSN:2395-0056
Volume: 09 Issue: 11 | Nov 2022 www.irjet.net p-ISSN:2395-0072
WaterbalanceofthelandphaseisgiveninEqn.1(Neitsch etal.,2005)
SWt = SWo + ⅀ (Pi - Qsurf,I – Ea,I – wseep,I – Qgw,i) (1)
Where, SWo andSWtaretheinitialandfinalsoilmoisture content, respectively. Pi, Rainfall, Qsurf,i, Runoff, Ea,i,Evapotranspiration,wseepwaterenteringintothevadose zone from the soil profile, Qgw,iamount of return flow happening on ith day. In the second stage of the SWAT hydrologic simulation, the routing stage, two options are available to route the flow in the channel networks: the variable storage and Muskinghum methods. Both are variations of the kinematic wave model. Water yield is estimatedseparatelyforeachHydrologicalResponseUnits (HRUs)separately.
Waterbalanceinthechannelreachisshownbelow. Vstored,t= Vstored,0 + Vin,i – Vout,i– tlossi - Ech,i+ Vbank,I (2) Where,Vstored,tandVstored,0arethevolumeofwaterstoredin the reach at the beginning and end of the time step I, Vin,iand Vout,i are the volume of water flowing into and out of the reach, respectively during the time step i. tlossiTransmission loss, Ech,i, direct evaporation from the channel reach,Vbank,irepresentsthevolumeofwateradded to the reach from back storage via return flow. The processes which are involved in the water balance model and the methods used for their estimation in SWAT are showninFig
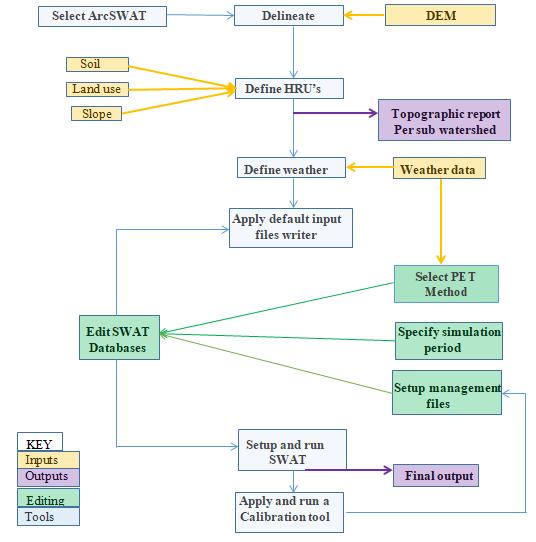
ThefirstandforemoststeptostartworkinginArcSWATis tocreateanewSWATprojectandsetupworkingdirectory andgeodatabase.Allthefurtherworkwillget storedinit. Details about processing being undertaken are given in following procedures. Figure below provides a brief overview and road map for setting up a SWAT project to run.
Fig 8: Workflow diagram to setup and run SWAT (Mireille and Lewarne 2009)
The watershed delineation process includes five major steps, DEM setup, stream definition, outlet and inlet definition, watershed outlets selection and definition and calculationofsubbasinparameters.Automatedwatershed delineation embedded in SWAT interface was used to delineatethewatershed.Delineationofthewatershedand sub-watershedwasdonebymeansofDEMdata.DEMwas importedintotheSWATmodelandprojectedtoUTMzone 43. A mask was manually delineated over the DEM to remove the specific part, to delineate the border of the watershed and digitize the stream networks in the Doni River basin, which reduce the time of processing and burn-in a polyline stream dataset that in turn helps the
2022, IRJET | Impact Factor value: 7.529 | ISO 9001:2008 Certified Journal | Page618
International Research Journal of Engineering and Technology (IRJET) e-ISSN:2395-0056
Volume: 09 Issue: 11 | Nov 2022 www.irjet.net p-ISSN:2395-0072
subbasinreachtofollowtheknownstreamreach.Basedon theareaofthebasin,onlyoneoutletisdefined.Asaresult, actual Doni catchment outlet is delineated. Lastly calculationsofsub-basinparameterweremade.
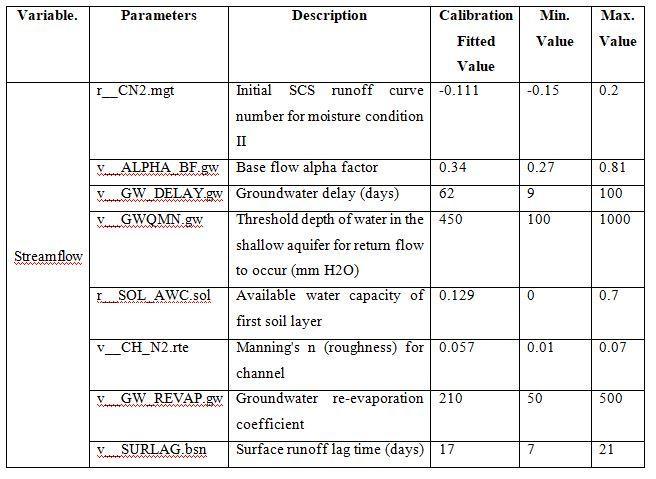
requires that the uncertain model parameters are systematicallychanged,themodelisrun,andtherequired outputs (corresponding to measured data) are extracted from the model output files. The main function of an interfaceistoprovidealinkbetweentheinput/outputofa calibration program and the model. The simplest way of handlingthefileexchangeisthroughtextfile.formats
Table 2: The parameters used in the computation, their range, and the calibrated values.
Fig 9: Sub-basins of Doni River basin
It is second step in parameterization of SWAT model. Sequenceofmodeliscarriedasfollows, Landuse/Soils/SlopeDefinition HRUDefinition HRUAnalysisreport
HRU analysistool bar helps in loading of the land use, soil and slope to the watershed. Using HRU analysis toolbar, land use maps are fed into model and lookup tables are providedtothemodel.Correspondingly,soilmapsandthe lookup table are provided to the model. By completion of this slope values are specified. There are 5 numbers of classes of slope entered. They are as follows; 0-2%, 2-4%, 4-8%, 8-17% and 17-9999% respectively. After loading of each data reclassify and then overlay the data’s, thus overlay report will be generated. Then multiple HRU option is chosen to create multiple HRU’s within each sub watershedwiththresholdpercentageareaoflanduse,soil andslopeas10%respectively.
SWAT-CUP is a public domain computer program for calibration, validation and uncertainty analysis of SWAT model. The program links SUFI2, PSO, GLUE, ParaSol, and MCMC procedures to SWAT. Automated model calibration
SWAT calibration and validation was performed for streamflow at the outlet of sub-basin. Streamflow was calibrated from January1998 to December 2010 and validated from January 2011 to December 2018 using observed daily discharge obtained from the CWC gauge. The calibration and validation for sediment yield, total nitrogen,andtotalphosphorouswasnotdoneduetononavailabilityof observed data. The R-factor and P-factor, which were computed by SUFI-2, were used to predict model uncertainty. T-statistics and P-value were used to performsensitivityanalysis.
PerformanceRating NSE
Verygood 0.75<NSE<1 good 0.65<NSE≤0.75 Satisfactory 0.5<NSE≤0.65 Unsatisfactory <0.5
International Research Journal of Engineering and Technology (IRJET) e-ISSN:2395-0056
Volume: 09 Issue: 11 | Nov 2022 www.irjet.net p-ISSN:2395-0072
SWAT modelling for flow, sediments and nutrients have been performedsoastoattainthepollutantsdetailsusing land use and soil distribution data for a watershed as a result of which the pollutant sources that exists involve dairy manure application fields, wastewater treatment plants, croplands, and urban areas. In the Doni Basin the Average Monthly and Yearly Hydrological and Nutrient parameters like Runoff, Lateral Flow, Water Yield, Evapotranspiration,PET,Sedimentyield,TotalNitrateand Total Phosphorus are obtained by model. The basin average hydrological parameters and values for the 20 yearsthatisfrom1998to2018areshowinTable4.
Values
PRECIP 536.9mm
SURFACERUNOFFQ 248.75mm
LATERALSOILQ 0.85mm
GROUNDWATER(SHALAQ)Q 176.80mm
GROUNDWATER(DEEPAQ)Q 9.86mm
REVAP(SHALAQ=>SOIL/PLANTS) 8.04mm
DEEPAQRECHARGE 9.69mm
TOTALAQRECHARGE 193.89mm
TOTALWATERYLD 436.26mm
PERCOLATIONOUTOFSOIL 193.20mm
ET 195.2mm
PET 402.2mm
TOTALSEDIMENTLOADING 24.37t/ha
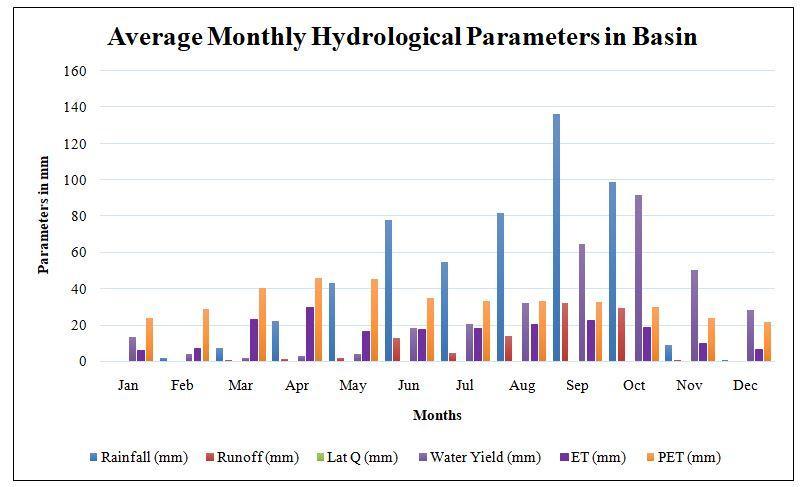
Fig.10 show the bar charts comparing the average monthly rainfall, runoff, Lateral Flow, Water yield, evapotranspiration and PET of the Basin, August and SeptemberisthemonththathashighestRainfall andalso September and October month has highest evapotranspiration this may be due to the earlier months thathavesaturatedthesoilthewatertablesrisingmaybe contributingtotherevapoftheshallowaquifers.
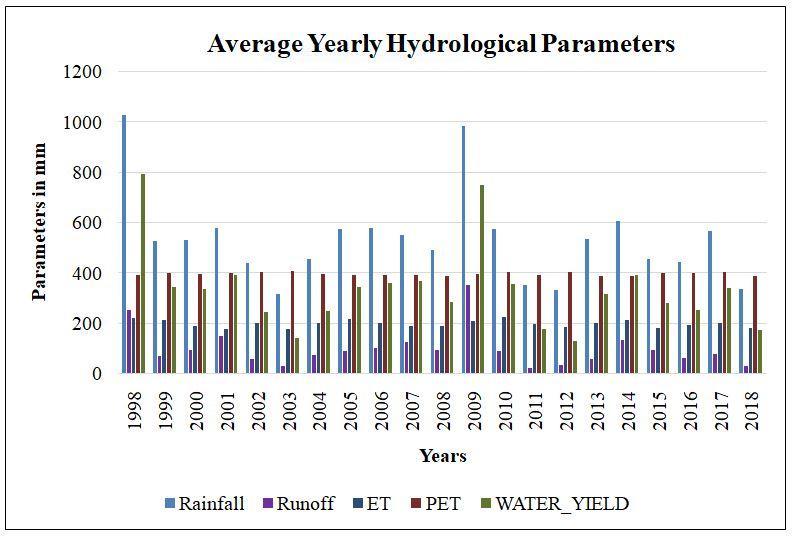
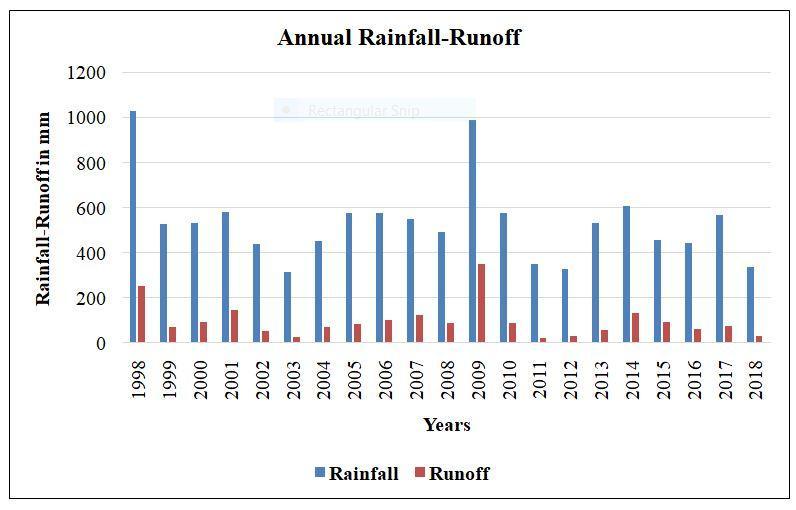
Fig.11show the barcharts comparingthe averageyearly rainfall, runoff, Water yield, evapotranspiration, and PET of the Basin. The highest Rainfall and Water yield in the year1998and2009respectively.Also,theFig.15showsthe bar charts comparing the average yearly nutrients components of the basin, these are majorly obtained by theRainfallandAgriculturallandusesofthebasin.
International Research Journal of Engineering and Technology (IRJET) e-ISSN:2395-0056
The Average annual basin values of nutrients like Organic N, Organic P, NO3 yield, NO3 in rainfall, Organic P in Soil, and Organic Nin Soil was 6.763 (kg/ha),0.827 (kg/ha), 0.257 (kg/ha), 2.282 (kg/ha), 687.100 (kg/ha), and 5672.734(kg/ha)respectively.
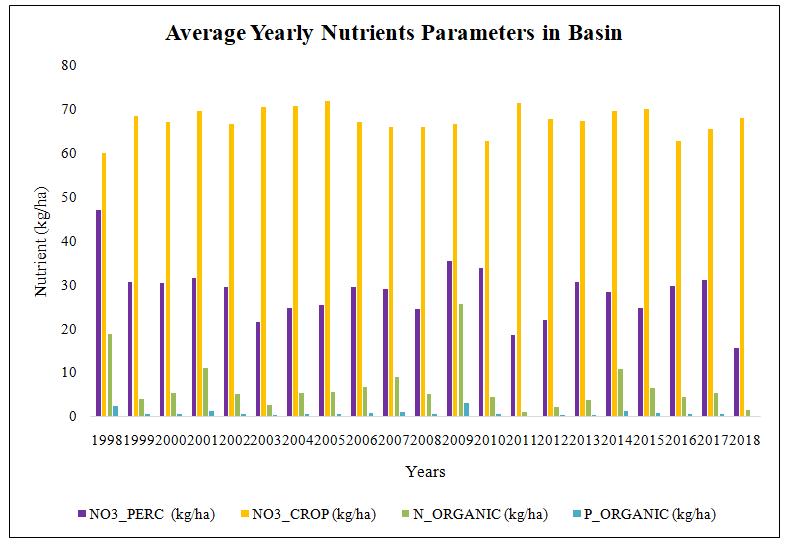
Figure 12: Average yearly nutrients components in the basin
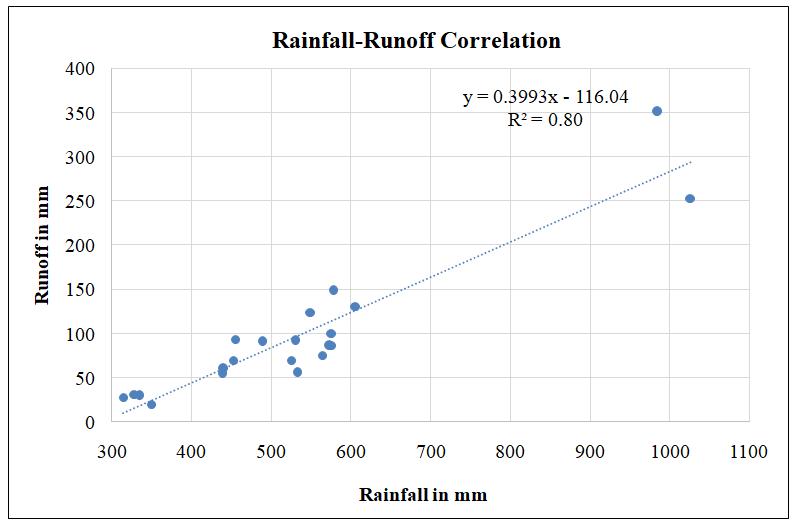
For the study the daily rainfall data of 19 gauging stations isusedandallotherweatherdataarecollectedfromWater Resources Department (WRD) and Fig.13 shows the Annual comparison between rainfall and runoff of the DoniBasinreceivedhighestrainfallintheyearof1998and 2009in the 20 years of period from 1998 to 2018.Fig.14 shows the Rainfall-Runoff Correlation coefficient was foundtobe0.80.
5.2
5.2.1
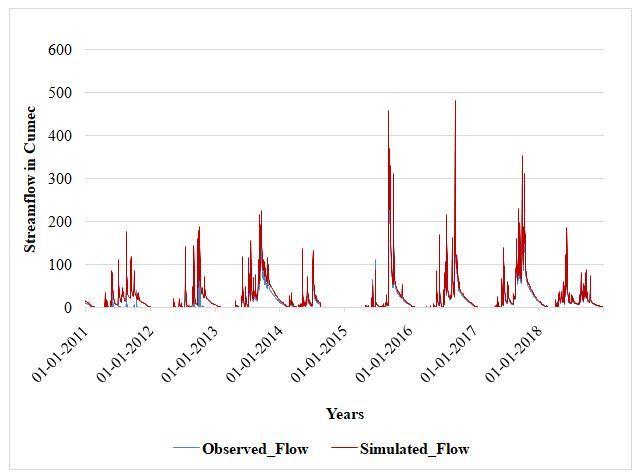
In the present study area Doni basin, the following plot shown in the daily calibration of observed and simulated flow period from 1998 to 2010 years. From the Fig.18below it is seen that all high peaks are overestimated, and, in many events, deviation could be clearlyseenbetweenobservedflowandsimulatedflow. It can be seen clearly that many of the peaks in the respective figures are not matching. Some peaks are matching but overestimated. This may be due to uncertainty in input datasets particularly use of rainfall data,LanduselandcoverandSoilproperties.
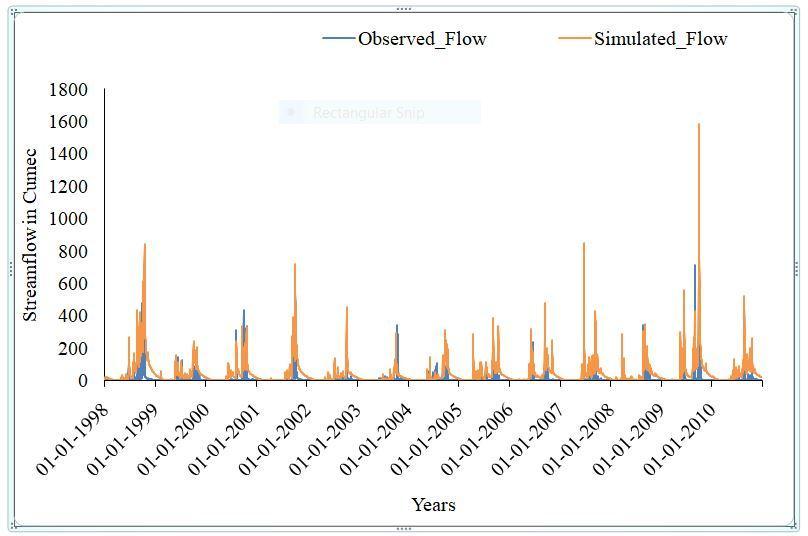
Figure 15: Daily Calibration of Observed and Simulated Flow for Doni basin
Volume: 09 Issue: 11 | Nov 2022 www.irjet.net p-ISSN:2395-0072 © 2022, IRJET | Impact Factor value: 7.529 | ISO 9001:2008 Certified Journal | Page621
International Research Journal of Engineering and Technology (IRJET) e-ISSN:2395-0056
Volume: 09 Issue: 11 | Nov 2022 www.irjet.net p-ISSN:2395-0072
TheaverageR2 valuefordailycalibrationandvalidation wasfoundtobe0.75and0.80respectivelyanditisshown Fig.17and18andalsothevaluesshowninTable.5.
Validation was performed with the same parameter value rangesandrunningwithsame500numberofsimulations. The validation period was taken also for 8 years (20112018). Fig.16 shows the daily validation plot between observed flow and simulated flow. In order to distinguish properly the graph showing the plot of observed and simulated flow for validation, the plot representing period from 1st January 2011 to 31st December 2018 were prepared. Simulated flow was nearly as close to the actual measured flow. some of the peaks did match and it also showed that the model did not response to some peaks of the observed flow. This could be the contribution of baseflowanduncertaintyininputdata.
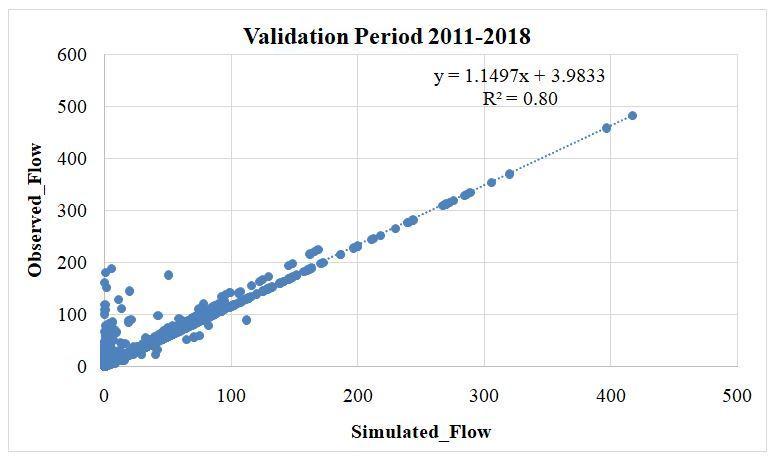
The average NSE value for calibration and validation was found to be 0.724 and 0.765 respectively for daily basis. Hence,themodelshowedgoodfit.
5: Statistical Model Evaluation Performance for Doni Watershed in Daily Basis
Statistical Parameter R2 NSE Calibration(1997-2002) 075 071 Validation(2003-2008) 080 078
SWAT model divided the Basin into 7sub basins and 15 HRUs units were created for the analysis and Average annual rainfall Obtained after successfully running SWAT model for 20years from(1998-2018)was found to be 1008mm. After the successful execution of the model, for 20 years it shoes that evapotranspiration and potential evapotranspirationofstudyareawasfoundtobe195mm and402mmrespectively.Afterthesuccessfulexecutionof the model, it shows the sediment yield to be highest in SeptemberandOctobermonthsthetotalsedimentloading was found to be 1.86Ton/ha. The Average annual basin values of nutrients like Organic N, Organic P, NO3 yield,NO3inrainfall,OrganicPinSoil,andOrganicNinSoil was6.763 (kg/ha),0.827 (kg/ha), 0.257 (kg/ha), 2.282 (kg/ha), 687.100 (kg/ha), and 5672.734 (kg/ha)respectively.
International Research Journal of Engineering and Technology (IRJET) e-ISSN:2395-0056
SWAT model was simulated for the period of 20 years (year 1998–2018) and the correlation coefficient was found out to be 0.80, which shows the good relationship between rainfall and runoff values. The study has shown thattheSWATmodelcanproducereliableestimatesofthe different components of the hydrological cycle. The SWAT model with GIS environment show very effective tool for hydrologicalmodelling
Themodelwascalibratedandvalidatedusingtheobserved streamflow at Talikote gauging site. The model was autocalibrated using SUFI-2 considering 8 parameters. Based onthisstudyfollowingconclusionscanbedrawn:
1. The Nash-Sutcliffe Efficiency (NSE) for daily calibration andvalidationwas0.71and0.78respectively.
2.Thecoefficientofdetermination(R2)fordailycalibration andvalidationwas0.75and0.80respectively.
3. Overall, the model response well to the simulation of streamflow for the Doni River basin. The model is therefore suitable to simulate runoff behavior of agriculturedominatedDoniRiverbasin.
1. AbbaspourKC,JohnsonCA,GenuchtenMTV.2004. Estimating Uncertain Flow and Transport Parameters Using a Sequential Uncertainty Fitting Procedure.VadoseZoneJournal,pp1341-1351.
2. AbbaspourKC,RouhalonejadE,VaghefiS,Srinivasan R, Yang H, Kløve B. 2015. A continental-scale hydrology and water quality model for Europe Calibration and uncertainty of a high-resolution large-scale SWAT model. Journal of Hydrology 524, pp.733–752.
3. Abbaspour, C.K. (2013) SWAT-CUP 2012: SWAT Calibration and Uncertainty Programs A User Manual.103.
4. Abraham L Z, Roehrigi J, Alamirew D A.2007. Calibration and Validation of Hydrologic Model for Meki Watershed, Ethiopia. University of KasselWitzenhausenandUniversityofGöttingen.
5. Arnold, J.G., Moriasi, D.N., Gassman, P.W., White, M.J., Srinivasan,R.,Santhi,C.,
6. Arnold, J.G., Neitsch, S.L., Kiniry, J.R., Williams, J.R., 2011.SoilandWaterAssessmentToolVersion.2009.
Volume: 09 Issue: 11 | Nov 2022 www.irjet.net p-ISSN:2395-0072 © 2022, IRJET | Impact Factor value: 7.529 | ISO 9001:2008 Certified Journal | Page623
Texas water resourcesinstitutetechnical report No. 406.
7. Behrendt, H., Opitz, D. 2000. Retention of nutrients in river systems: dependence on specific runoff and hydraulicload,Hydrobiologia,410:111–122.
8. Birhanu Z. 2009. Hydrological modeling of the Kihansi River catchment in South Central Tanzania using SWAT model. International Journal of Water Resources and Environmental Engineering: Vol. 1 (1),pp.001-010.
9. Bøggild,C.E.,Knudby,C.J.,Knudsen,M.B.,Starzer,W. 1999. Snowmelt and runoff modelling of an Arctic hydrological basin in west Greenland, Hydrological Processes,13:1989–2002.
10. Cao W, Bowden BW, Davie T. (2006). Multi-variable andmulti-sitecalibrationandvalidationofSWATin a large mountainous catchment with high spatial variability.HydrolProcess20:1057–1073
11. Chew, C.Y., Moore, L.W., Smith, R.H. 1991. Hydrological simulation of Tennessee’s North Reelfoot Creek watershed, Research Journal of the WaterPollutionControlFederation,63(1):10–16.
12. DessuSB,MelesseAM.2012.Modelingtherainfall–runoffprocessoftheMaraRiverbasinusingtheSoil and Water Assessment Tool. Hydrological Process: 26,4038–4049.
13. Diwakar S K, Kaur S, Patel N. 2014. Hydrologic Assessment in a Middle Narmada Basin, India using SWAT Model. International Journal of Engineering Technology and Computer Research (IJETCR), Volume2Issue6;PageNo.10-25.
14. Green, W.H. and Ampt, G.A. (1911) Studies in SoilPhysics, Part 1, the Flow of Air and Water through Soils. The Journal of Agriculture Science, 4, 11-24.
15. Haan, C. T., D. E. Storm, T. Al-Issa, S. Prabhu, G. J. Sabbagh, and D. R. Edwards. 1998. Effect of parameter distributions on uncertainty analysis of hydrologicmodels.Trans.ASAE41(1):65-70.
16. Haldar R, Singla S, Singla R, Khosa R. 2014. Hydrologic Modeling for the Gandak Basin Using SWATwithSensitivityConsiderations.International. International Journal of Earth sciences and Engineering:ISSN0974-5904,Volume07,No.02.
International Research Journal of Engineering and Technology (IRJET) e-ISSN:2395-0056
Volume: 09 Issue: 11 | Nov 2022 www.irjet.net p-ISSN:2395-0072
17. Harmel, R.D., Griensven, A.V., Liew, M.W.V., Kannan, N.,Jha,M.K.,2012.SWAT:Modeluse,Calibration,and Validation.ASABE.Vol.55(4):1491-1508.
18. Herbst, M., Fialkiewicz, W., Chen, T., Pütz, T., Thiéry, D., Mouvet, C., Vachaud, G., Vereecken, H. 2005a. “Intercomparison of Flow and Transport Models Applied to Vertical Drainage in Cropped Lysimeters”, VadoseZoneJournal,4(2):240–254.
19. Ireson, A., Makropoulos, C., Maksimovic, C. 2006. Water Resources Modelling under Data Scarcity: Coupling MIKE BASIN and ASM Groundwater Model, WaterResourcesManagement,20:567–590.
20. Jajarmizadeh M, Harun S, Abdullah R, Salarpour M. 2012.UsingSoilandWaterAssessmentToolforFlow Simulation and Assessment of Sensitive Parameters Applying SUFI-2 Algorithm. Caspian Journal of AppliedSciencesResearch,2(1),pp.37-44.
2022, IRJET | Impact Factor value: 7.529 | ISO 9001:2008 Certified Journal |