International Research Journal of Engineering and Technology (IRJET) e-ISSN:2395-0056

Volume: 09 Issue: 11 | Nov 2022 www.irjet.net p-ISSN:2395-0072
International Research Journal of Engineering and Technology (IRJET) e-ISSN:2395-0056
Volume: 09 Issue: 11 | Nov 2022 www.irjet.net p-ISSN:2395-0072
1M.Tech. Scholar, Dept. of mechanical Engineering, SGSITS Indore Madhya Pradesh, India 2Associate Professor, Dept. of mechanical Engineering, SGSITS Indore Madhya Pradesh, India ***
Abstract - Wing design is the crucial challenges for a designer during the aircraftdesignprocess. Therefore, inorder to get an effective wing geometry that complies with the design requirements, a designermustoptimisealargenumber of wing geometrical characteristics. One of these characteristics is the taper ratio, which is the ratio of a wing's root chord to tip chord lengths. In this study, the taper ratio of an aircraft wing was explored numerically in termsofinduced drag and lift coefficients by computational fluid dynamics programme. At the start of the analyses, the program's mesh reliability was evaluated. Later, the updated versions of the wings with taper ratios ranging from 0.4 to 0.8 (with a 0.2 increment) were evaluated in order to observe the impacts of taper ratio on CL, CD, L/D of aircraft wing. In the contextofthe results of the analysis, the computed aerodynamic characteristics and lift distributions of wings with various taper ratios were compared. Additionally, the sizes of the tip vortices on each wing were measured and compared.
Key Words: CFD,taperwing,taperratio,Lifttodragratio
In recent years, research on how to reduce drag on wingsurfaces while using aerodynamic engineering technologieshasgainedinternationalattention.Therefore, various taper ratiosare frequently tried in an effort to reduce the drag in order toincrease the airfoil's working efficiency.TaperratioItisdefinedastheratioofrootchord lengthtotipchordlengthTheliftanddragforcecanbegiven as,
Lift Force, FL=CL ×0.5ρA v2
Drag Force, FD=CD ×0.5ρA v2
liftcoefficient(CL)
Dragcoefficient(CD)
SurfaceArea(A)
Freestreamvelocity(V)
DensityofAir(ρ)
Ahluwaliaandothers,thisstudyconcentratedonthewing aerodynamiccharacteristicsinlowsubsonicflow,bothwith andwithoutwinglets.TheNACA653-218profilewasused for four variations elliptical, semi-circular, and straight winglets.UtilizingtheSpallart-Allmarusmodelareusedas turbulencemodel.TheCFDsimulationwasdoneat8°angle of attack and a V = 40 m/s, yielding an approximate Reynolds number (Re) of 327931. The NACA six-digit number653218wasusedtocreatethesimilarprofileforthe wingandwingletinSolidWorks.Ineveryinstance,thesemiwing span and chord were set at 330 mm and 121 mm, respectively.Thestudyfindsthatellipticalwinglets,followed by semi-circular and straight winglets, provide the best balanceofmaximumliftandminimumdrag[1].
Bergmannetal,Numericalorexperimentalevaluationscan be used to determine how the taper ratio affects the parameters of the wing's aerodynamics. It may be advantageous to employ computational fluid dynamics softwarewhileinconceptualdesignphaseofanaeroplane ratherthantime-consumingwindtunnelsetups.Thereare numerous tools available to carry out these assessments, including Solidworks Flow Simulation, XFLR5, and Ansys Fluent[2].
Zhangetal,thegoalofthisexperimentalanalysisatBeijing UniversityofAeronauticsandAstronautics'low-speedwind tunnelwastoexaminetheimpactsofdeltawings'taperratio ontheiraerodynamicperformance.Thestudyanalysesdelta wing models with a Re= 3.45 x 10⁵ and geometrically variabletaperratios.Arootchordlengthof200mmwere employed in this study's investigation. According to the analysis' findings, wings with taper ratios less than 0.3. Additionally,itwasdiscoveredthatthedelta-wingthestall angle,maximumtaperratio,andtherangebetween0.3and 0.68Liftrisesasthetaperratiodecreases,peakingat0.725 taperratio.AlsodiscoveredwereconsistentpotentialCL = 2.3andCD =0.3inthewingswithtaperratioslessthan0.5. Whentaperratioexceeds0.5,Kpwasseentodroprapidly withgreatertaperratio.Additionally,thisadjustmentwas dividedintotwopossibilitiesforaspectratios,rangingfrom 0.56 to 4.77 and 0.5 to 2.38, respectively. According to analysisfindings,allcroppeddeltawingswerefoundtohave lessdragthannon-croppedonesatlowanglesofattackat thetaperratiorangeof0to0.3.Itwasdiscoveredthatthe
International Research Journal of Engineering and Technology (IRJET) e-ISSN:2395-0056
Volume: 09 Issue: 11 | Nov 2022 www.irjet.net p-ISSN:2395-0072
maximumCLincreasesandthestallangleofthewingdelays attaperratiosbetween0.3and0.79[3].
HariyadiSP.etal.,Numericalresearchconductedonthetips of the NACA 23018 airfoil wings, blended winglets were examined.AV=40m/sorRe=1×106 isusedtogetherwith angles of attack of 0, 5, 10, and 15. When analysing a parameter,thecoefficientpressure(Cp),velocityprofile,lift, drag, and ratio CL/CD are all taken into account. The obtained contours are the pressure contour, velocity, and vorticity.Inlightofallofthis,theCL/CD ratioisenhancing the aerodynamic performance of wings with blended wingletsandplainwings[4].
Manikantissar,inthisstudy,thenotionaldelta-wingaircraft modelwasexaminedintermsofitssubsonicspeed,AOA,CD, CL, stall angle, and turbulences. The outcome would determine whether it may be used by UAV drones, commercial aircraft, and fighter jets. Computational fluid dynamicsandtheprogrammeANSYSCFXarebothutilisedto analysetheissue.thecomputationalflowpastthedelta-wing crosssectionwithaspectratioshowphysicallypossibleflow fileddemonstratedbysurfacepressuredistributiontheFD andFLisgeneratedbyaircraftiscomputedwithtaperratio 0.125and0.4andanalysediftaperratio0.125stallangleis 18°andwhentaperratio0.4thenstallangleat15°[5].
Wang et al, in this work using numerical simulation to comparethesmoothsurfaceandthetexturedsurfaceinthis work Discovered thatthetexturedairfoil cansignificantly reducetheCDandimprovetheCL [6]
Kumar, the idea of morphing winglets is presented and investigated using a CFD-aided analysis. In cruise flying, threedifferentconfigurationsarestudiedcomputationally. wingletcantunderdifferentattackanglesandsituationsthe morphing parameter is angle. The arrangementsarecomparedforaerodynamiceffectiveness toestablishtheoptimumconfigurationforeachpre-defined flight of the BWB missionsegments. Then, the top configuration is contrasted with the starting point. arrangementtogaugeaerodynamicefficiencyadvantagesto the morphing winglet concept. Findings reveal that the dragwingletreducescoefficientatahighAOAarrangement thatimprovestheL/Dratioaswell[7]
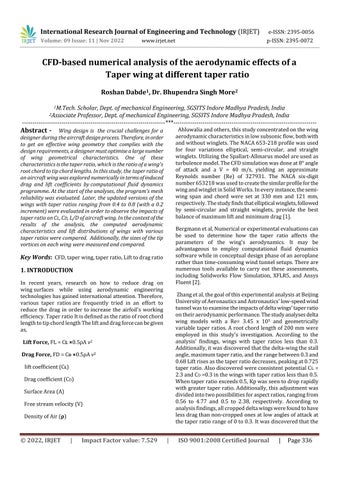
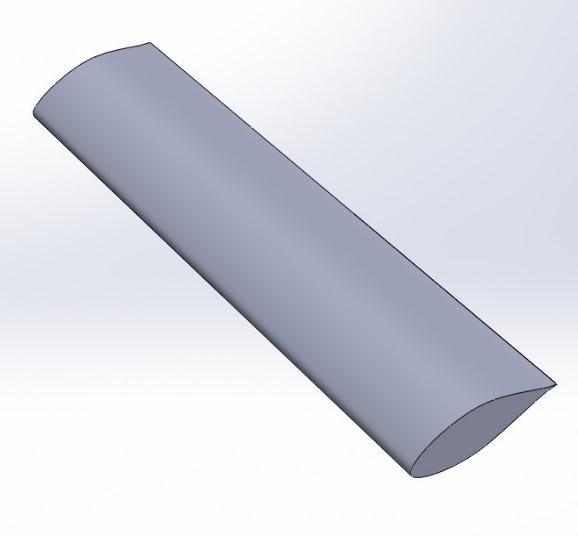
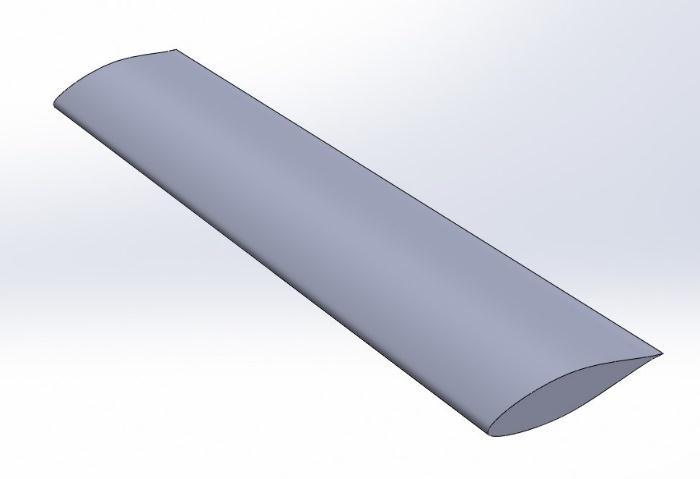
Modellingofawingisdoneonsolidworksdifferentwing model is shown in Fig.1. to Fig.5. The wingspan and root chordisL=330mmandC=120mmrespectivelyandtipchord is changeaccordingtotaperratiosthewingwithdifferent taperratioisshowninfig.andimportantwingterminology and dimensions of wing is shown in Fig 7. Fluid domain dimensionsis660mm×360mm×600mmisshowninfigure3.
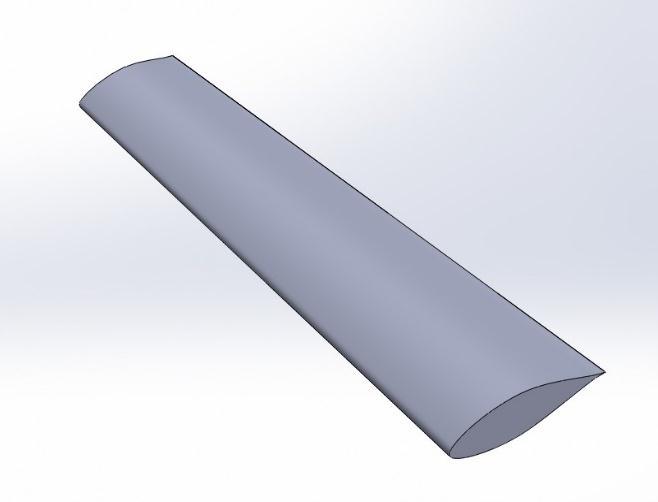
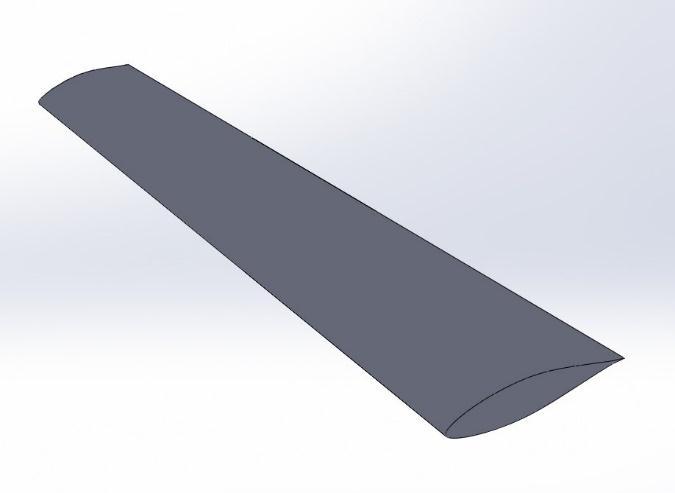
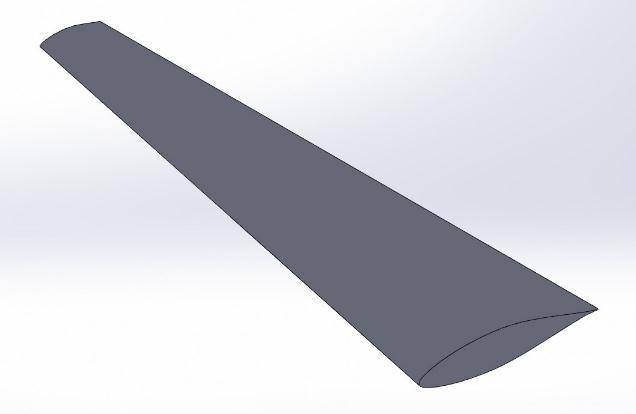
Fig -1:Wingwithdifferenttaperratio0.4
Fig -2:Wingwithtaperratio0.5
Fig -3:Wingwithtaperratio0.6
International Research Journal of Engineering and Technology (IRJET) e-ISSN:2395-0056
Volume: 09 Issue: 11 | Nov 2022 www.irjet.net p-ISSN:2395-0072
Fig -4:Wingwithtaperratio0.7
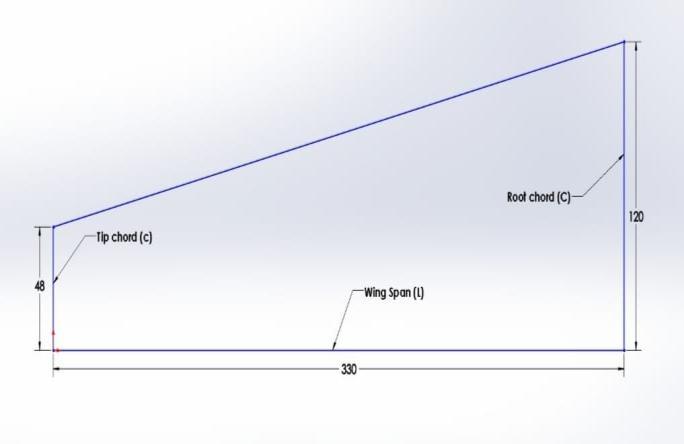
Fig -5:Wingwithtaperratio0.8
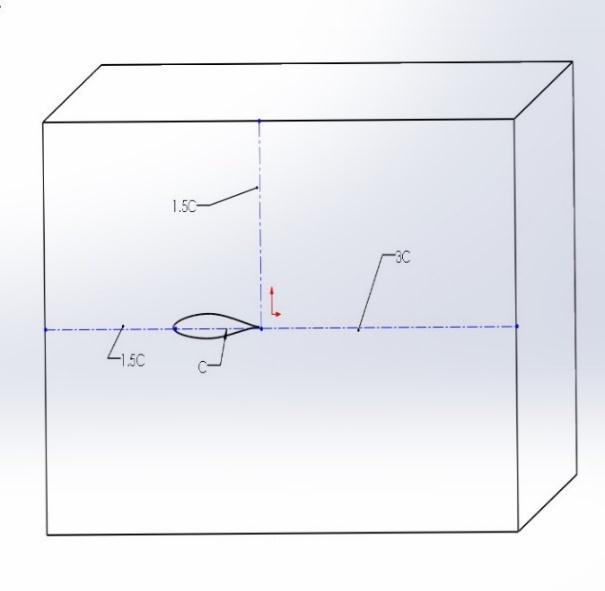
Fig -7:Topviewofwingwithdimensionsinmm
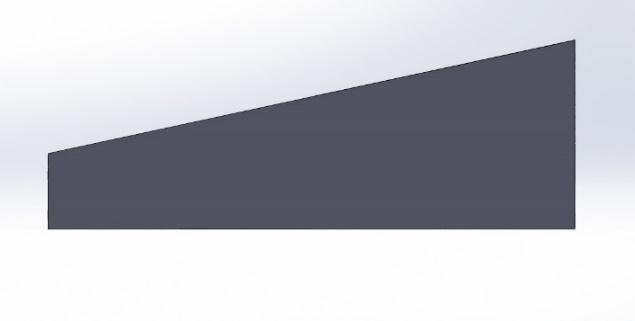
Fig -8:Computationaldomain
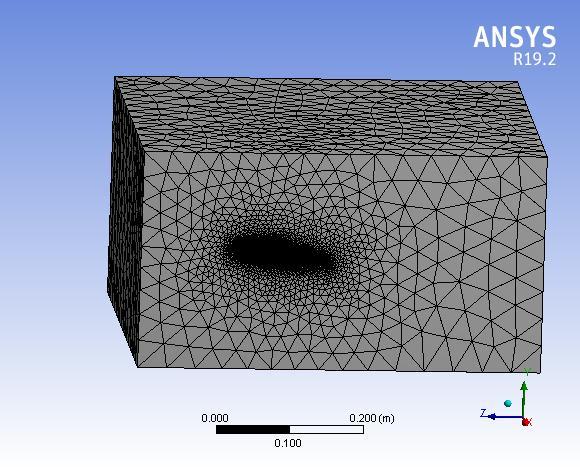
Mesh creation is the next stage after the model has been preparedforanalysisofvariouswingconfigurationsisshown inFig.8.Edgesizing,facesizing,andthetetrahedronpath conformingapproach,whichapproximate100000nodesand 3000000elementsforeachcomputationalanalysisafterthe performingthegridindependencytest,itshouldbeusedin the analysis to produce a more refined mesh. While using more cells often results in a more accurate numerical solution,doingsoalsorequiresmorecomputermemoryand longer computation times. five different mesh types were producedinordertoinvestigatetheresults'independence from cell number. Variation drag coefficient with no of elementshowninchart-1.respectively.Displaystheresults of these five meshes forthe CL and CD withthe numberof cellsatan8°AOAinataperwing.Thetimefor500000was almost1hour,whilethetimefor3000000wasroughly3to4 hours.
Fig -6:TopviewofWing
International Research Journal of Engineering and Technology (IRJET) e-ISSN:2395-0056
Volume: 09 Issue: 11 | Nov 2022 www.irjet.net p-ISSN:2395-0072
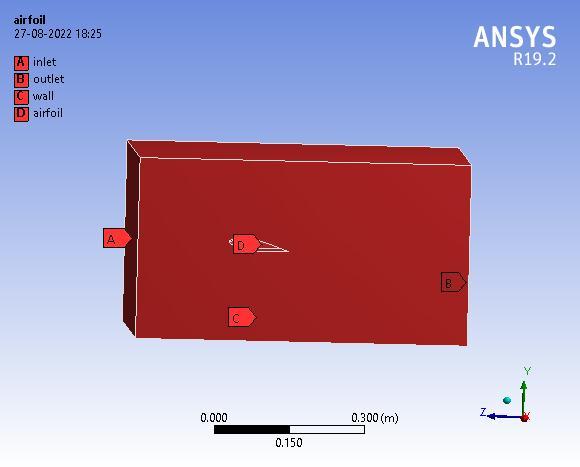
Fig -8:Meshing
CD vs No. of element
0.0846 0.0721 0.0682 0.06860.0683 0.06 0.065 0.07 0.075 0.08 0.085 0.09 0 2000000 4000000 6000000
C D No. of element
Chart -1:VariationofCDvsnoofelement
Atafreestreamvelocityof40m/s,thecomputationswere completed, yielding a Reynolds number of approximately 327931.AsdepictedinFig.-9,theflowregionismadeupof 4limitsthatformarectangularshapeisshowninFig-9and Table-2.Boundarycircumstancesareinordertocomplete the calculations, the Spallart-Allmarus model was used Followingpropertiesareusedforcomputationalstudy
Density -1.2225kg/m³
Viscosity-1.7894e-05kg/m-s
Pressure-101325Pa
Velocity-40m/s
Fig -9:Boundaryconditions
Bycomparingthecurrentresultstothosefromotherstudies, the CL, CD, and L/D ratio are all validated. Table 1. When comparedtodatagivenbyAhluwaliaetal.[1],theCDandCL measuredinthecurrentstudyfitstheirfindingsratherwell, isastudyofaNACA653-218aerofoil withastraightwing andastraightwingwithwingletsatan8°AOAand40m/s freestreamvelocity.
Table -1: Comparisonofoverawing'slift,drag,andliftto dragratioswithpreviouslyreportedfindings
Author Wingtype MachNo. CL CD Ahluwaliaet al.(2017) Rectangular 0.1 0.5121 0.0653
Present Taper 0.1 0.7077 0.0691
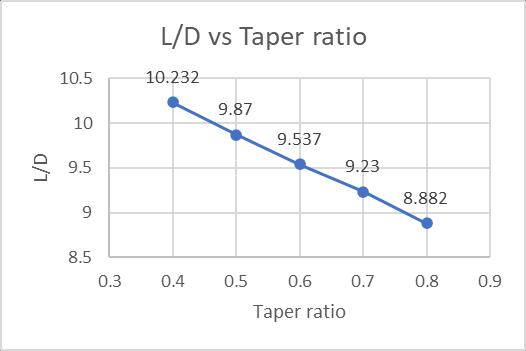
A number of analyses have been done on various wing modelsinordertodeterminetheefficiency ofthewingby comparingCL,CD,L/D.Wingmodelswithtaperratio0.4,0.5, 0.6,0.7and0.8atanangleofattackof8°areevaluatedusing a flowvelocityof0.1Mach.TheCL andCD werecalculated using the analysis's results for the lift and drag forces operatingonthewingprofile.TheCLCDL/Disobtainedby computational analysis is shown in Table-2 and plotted in Charts–1,2&3.
International Research Journal of Engineering and Technology (IRJET) e-ISSN:2395-0056
Volume: 09 Issue: 11 | Nov 2022 www.irjet.net p-ISSN:2395-0072
Table -2: CL,CDandL/Datdifferenttaperratio
Taperratio CL CD L/D
0.4 0.7077 0.0691 10.232 0.5 0.6929 0.0702 9.870 0.6 0.6804 0.0713 9.537 0.7 0.6751 0.0721 9.222 0.8 0.6502 0.0732 8.882
Chart -4:VariationofL/Dvstaperratio
C L Taper ratio
Chart -2:VariationofCL vstaperratio 0.707 0.6929 0.6804 0.6751 0.6502 0.64 0.66 0.68 0.7 0.72 0.3 0.4 0.5 0.6 0.7 0.8 0.9
C D
Chart -3:VariationofCDvstaperratio 0.0691 0.0702 0.0713 0.0721 0.0732 0.068 0.069 0.07 0.071 0.072 0.073 0.074 0.3 0.4 0.5 0.6 0.7 0.8 0.9
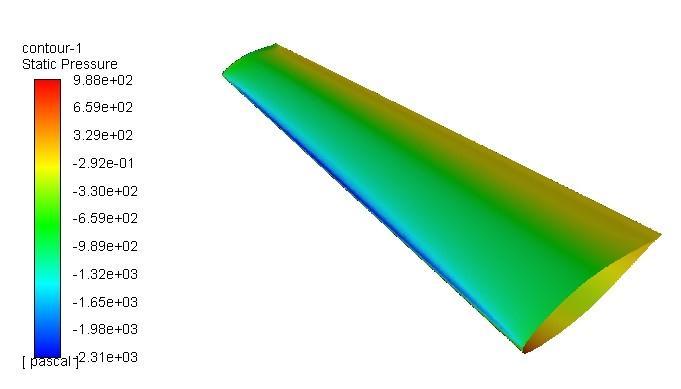
ContoursoftheupperstaticpressurefortheWinginFig.10 to Fig.-14. it is were forecasted for Wing at various taper ratios at 8° AOA. The Top surface is having a lower static pressure then bottom surface. As the taper ratio falls, the pressure losses that result from it also fall, making the pressuremoreuniformandreducingdrag.Thehighintensity blue area on the top surface having a minimum static pressureandbottomsurfaceredregionismaximumstatic pressure this pressure gradient is responsible for lift generation.
CD vs Taper ratio
Taper ratio
Fig -10:Pressurecontourofwingwithtaperratio0.4
International Research Journal of Engineering and Technology (IRJET) e-ISSN:2395-0056
Volume: 09 Issue: 11 | Nov 2022 www.irjet.net p-ISSN:2395-0072
Fig -11:Pressurecontourofwingwithtaperratio0.5
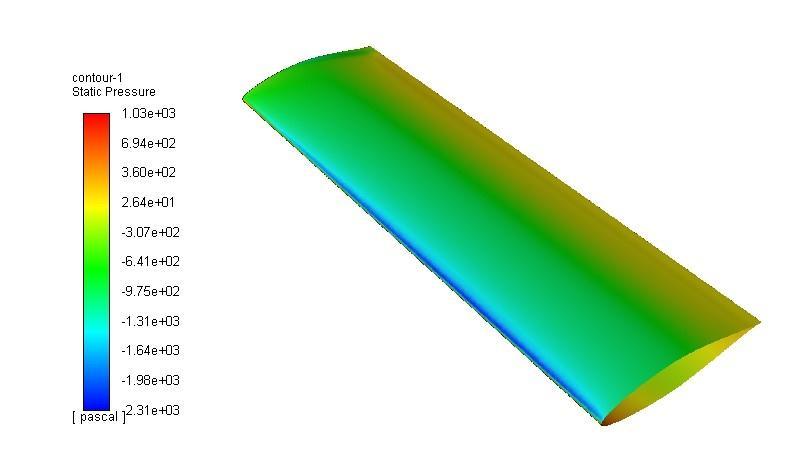
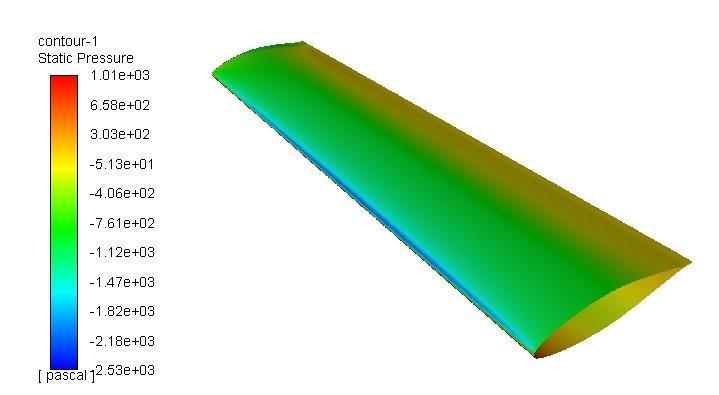
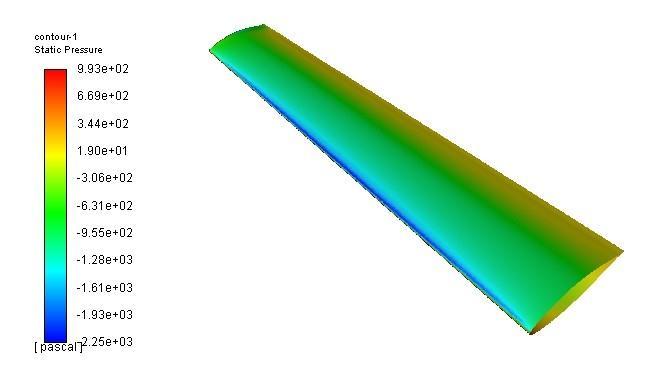
Fig -14:Pressurecontourofwingwithtaperratio0.8
Fig -12:Pressurecontourofwingwithtaperratio0.6
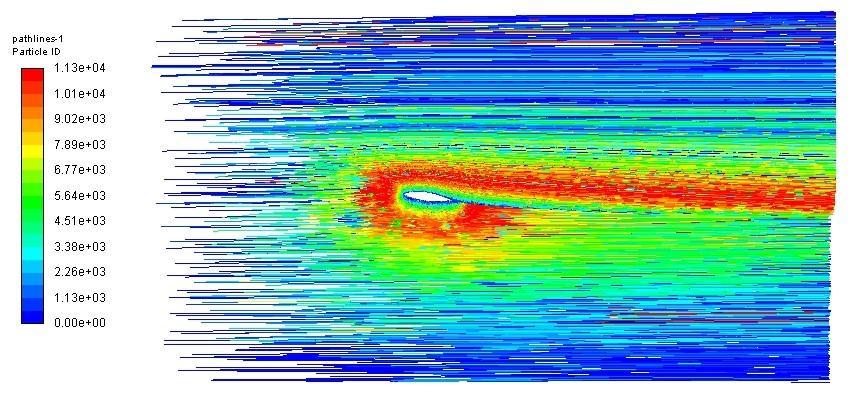
Thevortexgenerationofthepath-lineinthetaperedwing was caused by the pressure gradient between the top and bottom surfaces of the wing. When the taper ratio was lowered, the pressure difference increased, which in turn causedthevortexandwingdragtoincrease.Asexpected,the wingonlyexhibitsasinglesizablevortexatthewingtip.Itis simpletodeducetherotationsensefromthepath-line.This demonstratesthatfluideffectivelyhasastronginclinationto movefromlowertouppersurfaces.Path-linevortexisshown inFig.15andFig.16.
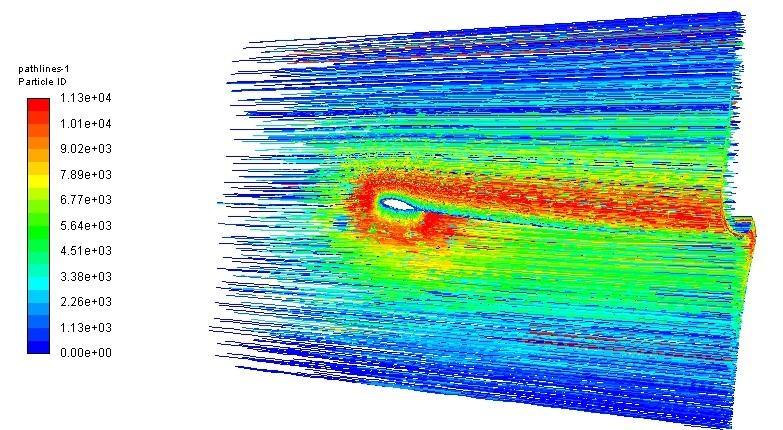
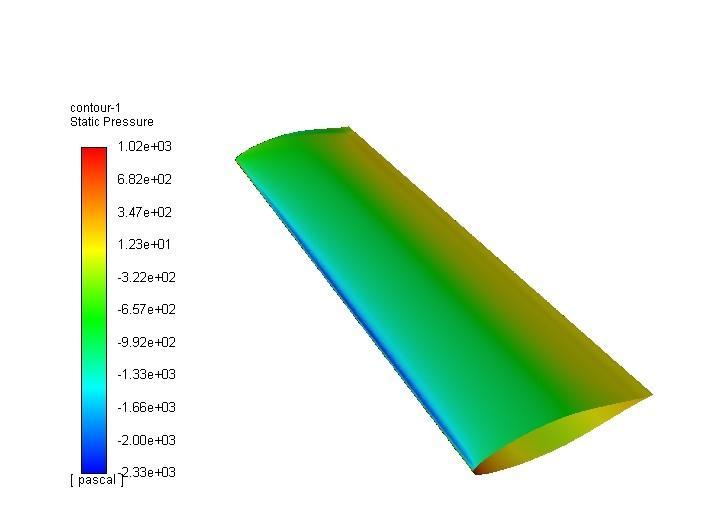
Fig -13:Pressurecontourofwingwithtaperratio0.7
Fig -15:Path-linesbehindthewing
International Research Journal of Engineering and Technology (IRJET) e-ISSN:2395-0056
Volume: 09 Issue: 11 | Nov 2022 www.irjet.net p-ISSN:2395-0072
[6] XiaoYuWang,SooyoungLee,PilkeeKimandJongwon Seok. “Aerodynamic effect of 3d pattern on airfoil” ICETI-2014J1031_SCINo.15-CSME-31,E.I.C.Accession 3806
[7] Swarna Mayuri Kumar. “Aerodynamic Design and AnalysisofaBlendedWingBodyUAV Configuration” International Journal of Engineering Research & Technology2022
[8] JohnD.Anderson,Jr.,“Fundamentalsofcomputational FluidDynamics”,McGrawHillInternationalEditions.
Fig -16:Path-linesonthewing
Inthiswork,severaltaperratioswerenumericallyanalysed withtheintentionofexaminingtheimpactsoftaperratioon aerodynamic characteristics of wing. A rectangular wing model was modified into five different versions with differenttaperratiosatthesameaspectratioandrootchord inordertocomparetheiraerodynamicproperties.Following theevaluationoftheprogram'smeshaccuracy,theinduced drag and lift coefficients along with the span-wise lift distribution were examined for all the models with taper ratiosbetween0.4and0.8(withanincrementof0.2).This work showed that as the L/D ratio increased and drag decreasedalongwiththedecreasingtaperratio,ifdragwill bereduceditisfavourtolessfuelconsumption
[1] Shivam Kapil Ahluwalia, Vaibhav Negi, Nayan Anand, Varun Goyal, Raj Kumar Singh. “CFD Analysis on DifferentShapesofwingletatLowSubsonicFlow”.2017.
[2] Bergmann, A., Huebner, A., and Loeser, T. (2008). “Experimental and numerical research on the aerodynamicsofunsteadymovingaircraft”.Progressin Aerospace Sciences, 2008. 44(2): p. 121-13. Doi:10.1016/j.paerosci.2007.10.0
[3] Zhang,P.F.,Wang,J.J.,Liu,Y.,Wu,Z.(2009).“Effectof taper ratio on aerodynamic performance of cropped nonslenderdeltawings”.JournalofAircraft,46(1),320325.
[4] Setyo Hariyadi S.P, “An analysis on Aerodynamics PerformanceSimulationof NACA23018AirfoilWings onCantAngles”,JournalofEnergy,Mechanical,Material, andManufacturingEngineering2017
[5] Manikantissar, Dr.Ankur geete. CFD Analysis of conceptualAircraftbody