International Research Journal of Engineering and Technology (IRJET) e-ISSN:2395-0056

Volume: 09 Issue: 11 | Nov 2022 www.irjet.net p-ISSN:2395-0072
International Research Journal of Engineering and Technology (IRJET) e-ISSN:2395-0056
Volume: 09 Issue: 11 | Nov 2022 www.irjet.net p-ISSN:2395-0072
Student, Dept. of Information Technology, Atharva College of Engineering Student, Dept. of Information Technology, Atharva College of Engineering ***
Abstract - Today technology has occupied such a significant part of our lives that it is almost impossible to imagine life without it. A myriad of technological advancements occurs every day, so much so that it is difficult to track all of them. Also, today every educational institutionhandlesanddealswithlargeamountsofstudent data which can be advantageous for a number of reasons. One of the most important applications of such data is predictingstudentperformance.
Integrating a Graphical User Interface (GUI) with Machine Learningalgorithmsisnotaneasytask.Hence,ourstudent performance predictor application implements the same bycombiningMachineLearningalgorithmsalongwithGUI which makes it easy and efficient to use. As a result, this prediction can be helpful to both, the students and teachers. Predicting the performance of students is a challenging task, because of the large amounts of informationstoredinacademicdatabases.Withthehelpof MachineLearning(ML)andArtificialIntelligence(AI),this proposed system can help to predict as well as analyze students' performance by not only considering their academic details but also other factors like study time, failures or backlogs, and so on. For this, we have used several approaches or algorithms such as Logistic Regression, Support Vector Machine (SVM), Naive Bayes, andK-NeighborsClassifierrespectively.
Through this task, we extract knowledge that describes students’ overall performance. It helps in identifying the strengthsandweaknessesofthestudentsbeforehand.And ultimately, this prediction can help students to enhance their performance in the future. In addition to this, our application also provides relations and patterns between theuserinputfieldina detailedandgraphicalmanner.The user can view these patterns and relations in the form of scatter plots, heat maps, box plots, histograms, dist-plot, violin-plot,etc.
Key Words: Prediction, Logistic Regression, Support Vector Machine, Machine Learning, Artificial Intelligence.
[4] The data stored in educational databases are rapidly growing. So, there must be an easy and efficient way to
handle this enormous data. Managing such large data and improving the academic performance of students is tough. Therefore, the main aim of this system is to predict the future performance of the student using certain data of the students such as previous semester marks, study time, etc. These predictions will not only help teachers to classify students based on predicted grades and suggest they focus on certain subjects, but will also help students improve their studying goals and improve their grades. We have evaluatedthe following algorithms by applying them to the dataset.
Thealgorithmsusedin this projectaresupervisedlearning algorithms. [1] Supervised Learning is the type of machine learning where machines are trained based on well "labelled" training data and based on this data, the machines predict the output. The labelled data means that someinputdataisalreadytaggedwiththecorrectoutput.
Starting with Logistic Regression, one of the most popular MachineLearningalgorithms.LogisticRegressionisusedto estimate discrete values, usually binary values like 0 and 1 from a set of independent variables. Next is the Support Vector Machine, which is used for classification and regressionproblems.ThegoalofSVMistogeneratethebest line or decision boundary which can separate ndimensionalspaceintoclassessothattheycaneasilyputthe new data point in the correct category in the future. Further, we have the Naive Bayes, based on the Bayes theorem. Bayes' theorem is also known as Bayes' Rule or Bayes' law, which is a method used to determine the probability of an event based on the occurrences of prior events. It is used to calculate conditional probability. Naïve Bayes Classifier is one of the simple and most effective algorithms used for classification which helps to build fast machine learning models that are capable of making quick predictions.And finally,wehavethe K-NeighborsClassifier isoneofthesimplestMachineLearningalgorithms.Itstores all availablecases and classifies them by taking a majority voteofitskNeighbors.
Outofthesealgorithms,Logistic Regression(LR)istheone that wehave implemented in our system as it provides the
International Research Journal of Engineering and Technology (IRJET) e-ISSN:2395-0056
Volume: 09 Issue: 11 | Nov 2022 www.irjet.net p-ISSN:2395-0072
best accuracy compared to other algorithms. Our student performance predictor is basically a web-based GUI applicationthatletsstudents,aswellasteachers,viewand analyze the student’s performance by simply entering details about the students such as their study time, previous grades, failures or backlogs, and many more. Thereareatotalofthreesectionsintheapplication.Firstis the home section which presents a brief description of all the above-mentioned algorithms along with the methodology.Second isthevisualizationsection.Here,the user can view differentthings like the original dataset, the pre-processed data, and various features such as mean, standarddeviation,andtheminimumandmaximumrange in the dataset, followed by an intricate graphical visualizationintheformofcharts,plotsandheatmapsand finally the accuracy of the model. Finally, we have the prediction section where the user needs to enter their details and submit them. After the submission, the performanceofthestudentwillbedisplayedintheformof agrade.Thestudentperformanceispredictedonthe basis of five grades from 'A' to 'E' where ‘A’ indicates excellent and‘E’indicatespoor.
The dataset used is taken from UCI Machine Learning Repository. This data is based on two Portuguese high schools. Student grades, demographic, social, and schoolrelated features are the data attributes and these were collected by using school reports and questionnaires. Among all the algorithms mentioned above, Logistic Regressionprovidedthebestaccuracywhichis93.16%.
LogisticregressionisoneofthemostwidelyusedMachine Learning algorithms, which is the most important part of theSupervised Learningtechnique. Logistic regression is a type of regression analysis that is used to predict the probability of abinary outcome. The outcome is either a success or a failure. The logistic regression model is used to estimate the probability of success based on one or more independent variables. Logistic regression predicts theoutputofanexplicitdependentvariable.
Thelogistic regressionmodel isalinearmodel thatcanbe used to predict the probability of a binary outcome. The modelis based on the logit function, which is the natural logarithmofthe odds of success. The logit function is used to model the relationship between the independent variablesandthebinaryoutcome.
Logistic Regression is a significant machine learning algorithm because it has the capability to provide probabilities and classify contemporary data using continuous and discrete datasets. The logistic regression model can be used to estimatethe probability of success based on the values of the independent variables. The model can be used to predict the probabilityofsuccessfor
newdata.Themodelcanalso beusedto identify the factors thatareassociatedwithahigherprobabilityofsuccess.
A support vector machine (SVM) is a supervised learning algorithm that is used mostly for classification and regressiontasks.Thealgorithmisadiscriminativeclassifier that not only finds the decision boundary between classes butalsotriestomaximizethemarginbetweentheseclasses. This results in a more robust model that is less likely to overfitthetrainingdata.
SVMsaremoreeffectiveinhigh-dimensionalspacesandare therefore well-suited for problems where there are many features, such as textclassification and image classification. Theyarealsoeffectiveincaseswherethenumberoftraining examplesissmall.
The main idea behind an SVM is to find a hyperplane that maximally separates the data points of one class from the data points of the other class. The main advantage of using anSVMisthatitisveryeffectiveinhigh-dimensionalspaces. ThisisbecausetheSVMfindsahyperplanebylookingatthe datapointsclosesttoit,whicharecalledsupportvectors.
In other words, we are looking for the hyperplane that has the largest margin between the two classes. Once we have foundthishyperplane,wecanuseittomakepredictionson newdatapoints.Ifwearedealingwithaclassificationtask, thenwecanpredictthatanewdatapointwillbelongtothe classthatisclosesttothehyperplane.Ifwearedealingwith aregressiontask,thenwecanpredictthevalueofthetarget variable for a new data point by taking the value of the targetvariablethatisclosesttothehyperplane.
The Naive Bayes algorithm is a simple probabilistic classifierthat is based on applying Bayes' theorem with strong (naive) independence assumptions between the features. The Naive Bayes algorithm is a simple, yet powerful machine learning technique for predictive modeling. It is a supervised learning algorithm that is based on the Bayes theorem of probability.The algorithm is designed to be "naive" in the sense that itmakesstrong assumptionsabouttheindependenceoftheinputfeatures.
Assumingthatwehaveadatasetwithtwofeaturesandtwo classes,wecanrepresentthejointprobabilitydistributionof thetwofeaturesandtheclasslabelsareasfollows:
P(X|Y)=P(Y|X)*P(X)/P(Y)
Where the probability that we are interested in calculating P(A|B) is called the posterior probability and the marginal probabilityoftheeventP(A)iscalledtheprior.
International Research Journal of Engineering and Technology (IRJET) e-ISSN:2395-0056
Volume: 09 Issue: 11 | Nov 2022 www.irjet.net p-ISSN:2395-0072
The Naive Bayes algorithm makes the following two assumptions:
1. Thefeaturesarenotdependentoneachother.
2. Theclasslabelsaremutuallyexclusive.
The Naive Bayes algorithm is commonly used in text classification tasks, such as spam detection or sentiment analysis. It is also often used in machine learning competitions,such as the Kaggle competitions. The Naive Bayes algorithm is trained on a training data set. The trainingdatasetisusedtoestimatetheprobabilitiesofthe various class labels and the probabilities of the various feature values. These probabilities are then used to make predictionsonnewdata.
The key advantage of the Naive Bayes algorithm is its simplicity.Itiseasytounderstandandimplement.Itisalso computationallyefficientandscalable.
Itisatypeofsupervisedmachine-learningalgorithm.KNNis anon-parametric and lazy learning algorithm where Nonparametric means there is no assumption for underlying datadistribution. In other words, you don’t need to know the data distribution to model the prediction. A lazy algorithm means that the algorithm does not need any training data points for model generation. This means modelingcanbeextremelyfast.Itstoresallconvenientcases and classifies the new data points based on a similarity measure(e.g.distancefunctions).TheK-NearestNeighbors (k-NN) algorithm is employed to solve both binary and multi-class problems. It is a non-parametric model that relies on proximity to define the relationship between instancesinthetrainingdataset.Thenumberofneighbors isrepresentedbytheparameterk.
The basic idea of the KNeighborsClassifier is to calculate the distance between a query and all the examples in the trainingdata.Thedistancecan,forexample,betheEuclidean distance between two vectors. Once the distance is calculated,youselectthetopKexamplesthatareclosestto thequery.
The majority of practical machine-learning applications canbe solved quite effectively by a few simple algorithms likelinearregressionorsupportvectormachines.However, thereare situations wheremore complex algorithms could be useful.In particular, the KNeighborsClassifier is a good choiceifyourdataisn’twell-describedbylinearmodelsand you need a non-linear model. KNN is a non-parametric method and simple algorithm that can be used for both classification and regression. KNN can be used for the classification ofdatawithmore than two classes. KNN can be used for regression by taking the average of the K nearestneighborsastheestimateofthedependentvariable foragivenindependentvariable.
Thisapproachhasseveraladvantages:
1. There’s no need to build a model, so you can avoid overfitting.
2. Thealgorithmiseasytounderstandandimplement.
3. All the data is utilized to build the nearest neighbor models.
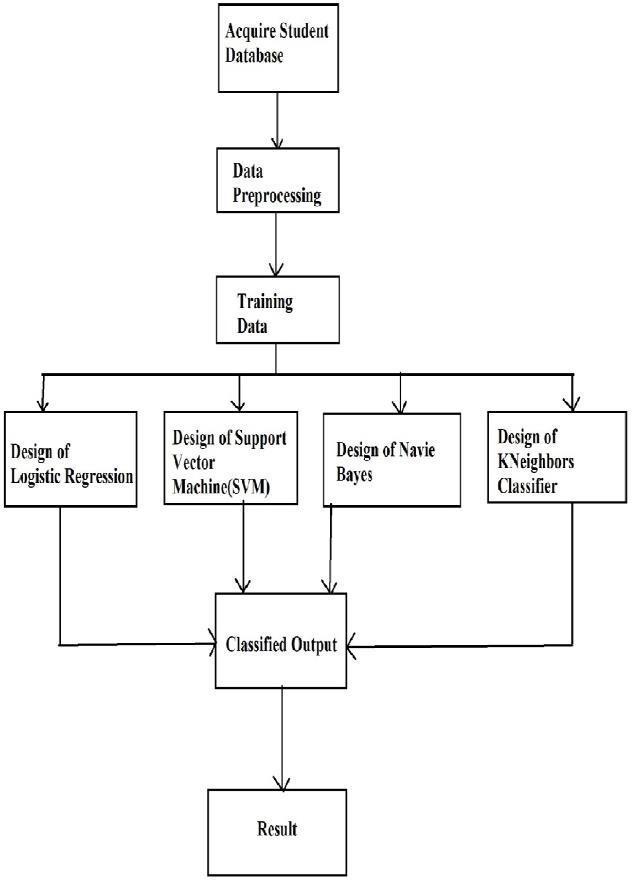
The methodology is the core component of any researchrelatedwork.Themethodsusedtogaintheresultsareshown inthemethodology.Here,thewholeresearchimplementation isdoneusingpython.Therearedifferentstepsinvolvedtoget theentireresearchworkdonewhichareasfollows:
Fig -1:MethodologyofStudentPerformancePredictor
The UCI machine learning repository is a collection of databasesanddatageneratorsthatareusedbythemachine learning community for analysis purposes. The student performancedatasetcanbeacquiredfromtheUCI machine learning repository which is one of the websites that are availablefordownloadingthedatasetsforfree.Thestudent file consists of two subjects’ CSV files namely student-
por.csv and student-mat.csv. Also, the dataset has multivariate characteristics. Since the data provided is not consistent and uniform, data-pre-processing is done for
e-ISSN:2395-0056
Volume: 09 Issue: 11 | Nov 2022 www.irjet.net p-ISSN:2395-0072
checking and correcting the inconsistent behavior of trendsinthedataset.
After, Data acquisition the next step is to make the data uniform and process the data. The Dataset fetched has object-type features that need to be converted into numerical type. Thus, using the python dictionary and mapping functions the transformation of the data in the datasetisdone.Thefinalvalueisafive-levelcategorization consistingof0i.e.excellentor'A'to4i.e.failor'F'.
The pre-processed dataset is further divided into two datasets namely the training dataset and the testing dataset. This is achieved by passing values like feature value, target value, and test size to the train-test split method of the sci-kit-learn package which makes the processeasier.
After dividing this data into training and testing, the training data is sent to the following neural network designs
i.e. Logistic regression, Naive Bayes, SVM, and KNeighborsClassifier for training the neural network, and then test data that is used to predict the accuracy of the trained network model for better and more efficient results.
The design of logistic regression and support vector machineinthepythonenvironmentisachievedthroughthe NeuPy package which requires the standard deviation valueasthemostimportantparameter.
Along with it, the network comprises 30 inputs neuron, a pattern layer, a summation layer, and a decision layer for five-level classification whereas the design of Naive Bayes and KNeighborsClassifier neural network in a python environmentisachievedthroughtheNeuPypackagewhich requires the number of input features, the number of classes i.e. the classification result outputneuron, learning rate. The network comprises 30 input features i.e. input neurons, ahidden layer,and the output layer for five-level classification.
Once the design for logistic regression, support vector machine,NaiveBayes,and KNeighborsClassifier isreadyit istrained with thetraining data for accurate classification, andthentestingdataisusedforthetrainedneuralnetwork.
After the training of the designed neural network, the testingoflogisticregression,supportvectormachine,Naive Bayes,andKNeighborsClassifierisperformedusingtesting data.Basedontestingdata,theaccuracyoftheclassifieris determinedandthealgorithmwiththemaximumaccuracy isusedforthebestpossibleoutcomeorprediction.
In this project, the highest accuracy is found in logistic regressionandhencethecalculationsandcomputationsare done using logistic regression. The computation may take sometimebuttheresultsdisplayedare93.16%accurate.
[2] At present, the Logistic Regression algorithm gives us thebestaccuracyamongalltheotheralgorithms.Butinthe future,ifanynewtechniqueorapproachisintroduced.
This might be better than Logistic Regression or the one which would provide better accuracy, implementation of that particular algorithm would be easy because the program via which the application is made is flexible and changescanbemadequitesmoothly.
[3] A student performance predictor is a tool that can be used byeducatorstohelpidentifystudents whomaybeat risk foracademic difficulties. This tool can be used to help target interventions and supports for those students who may needthem the most. In conclusion, the meta-analysis on predicting students' performance has motivated us to carry out further research which can be applied in our educationalinstitutes.Hence,thismodelwillbehelpfulfor the educational system to review the student’s performanceinasystematicmanner.
There are many possible directions for future work on studentperformance prediction. One direction could be to usemoresophisticatedmachinelearningmethods,suchas deep learning, to improve predictive accuracy. Another direction could be to incorporate additional data sources, such as dataon student demographics, into the predictive models.Anotherwaytoimprovethepredictorwouldbe to use a larger and more representative dataset. Finally, the predictorcouldbe mademoreuser-friendly,forexampleby providingagraphicalinterface.
[1] Ditika Bhanushali, Seher Khan, Mohammad Madhia, Shoumik Majumdar " StudentPerformance Prediction And Analysis”IJARCCE (2018)
International Research Journal of Engineering and Technology (IRJET) e-ISSN:2395-0056
Volume: 09 Issue: 11 | Nov 2022 www.irjet.net p-ISSN:2395-0072
[2] KalpeshP.Chaudhari“StudentPerformancePrediction SystemusingDataMiningApproach”IJARCCE(2017).
[3] Isha D Shetty “Student Performance Prediction” InternationalJournal ofComputerApplicationsTechnology andResearch(2019)
[4] Dr. Chandrashekhar Raut, “STUDENT PERFORMANCE PREDICTION USING DATA MINING TECHNIQUES”
International Research Journal of Engineering and Technology(IRJET)2020.
© 2022, IRJET | Impact Factor value: 7.529 | ISO 9001:2008 Certified Journal