International Research Journal of Engineering and Technology (IRJET) e-ISSN:2395-0056

Volume: 09 Issue: 11 | Nov 2022 www.irjet.net p-ISSN:2395-0072
International Research Journal of Engineering and Technology (IRJET) e-ISSN:2395-0056
Volume: 09 Issue: 11 | Nov 2022 www.irjet.net p-ISSN:2395-0072
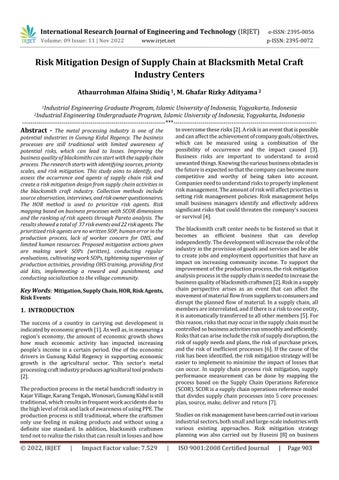
1Industrial Engineering Graduate Program, Islamic University of Indonesia, Yogyakarta, Indonesia
2Industrial Engineering Undergraduate Program, Islamic University of Indonesia, Yogyakarta, Indonesia ***
Abstract - The metal processing industry is one of the potential industries in Gunung Kidul Regency. The business processes are still traditional with limited awareness of potential risks, which can lead to losses. Improving the business qualityofblacksmiths canstart withthesupplychain process. The research starts with identifying sources, priority scales, and risk mitigation. This study aims to identify, and assess the occurrence and agents of supply chain risk and create a risk mitigation design from supply chain activities in the blacksmith craft industry. Collection methods include source observation, interviews,andriskownerquestionnaires. The HOR method is used to prioritize risk agents. Risk mapping based on business processes with SCOR dimensions and the ranking of risk agents through Pareto analysis. The results showeda totalof 37 riskevents and22riskagents.The prioritizedriskagents are no written SOP, humanerror inthe production process, lack of worker concern for OHS, and limited human resources. Proposed mitigation actions given are making work SOPs (written), conducting regular evaluations, cultivating work SOPs, tightening supervision of production activities, providing OHS training, providing first aid kits, implementing a reward and punishment, and conducting socialization to the village community.
Key Words: Mitigation, Supply Chain, HOR, Risk Agents, Risk EventsThe success of a country in carrying out development is indicatedbyeconomicgrowth[1].Aswellas,inmeasuringa region's economy, the amount of economic growth shows how much economic activity has impacted increasing people's income in a certain period. One of the economic drivers in Gunung Kidul Regency in supporting economic growth is the agricultural sector. This sector's metal processingcraftindustryproducesagriculturaltoolproducts [2]
Theproductionprocessinthemetalhandicraftindustryin KajarVillage,KarangTengah,Wonosari,GunungKidulisstill traditional,whichresultsinfrequentworkaccidentsdueto thehighlevelofriskandlackofawarenessofusingPPE.The productionprocessisstilltraditional,wherethecraftsmen only use feeling in making products and without using a definite size standard. In addition, blacksmith craftsmen tendnottorealizetherisksthatcanresultinlossesandhow
toovercometheserisks[2].Ariskisaneventthatispossible andcanaffecttheachievementofcompanygoals/objectives, which can be measured using a combination of the possibility of occurrence and the impact caused [3] Business risks are important to understand to avoid unwantedthings.Knowingthevariousbusinessobstaclesin thefutureisexpectedsothatthecompanycanbecomemore competitive and worthy of being taken into account. Companiesneedtounderstandriskstoproperlyimplement riskmanagement.Theamountofriskwillaffectprioritiesin setting risk management policies.Risk management helps small business managers identify and effectively address significantrisksthatcouldthreatenthecompany'ssuccess orsurvival[4].
Theblacksmithcraftcenterneedstobefosteredsothatit becomes an efficient business that can develop independently.Thedevelopmentwillincreasetheroleofthe industryintheprovisionofgoodsandservicesandbeable tocreatejobsandemploymentopportunitiesthathavean impact on increasing community income. To support the improvementoftheproductionprocess,theriskmitigation analysisprocessinthesupplychainisneededtoincreasethe businessqualityofblacksmithcraftsmen[2].Riskinasupply chain perspective arises as an event that can affect the movementofmaterialflowfromsupplierstoconsumersand disrupttheplannedflowofmaterial.Inasupplychain,all membersareinterrelated,andifthereisarisktooneentity, itisautomaticallytransferredtoallothermembers[5].For thisreason,risksthatmayoccurinthesupplychainmustbe controlledsobusinessactivitiesrunsmoothlyandefficiently. Risksthatcanariseincludetheriskofsupplydisruption,the riskofsupplyneedsandplans,theriskofpurchaseprices, andtheriskofinefficientprocesses[6].Ifthecauseofthe riskhasbeenidentified,theriskmitigationstrategywillbe easier to implement to minimize the impact of losses that can occur. In supply chain process risk mitigation, supply performance measurement can be done by mapping the process based on the Supply Chain Operations Reference (SCOR).SCORisasupplychainoperationsreferencemodel thatdividessupplychainprocessesinto5coreprocesses: plan,source,make,deliverandreturn[7].
Studiesonriskmanagementhavebeencarriedoutinvarious industrialsectors,bothsmallandlarge-scaleindustrieswith various existing approaches. Risk mitigation strategy planning was also carried out by Huseini [8] on business
International Research Journal of Engineering and Technology (IRJET) e-ISSN:2395-0056
Volume: 09 Issue: 11 | Nov 2022 www.irjet.net p-ISSN:2395-0072
processes at PT Benua Multi Guna by combining FMEA, SCOR,andHORapproachestogettherightriskmitigation design.IntheSMEsector,riskanalysisandmitigationplans in the supply chain can also be carried out using the HOR methodapproachandsystemdynamics[1].Riskmitigation in the nata de coco supply chain has also succeeded in identifyingtheprioritycausesofriskandproducingseveral riskmitigationstrategiestoreducethecausesofriskusing theSCORandHORmodelapproaches[6]
Research at the center of the blacksmith metal craft processing industry was conducted to be able to identify risks,minimizetheimpactandcontroltherisksthatexistin thesupplychain.TheSCORapproachtoidentifyingsupply chainworkactivitiesisbasedon5processes(plan,source, make,deliverandreturn),anddeterminesthesourceofrisk prioritiesandappropriateriskhandlingprioritystrategies usingtheHOR(HouseofRisk)method.TheHORmodelisa modificationoftheFMEA(FailureModeandEffectAnalysis) modeltoquantifyrisk.TheHOQ(HouseOfQuality)modelis usedtoprioritizeriskagentsthatneedtobeaddressedfirst anddeterminethemosteffectivemitigationactionsthatmay be caused by risk agents [1] Systematically, this method consistsoftwophases:theriskandriskcauseidentification phase(Houseofriskphase1)andtheriskhandlingphase (Houseofriskphase2).IntheHOR1phase,thedominant riskcauseisdeterminedbycalculatingtheAggregateRisk Potential (ARP) value. In the HOR 2 phase, the dominant risk-handlingstrategyisdeterminedbyconsideringtheease of implementing the strategy and the level of correlation between the strategy and the cause of the risk [7]. This research is expected to help in system improvements by appropriatelyhandlingexistingrisks.
Theword'risk'isusedinterchangeablyintheliterature withwordssuchas'danger'and'uncertainty'andhasseveral connotations. There is no common definition used by researchers in this field. The term risk is used to describe positiveandnegativeoutcomes(lossanddamageandgainor profit),morecommonlyusedtorefertothelatter[9] Risk leads to uncertainty over an event during a certain time intervalwheretheeventcausesaloss,beitasmalllossthatis not so significant or a large loss that affects a company’s survival.Riskisgenerallyseenassomethingnegative,suchas loss,danger,andotherconsequences.Theselossesareaform of uncertainty that should be understood and managed effectivelybytheorganizationaspartofthestrategysothatit can become added value and support the achievement of organizationalgoals.
HouseOfRisk (HOR) analysisisa methodforproactive riskmanagement,wheretheidentifiedcausesofriskcanbe managedbyprovidinganorderbasedonthemagnitudeof theimpactthatmaybecaused.HORanalysisisdividedinto2
stages,namely,HOR1isusedtodeterminewhichcausesof riskareprioritizedforpreventiveaction,andHOR2isused toprioritizepreventiveactionbyconsideringcost-effective resources.
AnalyzetheHORmodel’smostdominantcauseofriskby calculating the Aggregate Risk Potential (ARP) value. The ARPcalculationisusedtoprioritizeriskagentsthatneedto beaddressedfirsttofindmitigationactionsorpreventive actionsagainstthem.WheretheARPcalculationformulais:
ARPj=OjΣSiRij
Where:
ARPj:AggregateRiskPotentialofriskagentj
Oj:Probabilityvalue(occurrence)ofriskagentj
Si:Riskimpactvalue(severity)ofriskeventIoccur
Rij:Correlationvaluebetweenriskagentjandriskeventi
After each risk agent’s ARP value is obtained, the ARP valueisrankedstartingfromthelargest.ThisARPranking uses an 80:20 Pareto diagram which is taken into consideration in determining risk-handling priorities. The applicationofParetolawinriskmanagementisthat80%of company losses are caused by 20% of the main risks. By focusing on 20% of the main risks, it is expected that the company'sriskimpactof80%canberesolved.Theoutput results of HOR phase 1 will be the input for HOR phase 2 data.
This research uses the House of Risk (HOR) methodology. This HOR method contains steps and a foundation for identifying, analyzing, evaluating risks, and designing mitigation strategies in the supply chain process of a company.Thismethodfocusesonpreventiveactionssuchas reducing the likelihood of risk agents appearing so that supplychainriskmanagementismoreproactive.Thestages ofthisresearchmethodinclude:
This preparation stage is carried out by selecting the object of research, observing the company's supply chain, formulatingproblems,andconductingliteraturestudiesthat supporttheresearchprocess.
At this stage, data collection is carried out by mapping supply chain activities and classifying them based on the SCORmodel.ThenfromeachSCORprocess,theriskevents that arise are identified and the level of loss impact (severity)isdetermined.Aftertheriskeventandtheimpact levelaredetermined,identifytheriskcausativeagent.Risk causativeagentsarefactorsthatcausetheoccurrenceofa
International Research Journal of Engineering and Technology (IRJET) e-ISSN:2395-0056
Volume: 09 Issue: 11 | Nov 2022 www.irjet.net p-ISSN:2395-0072
risk event. Each risk causative agent is measured by the probability ofoccurrence valuebasedonthefrequency of occurrencethatcancauselosses.Aftertheriskeventsand agents are identified, determine the correlation value or relationshipbetweenthetwo.Datarelatedtoriskeventsand risk causative agents are collected by brainstorming and interviews, were conducted with 6 owners of blacksmith craftsmen.
c. Data processing and risk analysis stages (HOR phase1)
At the stage of processing risk event data and risk causative agents using Microsoft Excel. This stage aims to analyzethemostdominant causeofrisk andcalculatethe AggregateRiskPotential(ARP)valuebasedontheseverity oftheriskeventandtheprobabilityvalue(occurrence)of theriskcausativeagent.Thisphasehelpsdeterminepriority riskfactorsforpreventiveaction.Table1istheHORPhase1 template[10]
Table -1: HORphase1
Process Risk Event (Ei) RiskAgent(Ai) Severityof riskevent (Si) A1 A2 A3 An
Plan E1 Rnn S1 E2 S2 Source E3 S3
Make Deliver Return En Sn
Occurrence of agentj O1 O2 O3 On Aggregaterisk potential j ARP1 ARP2 ARP3
Priority rank of agentj P1 P2 P3 Pn
Information:
A1,A2,A3,…,An =RiskAgent
E1,E2,E3,…,En =RiskEvent
O1,O2,O3,…,On = Occurrence value of the risk agent (Ai)
S1,S2,S3,…,Sn =Severityvalueofriskevent(Ei)
ARP1,ARP2,…,ARPn=AggregateRiskPriority P1,P2,P3,…,Pn =RankingofriskagentsbasedonARP values
Thenextstageistocollectriskmitigationactionsrelated tothemainriskcausativeagentsthatareprioritizedtobe addressed.Thisriskmitigationactiondatacollectionagain usesbrainstormingandinterviewmethods.Riskmitigation actions that have been identified by company owners and employeesarethendeterminedbythelevelofdifficultyin theirimplementation.
Atthisstage,whatisdoneistocorrelatetheresultsofthe HOR phase 1 risk analysis (priority risk agents) and the identified mitigation actions. This correlation relationship will be taken into consideration in determining the effectivenesslevelngtheprobabilityofriskagentsoccurring. The output of HOR phase 1 is used as the input for this second phase. Table 2 below is the HOR Phase 2 template [10]
Table – 2: HORphase2
Tobetreatedrisk agent(Ai)
PreventiveAction(PAk) Aggregate RiskPriority (ARP) PA1 PA2 PA3 PAn
A1 E11 E12 E13 PAn ARP1 A2 E12 E22 ARP2 A3 E13 ARP3 An Enn ARPn Total Effectiveness ofAction(TEk) TE1 TE2 TE3 TEn
Degree of Difficulty Preforming Action (Dk)
Effectiveness to Difficulty Ratio (ETD)
D1 D2 D3 Dn
ETD 1 ETD 2 ETD 3 ETD n
Rank R1 R2 R3 Rn
Information:
A1,A2,…,An = Riskagentwhowaselectedtodo thehandlingof
P1,P2,…,Pn =Preventiveactiontobeperformed E11,E12,…,Enn = Correlation between preventive actionandriskagent
ARP1, ARP2, ..., ARPn = Aggregate Risk Priority from risk agent
TE1,TE2,…,TEn = Total effectiveness of preventive action
value:
International Research Journal of Engineering and Technology (IRJET) e-ISSN:2395-0056
Volume: 09 Issue: 11 | Nov 2022 www.irjet.net p-ISSN:2395-0072
D1,D2,…,Dn = Degree of difficulty in the implementationofpreventiveaction
ETD1,ETD2,…,ETDn = Total effectiveness of divide by degreedifficulty
R1,R2,…,Rn =Rankofpreventiveactionbasedon asequenceofgradesETDhighest
The identification process is carried out on all types of risksinherentineachactivitythatcanpotentiallyharmthe company (Haryania et al., 2020). The results of data collectionandriskidentificationareobtainedintheformof riskevents.Riskeventsaremappedbasedonsupplychain activities with the SCOR model. The results of risk event identificationareshownintable3.
Afterobtainingriskevents,thenextprocessistoidentify riskagentsthatcauseriskevents.Theresultsofidentifying riskagentsaregivenascoreorvalueofthepotentiallevelof acauseofriskevents(occurrence)presentedintable4.
Table - 3: Riskeventidentificationresults
E1 Rawmaterialplanningerror 7
E2 Theunpreparednessofproductionfacilities 4
E3 Orderfromcustomersatthesametime 7
Business Processes Activity Code RiskEvent Severity Plan Production Planning
E4 Rawmaterialpriceincreases 4
E5 Asuddenchangeoforder 6
Raw material order
Source
Raw material distribution
E6 Makesuddenpurchasesofrawmaterials 6
E7 Thequantityandspecificationsofraw materialsdonotmatchtheorderdetails 4
E8 Delayedrawmaterialdistribution 5
E9 Rawmaterialdefects 4
E10 Rawmaterialsarenotplacedina predeterminedplace 5
E11 Employeeindiscipline 7
E12 Mis-hitduringtheironforgingprocess 6
Make Production Processes
E13 Hotironescapesfromthepinchandis exposedtohandsduringtheforgingprocess 6
E14 Eyesexposedtoirondust 5
E15 Workershaveshortnessofbreath 3
E16 Therewasacollisionofstrikingtools betweenworkers 6
Factor value:
International Research Journal of Engineering and Technology (IRJET) e-ISSN:2395-0056
Volume: 09 Issue: 11 | Nov 2022 www.irjet.net p-ISSN:2395-0072
E17 Workersexposedtosplashesofironflakes 7
E18 Ironcuttingisnotaccordingtosize 4
E19 Noiseeffects 5
E20 Ironforgingdoesnotfitthedesiredpattern 6
E21 Ironsmoothingisnotneatandsharp 5
E22 Workersexposedtogrindingtools 4
E23 Ironoverheatingormelting 5
E24 Theblowerisnotworkingproperly 3
E25 Grindingtoolsarenotworkingproperly 4
E26 Productmanufacturingdefects 6
E27 Productionstopped 5 E28 Poweroutages 3 E29 Productiontargetnotachieved 5
E30 Woodandmetalhandlescannotbe assembled 4
Product checking E31 Productsarenotpackaged 5 E32 Inaccuratewhencheckingproductionresults 5
Deliver
Product shipping E33 Productdeliverydelays 5 E34 Productdamageduringtheshippingprocess 3
Self-pickup ofproducts E35 Productpickupisnotatthepromised 6
Return Product returns E36 Additionalcostexpenditures 4 E37 Customercomplaints 5
2022, IRJET | Impact Factor value: 7.529 | ISO 9001:2008 Certified
International Research Journal of Engineering and Technology (IRJET) e-ISSN:2395-0056
Volume: 09 Issue: 11 | Nov 2022 www.irjet.net p-ISSN:2395-0072
A1 Uncertainandfluctuatingdemandfor products 6
A2 Scarcityofrawmaterials 5
A3 Thereisnoapplicationofmethodsin purchasingrawmaterials 6
A4 Maintenance of production equipmentisnotcarriedoutregularly 3
A5 Limitedhumanresources 7
A6 Lackofsupplierpartners 3
A7 Communicationwithsuppliersisless intensive 4
A8 Thesupplierlocationisfaraway 5
A9 Suppliersexperienceobstacleswhen distributingrawmaterials 4
A10 Poorqualityofrawmaterials 4
A11 Badweather 4
A12 ThereisnowrittenSOP 7
A13 LackofworkerawarenessofOHS 7
A14 Workerfatigue 6
A15 Human error during the production process 6
A16 Delaysintheproductionprocess 4
A17 Qualitycontrolofproductsislacking 4
A18 Less intensive communication with retail/customers 5
A19 Limitedtransportationequipment 4
A20 Product damage during product delivery 3
A21 Finished products are not to the customer'sliking 4
A22 Replacementofdefectiveproducts 3
Determinationofpriorityriskcausativeagentsusingthe HORphase1model.Atthisstage,theidentificationofrisks andriskagentsiscarriedout,providingriskvaluesbasedon severity,occurrence,andcorrelation,aswellascalculating theAggregateRiskPotential(ARP)value.Thedominantrisk isdeterminedbasedonthehighestARPvaluetotheriskwith the lowest ARP value. From the data obtained from the
identification of risk eventsand risk causative agents, it is analyzedtoobtainthepriorityofriskcausativeagentsthat needtobeaddressedbasedontheARPvalue.
Basedontheresultsobtainedfromthecalculationofthe AggregateRiskPotential(ARP)ofeachriskagent,thenext step is to evaluate the risk using a Pareto diagram. Pareto diagramsareusedtohelpfindproblemsthatareprioritized toberesolvedimmediately.Figure1showsaParetodiagram oftheriskagentassessment:
Fig -1:ParetoDiagramHORphase1
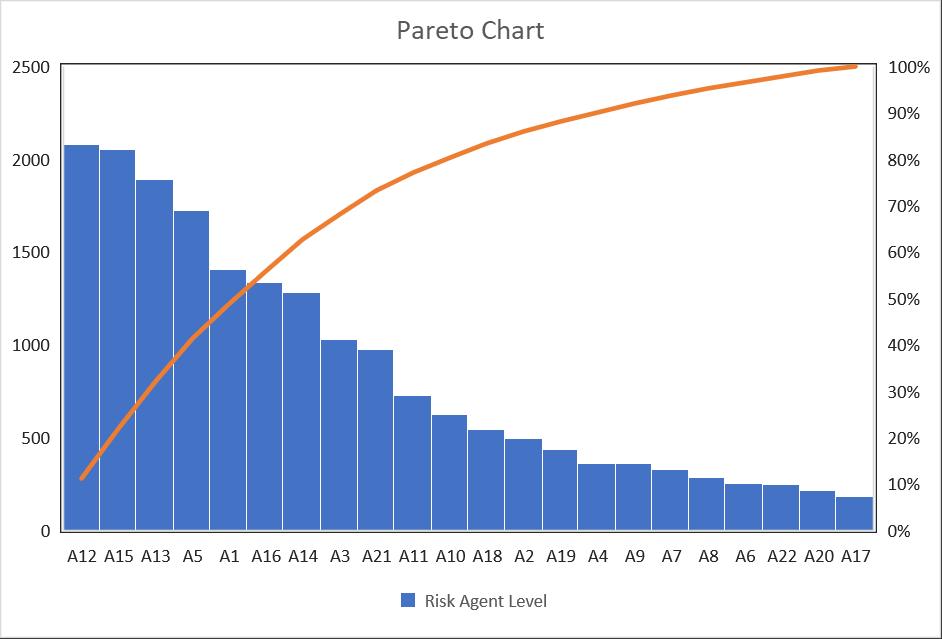
Basedontheanalysis,fourdominantriskagentshavethe greatestriskimpactonthismetalworkingbusiness.Thefour riskagentsintable5arepriorityriskagentsthatneedtobe addressedinthesupplychainprocess.
Thepriorityoftheriskcausativeagentsobtainedneedsto be addressed and then the identification of preventive or mitigationmeasuresiscarriedoutsothatthepotentialfor riskeventscanbereduced.Thedesignofriskmitigationis determinedbasedonthewillingnessoftheironcraftsmento applyanddetermineappropriateriskmitigationstrategiesas shownintable6.
International Research Journal of Engineering and Technology (IRJET) e-ISSN:2395-0056
Volume: 09 Issue: 11 | Nov 2022 www.irjet.net p-ISSN:2395-0072
Table – 5: PriorityofriskcausativeagentsbasedonARP
Code RiskAgent ARP Percentage Cumulative Severity Occurrence
A12 NowrittenSOPs 2079 11.06% 11.06% 7 7
A15 Humanerrorduring production 2052 10.92% 21.99% 7 6
A13 Lackofworkers' awarenessofOHS 1890 10.06% 32.04% 8 7
A5 Humanresources limitations 1722 9.16% 41.21% 8 7
–
Code RiskMitigation
Difficulty Scale
PA1 MakeSOP(written) 3
PA2 CultivatingworkSOPs 3
PA3 Tightensupervisionofproduction processactivities 3
PA4 Carryoutregularevaluations 3
PA5 ProvideOHStrainingtoworkers 4
PA6 Provideafirstaidkitatthe workplace 3
PA7 Conductoutreachtovillage communitiesregardingblacksmith prospects
5
PA8 Implementingarewardand punishmentsystemforemployees 5
A risk mitigation strategy is one of the activities to manage and monitor risks, make measurements of risk mitigationstrategies,reducetheimpactofrisks,andreduce the possibility of a risk occurring. Based on the risk agent obtained,ariskmitigationstrategyisthendeterminedbased onaliteraturereview,anddiscussionswithseveralexperts. To find out the validity of implementing this strategy, brainstorming was carried out with research subjects to determinetheirabilitytoapplyriskmitigationstrategiesthat includeHRreadinessandimplementationcosts.
Theblacksmithmetalprocessingindustrycenter,whichis theobjectofresearch,hascausedriskagents,limitedhuman resources, absence of clearly written SOPs, the lack of workers' concern for OHS and human error during the productionprocess.Toeliminatethecausesoftheserisks, riskmitigationismadeasshownintable7.Furthermore,the risk mitigation strategy can be made to schedule improvementsfromtheriskmitigationstrategyplanwiththe aim that this risk mitigation strategy plan can be implemented and carried out by the risk mitigation plan. Prioritasrencanamitigasirisikodapatdilihatpadatabel8. Table – 7: HORphase2
International Research Journal of Engineering and Technology (IRJET) e-ISSN:2395-0056
Table – 8: Riskmitigationstrategyplanpriority
Code RiskMitigation Effectiveness toDifficulty Ranking
PA1 MakeSOP(written) 18063 1
PA4 CultivatingworkSOPs 13905 2
PA2 Tightensupervisionof productionprocess activities 12519 3
PA3 Carryoutregular evaluations 11826 4
PA5 ProvideOHStrainingto workers 5791.5 5
PA6 Provideafirstaidkitat theworkplace 5670 6
PA8 Implementingareward andpunishment systemforemployees 4708.8 7
PA7 Conductoutreachto villagecommunities regardingblacksmith prospects 3099.6 8
ThedesignofmitigationstrategiesusingtheHouseofRisk methodresultedin37riskeventsand22riskagentswith4 priorityrisk-causingagents.The4mainriskprioritiesthat occur are no written SOPs, human error during the productionprocess,lackofconcernforworkers,andlimited humanresourcesobtainedthroughtheParetoprinciplethat occursinthemetalcraftprocessingindustrycenterarea.
Eightriskmitigationstrategieswerecreatedbasedonfour risk agents which were then ranked. Risk mitigation prioritiesincludemakingSOPs(written),cultivatingwork SOPs,tighteningsupervisionofproductionprocessactivities, carryingoutregularevaluations,providingOHStrainingto workers,providingfirstaidkits,conductingsocializationto thevillagecommunity regarding blacksmithingprospects, implementingarewardandpunishmentsystemforworkers.
[1] F.H.Azhra,“AnalisisRisikodanRencanaAksiMitigasi padaRantaiPasokMenggunakanMetodeHOR(House of Risk) dan System Dynamic,” Universitas Islam Indonesia,Yogyakarta,2021.
[2] M.G.R.Adityama,“AnalisisMitigasiRisikoRantaiPasok Menggunakan Metode HOR (House Of Risk) (Studi Kasus:KawasanSentraIndustriPengolahanKerajinan Logam Pandai Besi Desa Kajar I, Karang Tengah,
Volume: 09 Issue: 11 | Nov 2022 www.irjet.net p-ISSN:2395-0072 © 2022, IRJET | Impact Factor value: 7.529 | ISO 9001:2008 Certified Journal | Page910
Wonosari,GunungKidul),”Universitasislamindonesia, Yogyakarta,2020.
[3] R. Fitriyan, “Equipment Failure Risk Analysis Using Fmea To Improve Predictive Maintenance,” Institut TeknologiSepuluhNopember,2016.
[4] E.M.FalknerandM.R.W.Hiebl,“Riskmanagementin SMEs:asystematicreviewofavailableevidence,” J.Risk Financ., vol. 16, no. 2, pp. 122–144, Mar. 2015, doi: 10.1108/JRF-06-2014-0079.
[5] T. P. Adhiana and A. A. Sibarani, “Penentuan Mitigasi RisikopadaRantaiPasokIKMManufaktur,” Matrik,vol. 21, no. 1, pp. 19–28, 2020, doi: 10.30587/matrik.v21i1.1155.
[6] T. V. Sari, “Mitigasi risiko pada rantai pasok nata de coco studi kasus pada pt. daya agro mitra mandiri Ciputat,”UniversitasIslamNegeriSyarifHidayatullah, Jakarta,2018.
[7] T.ImmawanandD.K.Putri,“Houseofriskapproachfor assessingsupplychainriskmanagementstrategies:A case study in Crumb Rubber Company Ltd,” MATEC Web Conf., vol. 154, p. 01097, Feb. 2018, doi: 10.1051/matecconf/201815401097.
[8] A.Huseini,“PerancanganStrategiMitigasiRisikoPada Proses Bisnis Di PT. Benua Multi Guna Dengan Menggunakan Metode House Of Risk (HOR),” UniversitasIslamIndonesia,Yogyakarta,2018.
[9] L. C. Siang and A. S. Ali, “Implementation of Risk ManagementintheMalaysianConstructionIndustry,” J. Surv. Constr. Prop.,vol.3,no.1,pp.1–15,Jun.2012,doi: 10.22452/jscp.vol3no1.2.
[10] I.NyomanPujawanandL.H.Geraldin,“Houseofrisk:a model for proactive supply chain risk management,” Bus. Process Manag. J.,vol.15,no.6,pp.953–967,Nov. 2009,doi:10.1108/14637150911003801.