International Research Journal of Engineering and Technology (IRJET) e-ISSN:2395-0056

Volume: 09 Issue: 11 | Nov 2022 www.irjet.net p-ISSN:2395-0072
International Research Journal of Engineering and Technology (IRJET) e-ISSN:2395-0056
Volume: 09 Issue: 11 | Nov 2022 www.irjet.net p-ISSN:2395-0072
1 M.E. Student, Transportation Engineering, Shri G.S. Institute of Technology and Science, Indore, India 2 Junior Research Fellow, CE&AMD, Shri G.S. Institute of Technology and Science, Indore, India 3 Professor, CE&AMD, Shri G.S. Institute of Technology and Science, Indore, India ***
Abstract - India has developed phenomenally at a very fast pace during recent years and the Urban transport system is a key issue nowadays due to the incredible growth rate of population in urban areas and improper planning to accommodate the incoming population. To curb the problem of mass mobilization, the “Bus Rapid Transit System” has been opted countrywide under the JNNURM scheme with the main aim of providing a safe and quality transport system. Indore Bus Rapid Transit System has been working since May 2013 and has been successfully operating to serve as a dedicated corridor for rapid transit of bus passengers since then. The system in Indore has a 12.046km straight corridor along an old highway transecting the city and dealing with transiting heavy populations from one station to another. This study deals with the usefulness of the BRT system on the traffic of Indore city and its contribution towards the development of traffic and fulfilling the needs of citizens.
Key Words: BRTS, PCU, User Satisfaction, Mass Mobilization, Congestion.
Inthepresentscenario,themixedtrafficlanealongtheBRTS corridorfacesproblemsduetohugetrafficflow,including heavycongestionduringtheeveninghours.Suchproblems cause a lower level of service and also affect the growth opportunities of the city negatively. With the increase in urbanpopulationandthelivingstandardsofpeople,trafficis alsoincreasingrapidlyontheroadsofthecity,whichinturn results in mobility problems and congestion on the roads duetolessamountofavailablelandforwideningoftheroad. Thistrafficproblemneedstobesolvedtoreducethetraffic congestion on the roads. Due to the lack of good public transportationfacilitiesinvariousareas,thereisanincrease in private vehicles on the road or user-based vehicular growth. Due to this increase in vehicles, the city infrastructureneedstokeeppacewiththegrowthoftraffic volumebygivingthemaccesstorestrictedlanes(BRTlanes) andprovisions Oneofthekeysolutionstothisismassrapid transit.
BusRapidTransit(BRT)isahigh-qualitybus-basedtransit system that delivers fast, comfortable, and cost-effective
servicesatmetro-leveltrafficcapacities.Itdoesthisthrough the provision of dedicated lanes, with busways and iconic stationstypicallyalignedtothecenteroftheroad,off-board farecollection,alsofastandfrequentoperations.
TheIndiangovernmenturgedthecitytocreateabusrapid transit system through the JNNURM (Jawaharlal Nehru National Urban Renewal Mission) initiative,anda detailed BRTmasterplanwasdevelopedin2007withaproposalfora 120-kilometerroadnetworktobecompletedinthreephases. An 11.45-kilometer corridor along the Agra Bombay Road (ABroad),oneofthebusiestarterialsofthecity,waschosen forexecutionasapilotprojectfortheBRTmasterplan.The chosen corridor starts from Rajeev Gandhi Intersection to Niranjanpur Square. The project was started in 2007 and finishedinMarch2013afterovercomingvarioushurdles,and fullpassengerservicebeganinJune2013.
ThepurposeofthisstudyistocomparetheutilityofBRTS, itscontribution,anditsimpactonthecity'strafficsystem. Themainobjectivesofthisstudywillbe:
To ascertain the percentage of mode shift of passengerstoothermodesoftransportation.
To determine the present condition of traffic and comparingitwiththedesigncapacityofroads.
Tostudyoverallusersatisfactionbasedonvarious parametersofbusservices
Forecasting the future passenger growth rate in BRTSandfindingitsfeasibilityinfuture
[1]Muhammad Nadeem, Muhammad Azam et.al. (2021)
ThispaperevaluatestheperformanceoftheBRTsystemin Multan,basedonthepassengers’perceptionsandtheBRT standard scorecard. The data were collected at 21 BRT stations,andaface-to-facequestionnairesurveywascarried out with 420 users and it was found that around 54% of passengers are highly satisfied and opted for BRT due to comfort.ReliabilityanalysisconcludedthatmostoftheBRT stations possess the acceptable value (0.8 > α ≥ 0.7), with
International Research Journal of Engineering and Technology (IRJET) e-ISSN:2395-0056
Volume: 09 Issue: 11 | Nov 2022 www.irjet.net p-ISSN:2395-0072
onlysixoutof21stationscategorizedasunacceptable(α< 0.5).BRTSachievedanoverall79scoreandwasclassifiedas Silver-StandardBRT.Thestudysuggestscriticalinsightsto improvethecitizens’mobilitywiththeexistingBRTsystem, serving as a benchmark for policymakers and transport planners[1]
[2]Aditya
This paper analyses the traffic impact of Indore BRTS on mixed vehicle lanes of some intersections which suffered fromheavytrafficcongestionbeforetheimplementationof the BRTS. For the evaluation of the BRTS various traffic surveyswerecarriedoutatselectedintersectionsalongthe BRTScorridorwhichincludestrafficvolumestudy,volume capacity analysis, etc. and concluded that the traffic flow between the bottleneck section is high and exceeds the capacity of the section, The industry house intersection seemstobeheavilycongestedandsaturatedwhichcallsfor the redesigning of this intersection. The queue length observedat31.5msectioni.e.thebottlenecksectionofthe BRTS corridor is high as compared with the other similar roadsandintersectionsaroundthecity[2]
The paper aimed at evaluating the performance of the system based on the perception of services and improvementopportunities.Aquestionnairewasprepared and the opinion of 368 passengers was collected and analyzed.Itwasfoundthatonthemajorityofthequestions, thepassengershaveshownsatisfactionandoverwhelmingly appreciated the system. However, certain points require proper attention such as proper parking facilities in the surroundingsandproperfeederfacilitiesthatwillimprove theperformanceofthesystem[3]
[4]Chetan Kumavat, Harshal Sonawane. et al. (2016):
Thispaperemphasizesthecommonproblemsenduredby DelhiandPuneBRTScorridor.Thispapergivesanoverall outlookofDelhiandPuneBRTsystemsandobservedsome common problems in operating both systems some recommendations are mentioned that could help improve Pune BRTS immensely and influentially and have a better resultavoidingbottlenecksfacedbyDelhiBRTS.Thepresent studyintendedtohighlighttheproblemssuchas theLong Traffic signal cycle (4 minutes in the peak hour), Long queues,andPedestriancarelessness(i.e.walking,etc.),and toovercomethoseproblemssomegoodsolutionshavebeen provided[4].
[5]Tisa V. Agarbattiwala, Bhasker Vijaykumar Bhatt (2016)
The objective of this study is to analyze the existing performance of the Surat BRT system and to recommend
measurestoimproveandmaketheBRTsystemsustainable. Surat BRT system is in its initial stage at present, hence improvingitsperformancewillencouragepeopletousethe BRTsystemefficiently.TheperformanceoftheBRTsystem isanalyzedbyservicequalityandusersatisfactionsurveys. The present study is carried out with the objectives to exploretheperformanceoftheexistingBRTsystemwithin the study area and analyze user satisfaction based on a surveyforservicesrenderedinfutureBRTsystems[5]
[6]Dr. Md. Mazharul Hoque, Dhrubo Alam et.al (2013)
In this paper, an attempt has been made to discuss the concepts,needs,andopportunitiesoftheBRTsystem.The paper in particular highlights Dhaka's transport problem characteristics and the potential of the implementation of theBRTsystemforenhancedandimprovedpublictransport servicesinDhaka[6]
[7]Anuj Jaiswal, K. K. Dhote (2012)
One of the most important technical innovations in the transportation field involves the way bus services are operatedandinfrastructureisusedtooptimizetheirspeed, comfort,andcapacity.Ahmadabadhasbecomethefirstcity inSouthAsiatoreceiveanawardforasustainabletransport system.Ithasbaggedforsuccessfulimplementationofthe BRTS.ThispaperexaminestheimpactoftheBRTSystemon Ahmadabad’stransportsectorandthechangesthatcanbe brought about by the introduction of the BRT System in othercities.BRTSAhmadabadhasimprovedaccessforlocal riders and advanced public transportation systems while reducing the environmental impacts of transportation. Moving people quickly, at a low cost, with reduced greenhousegasesandairpollutantshelpscitiesgrapplewith rapidgrowth,congestion,andenvironmentalconcerns[7]
To study in detail bus rapid transit system of Indore, the stretch of road i.e. from Niranjanpur bus station to Rajiv Gandhi station which are possessing different volumes of passengers, bicyclists, motorists, pedestrians, and other heavy vehicles are taken into account. User’s response playedanimportantroleirrespectiveofageandgenderand hasbeencollectedfromasamplepopulationofIndorecity forthework Thereare21stopsontheBRTSrouteinwhich there are more than 10 signalized intersections, one signalized rotary, one non-signalized rotary, and a small portionofabout200mmixedlanetrafficwhichhasonly a kerbsidebusstopimpendingbusestochangelanestwice. ThesefactorsincreasethetraveltimeoftheI-buses.
Aself-administeredquestionnaireof21questionswasused for data collection. The study was based on method of
International Research Journal of Engineering and Technology (IRJET) e-ISSN:2395-0056
Volume: 09 Issue: 11 | Nov 2022 www.irjet.net p-ISSN:2395-0072
collecting informationduringtheresearchwork.Wehave conductedthesurveytocollectthedataanditwasareliable waybecauseitwasknownwhereitcamefromandhowit wascollectedandanalyzed.Theratingofusersatisfaction consistsofresponsesonscaleof1-Verypoorto5-Excellent.
Table 1: StationNameandLength
S.No.
Nameof Stations Length inkm.
1 RajivGandhitoBhawarkuan 1.49
2 BhanwarkuaToNavlakha 1.26 3 NavlakhaToIndraPratima 0.66 4 IndraPratimaToGpo 0.49
5 GpoToShivajiVatika 0.68
6 ShivajiVatikaToGeetabhavan 0.78
7 GeetabhavanToPalasia 0.66 8 PalasiatoGuitarSquare 0.18 9 GuitarSquareToIndustryHouse 0.24 10 IndustryHouseToLig 0.73 11 LigToMr9 1.02 12 Mr9ToRasoma 0.73 13 RasomaToVijayNagar 0.28 14 VijayNagarToSatyaSai 0.45 15 SatyaSaiToScheme78 0.35 16 Scheme 78 To Niranjanpur Circle 0.5
7. MeansofTransportfromI-busstationto destination 8. Travel time from origin to I-bus station(Min) 9. Travel time from I-bus station to destination(Min) 10. AveragenumberofdaysofusingI-busin aweek 11. Buspunctuality 12. Comfortatstation 13. ComfortinI-Bus 14. SafetyandsecurityatStation 15. Safetyandsecurityatbus 16. SpeedofI-Bus 17. ReliabilityofI-Bus 18. Convenienceofusingthebusservice 19. FrequencyofBusesatthestation 20. Cleanlinessofbusesandstation 21. PedestrianCrossingatStations 22. WidthofFootpath 23. OverloadingProbleminI-bus 24. I-busishavingreasonablefare 25. OverallSatisfaction 26. Whatmodeoftransportwouldyouuseif notusingI-bus
TrafficVolumeCountisthecountingofnumberofvehicles passingthroughtheroadovertheperiodoftime.Itisusually expressed in terms of Passenger Car Unit (PCU) and measuredtocalculatetheLevelofServiceoftheroadand related attributes like congestion, carrying capacity, V/C Ratio,identificationofpeakhour,etc. Trafficvolumecount orTVCisusuallydoneasapartoftransportationsurveys, TVCcanbeclassifiedorunclassified.Thisstudyincludesfour stations where traffic volume count was conducted i.e. Bhawarkuan,ShivajiVatika,GeetaBhawan,andPalasiya For thetrafficvolumecountsurvey,weusedCCTVfootagefrom ITMS and decided the peak hour by studying the footage only.
Forcalculatingpassengers’growthrateinI-businupcoming years we used a secondary data collection technique by takingatrendchartofpopulationgrowthinthelastyears fromAICTSLandforecastingitforfuture
International Research Journal of Engineering and Technology (IRJET) e-ISSN:2395-0056
Volume: 09 Issue: 11 | Nov 2022 www.irjet.net p-ISSN:2395-0072
The responses of Google forms and offline forms about journey details and user satisfaction were collected individuallyfromasampleof1000passengerstravelinginIBus during the survey period. These responses were analyzed thoroughly and frequency charts or histograms weredevelopedforthepercentageofsatisfactiontheuseris gettingbasedontheanswersofpassengers.Theresponseto oneparticularquestioni.e.“Whatmodeoftransportwould youuseifnotusingI-bus”wasanalyzedandthepercentage ofmodeshiftofpassengerstoothermodesoftransportation was derived which in continuation helped in getting the increase in PCU on the mixed vehicle lanes alongside the BRTS lane if the sample of passengers shifted from mass transport system to other modes of transportation. To calculatethetotalPCUincrementbytwo-wheelersandfourwheelers,Table1of“RecommendedPCUFactorsforVarious TypesofVehiclesonUrbanRoadswasused”fromIRC:1061990isused.
The vehicle count of different categories under the traffic volumecountsurveywasalsoconvertedintostandardPCU byusingthePCUtablementionedaboveandthenthefinal PCU at peak hour on the given road is considered as the volumeoftrafficwhichiscomparedwiththecapacityofthe road taken from IRC: 106-1990 “Recommended Design ServiceVolumes(PCU’sperhour)”table.
ThetrendchartcollectedfromAICTSLwasanalyzedandit was seen that the passenger growth was in geometric progression so by calculating the “ r ” value of geometric progression and averaging every last three-year data passengergrowthforecasthasbeendone.Theridershipdata collectedforforecastingisfrom2013to2022asfollows:
Table 3: I-BUSAverageRidership2013to2022
The user satisfaction graphs of responses from approximately 1000 for various parameters related to featuresofI-BUSandBRTShavebeendrawnasfollows:
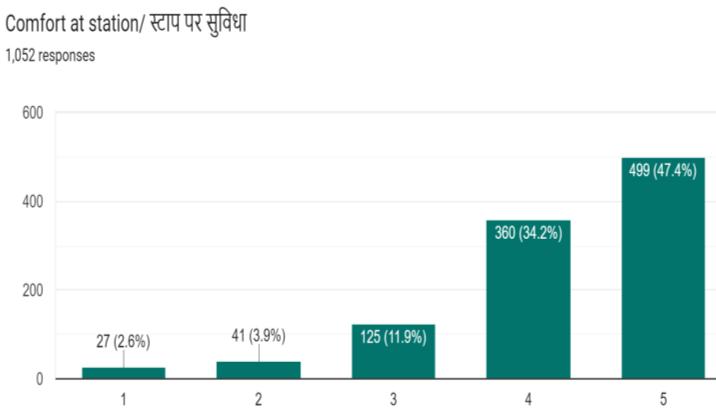
Fig.1Percentageofresponseonbuspunctuality
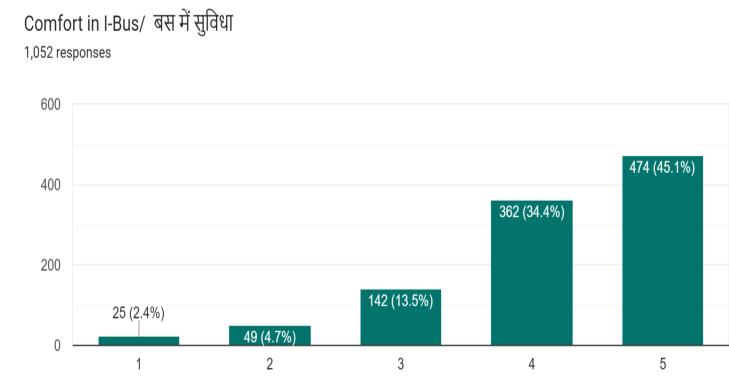
Fig.2Percentageofresponseoncomfortatstation
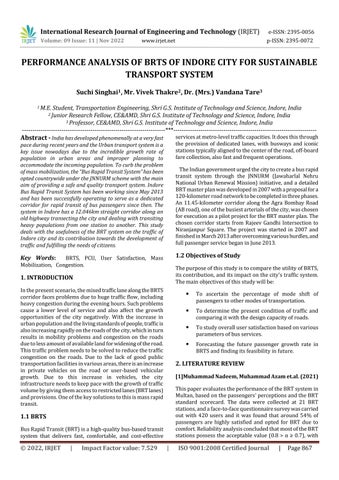
Fig.3PercentageofresponseoncomfortinI-Bus
International Research Journal of Engineering and Technology (IRJET) e-ISSN:2395-0056
Volume: 09 Issue: 11 | Nov 2022 www.irjet.net p-ISSN:2395-0072
Fig.4Percentageofresponseonsafetyandsecurityat station
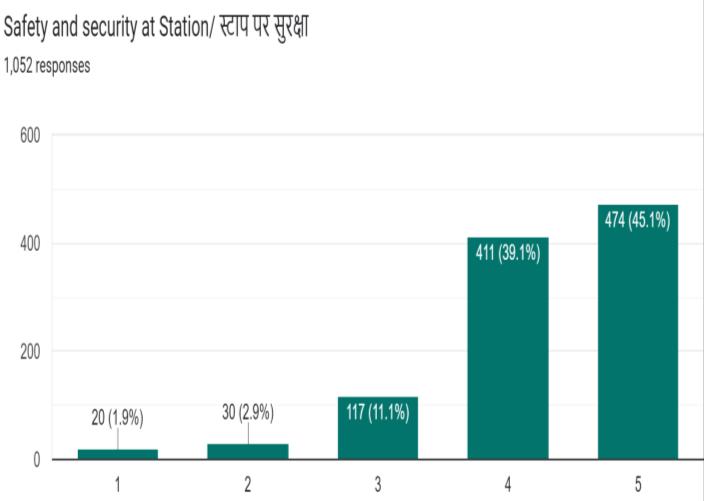
Fig.7PercentageofresponseonreliabilityofI-Bus
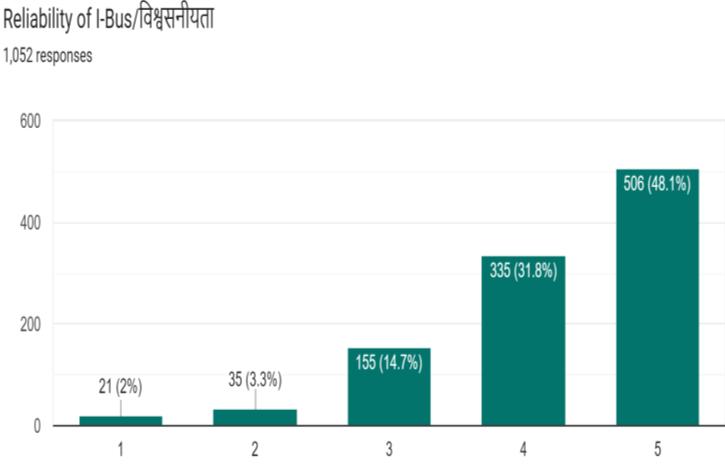
Fig.8Percentageofresponseonconvenienceof bus service
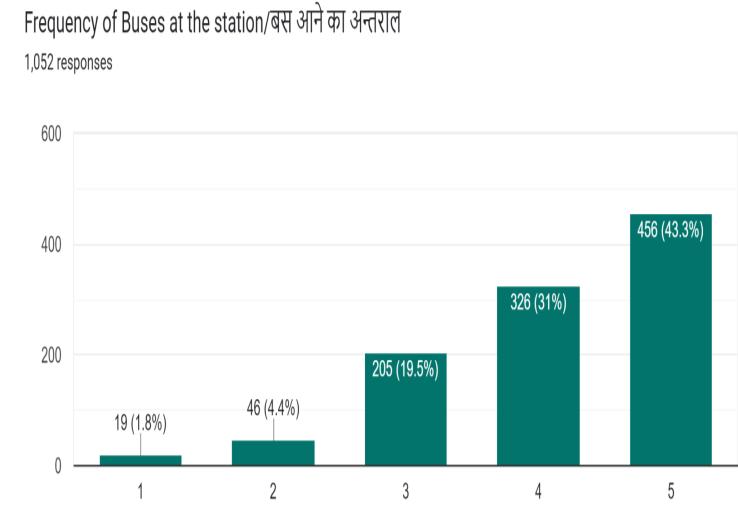
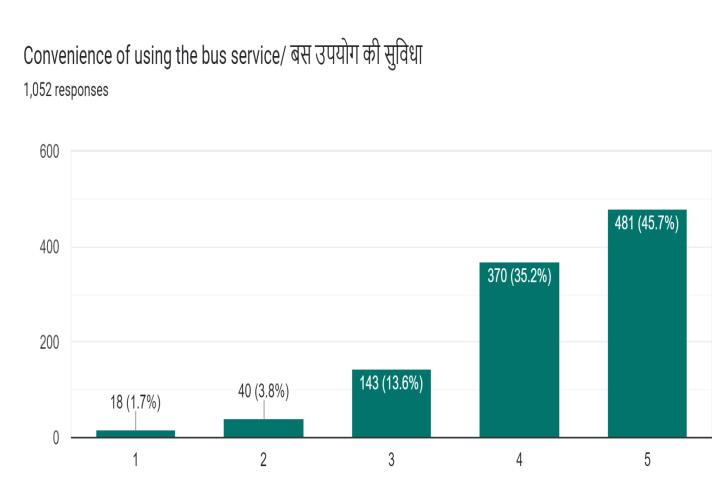
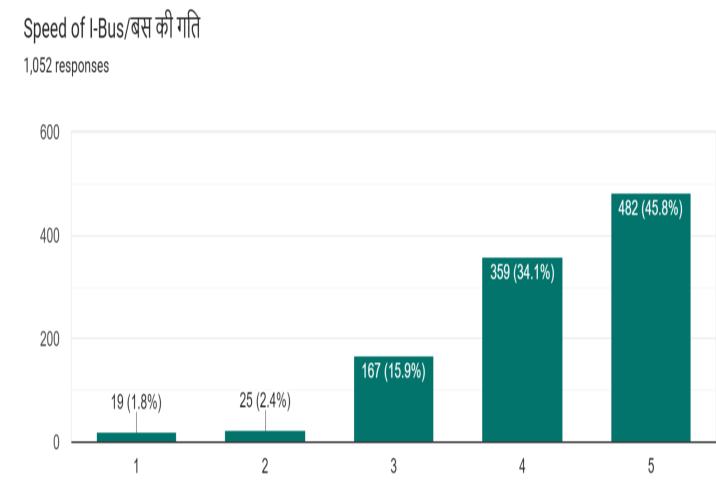
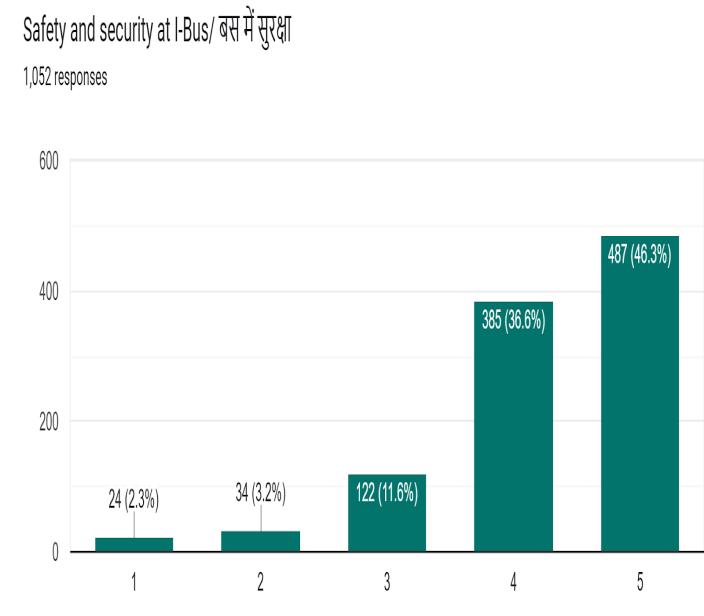
Fig.5Percentageofresponseonsafetyandsecurityat I-Bus
Fig.6PercentageofresponseonspeedofI-bus
Fig.9Percentageofresponseonfrequencyofbuses
International Research Journal of Engineering and Technology (IRJET) e-ISSN:2395-0056
Volume: 09 Issue: 11 | Nov 2022 www.irjet.net p-ISSN:2395-0072
Fig.10Percentageofresponseoncleanlinessofbusand stations
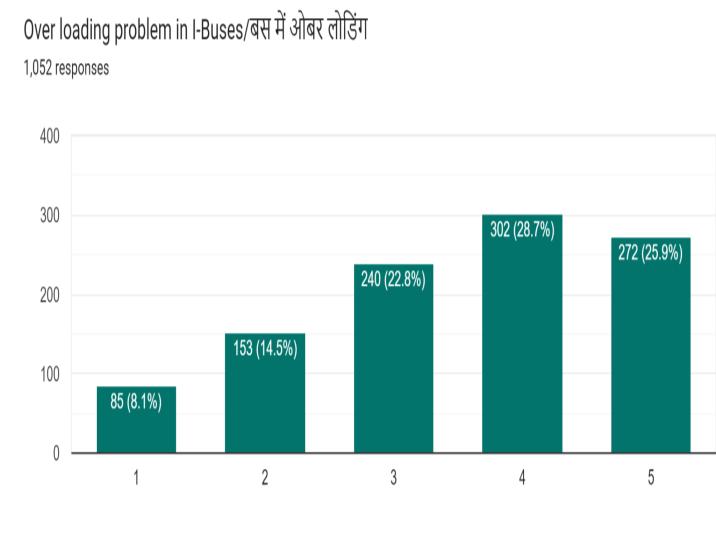
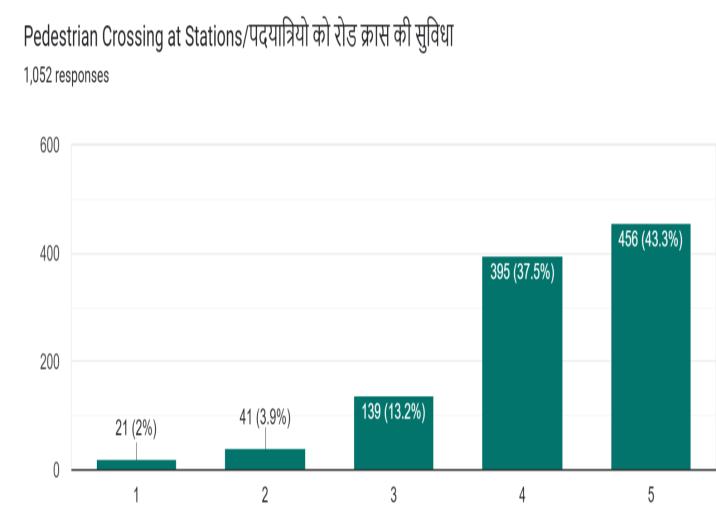
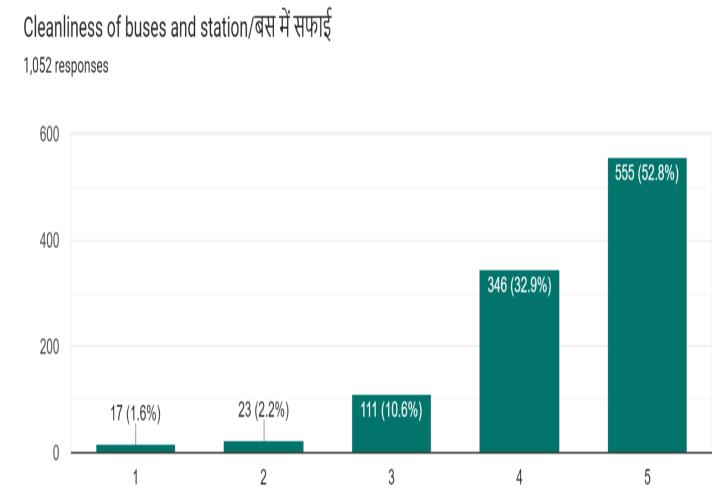
Fig.13Percentageofresponseonoverloadingproblemin
I-Bus
Fig.11Percentageofresponseonpedestriancrossingat station
Fig.14Percentageofresponseonreasonablefare
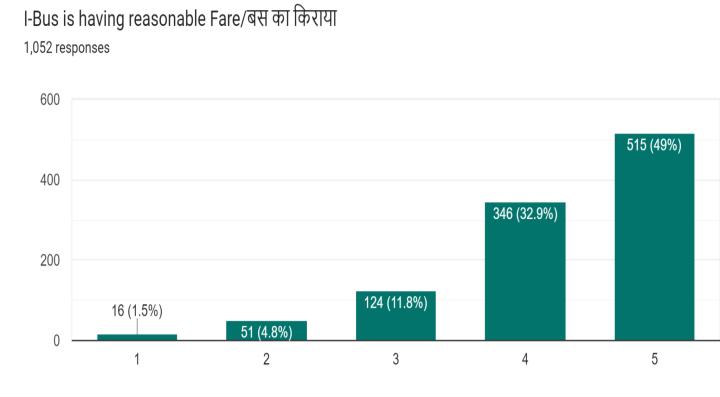
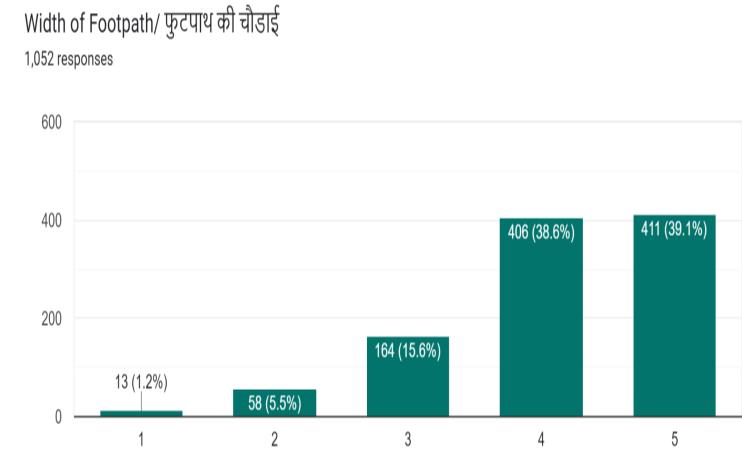
Fig.12PercentageofresponseonwidthofFootpath
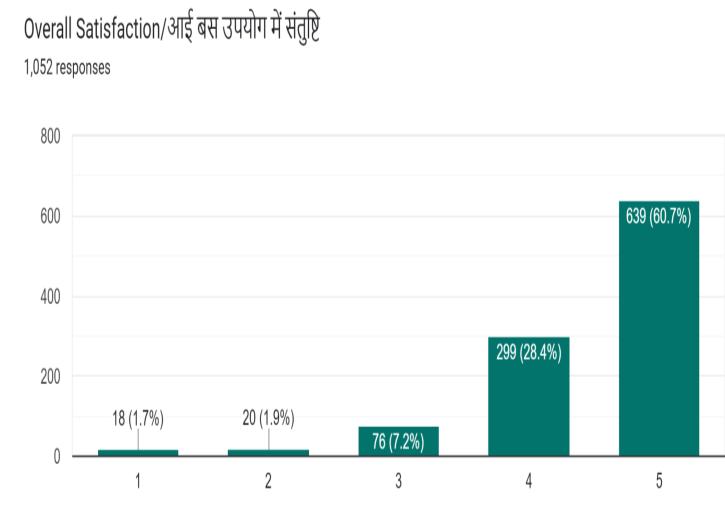
Fig.15PercentageofresponseonOverallsatisfaction
International Research Journal of Engineering and Technology (IRJET) e-ISSN:2395-0056
Volume: 09 Issue: 11 | Nov 2022 www.irjet.net p-ISSN:2395-0072
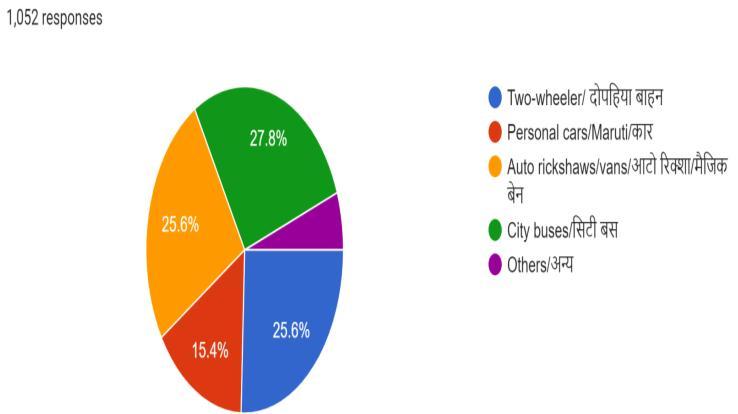
The responses from the user satisfaction google forms (Fig.16) also showed that approximately 25.6% of passengers from the sample will prefer to travel by twowheeler and 15.4% will use cars or four-wheelers if not usingI-bus.Accordingtothisdataoutof1052passengers, approximately270peoplemaytaketwo-wheelersand162 peoplemaypreferfourwheelerswhichoninterpolatingfor dailyridershipof44428gives11403people(2-wheeler)and 6842(4-wheeler) for a full day i.e. 760 two-wheelers per hourand456fourwheelersperhour.ThePCUconversionof thesetwoshowsthattherewillbeanincrementof570(PCU by2-wheelerperhour)andof456(PCUby4-wheelerper hour) if people will not prefer to travel by mass transit system.
3. ShivajiVatikato G.P.O 2310 2400
4. ShivajiVatikato GeetaBhawan 3552 2400
5. LIGtoIndustry House 4433 3600
6. LIGtoMR9 4942 2400
7. Scheme78to Niranjanpur 2750 3600
8. Niranjanpurto Scheme78 4135 3600
After comparison, it was found that 5 stretches i.e. BhawarkuantoVishnupuri,ShivajiVatikatoGeetaBhawan, LIG to Industry House, LIG to MR9 and Niranjanpur to SchemeNo.78werefoundtobeheavilycongestedduringa specifiedtimeofadayandtwostretchesi.e.Bhawarkuanto NavlakhaSquareandShivajiVatikatoGeetaBhawanisnear toovercongestioninfuture.
Thepassengergrowthrateforecastdata showsthatthere can be 7-8% growth in the upcoming years and hence resultingin62313passengersintheupcoming5yearsand 85764passengersafter10years
Fig.16Percentageofpeoplepreferringdifferenttypesof vehicles
TheTrafficVolumeCountsurveyconductedinpeakhour at eightdifferentstretchesofroadresultedinfollowingdata Firstly from Bhawarkuan to Vishnupuri peak hour traffic was4810PCUandfromBhawarkuantoNavlakhaSquareit was3048PCU.SecondlyfromShivajiVatikatoGPOitwas 2310PCUandfromShivajiVatikatoGeetaBhawan itwas 3552PCU.ThirdlyfromLIGtoIndustryHouseitwas4433 PCUandfromLIGtoMR9itwas4942PCUandlastly,from Scheme 78 to Niranjanpur it was 2750 PCU and from NiranjanpurtoScheme78itwas4135PCU Thisdatawas comparedwiththedesigntrafficcapacityoftheseone-waytwo-laneorone-way-three-lanearterial roadsinthetable givenbelow:
Table 4: Comparisonofvolumeofdifferentstretcheswith designcapacityofthosetypesofarterialroads
S.No. NameofStretch PeakTraffic Volumeof Stretch
Acomprehensivestudyofdifferentworksofliteratureand workingonthisresearchforasignificanttimederivedmany conclusionswhichareasfollows:
1. BRTSofIndoreisahighlyefficientsystemofmass transportation because it has a large accommodationspaceforpassengers.Currently,it istransitingapproximately45000passengersper day.
2. Accordingtopassengerdetailsfromthesample,it canbeconcludedthat56.9%ofmalesand43%of femalesusesthebusservicesafelyandcomfortably.
Design Capacityof Stretch
1. Bhawarkuanto Vishnupuri 4810 3600
2. Bhawarkuanto NavlakhaSquare 3048 3600
3. Fromthedata,itcanalsobeseenthatthesystemis youth-centricas47.4%ofpassengersarefrom16to 25agegroup,24.3%ofpassengersarefrom26-40 agegroup,19%ofpassengersarefrom41-55age groupand7.3%ofpassengersarefrom56-65age group.
4. I-Busisusedforeducationalpurposesas38.7%of usersarerelatedtotheeducationsector,thenitis used for work purposes with 31% users in this sector, 13.3% users in recreational/social sector, 9.3% users in shopping purposes and 7.7% for otherpurposes
International Research Journal of Engineering and Technology (IRJET) e-ISSN:2395-0056
Volume: 09 Issue: 11 | Nov 2022 www.irjet.net p-ISSN:2395-0072
5. Itiswidelyusedbypassengersasmaximumusers are using it for 5 and above days in a week i.e. 42.1% are using it for daily purposes, 18.3% are using it for 4 days, 16.9% are using it for 3 days, 12.5%areusingitfor2daysand10.1%areusingit for1dayinaweek.
6. Usersarehighlysatisfiedwithbusserviceaswellas by facilities which are being given by AICTSL regarding comfort, safety, etc. It was seen that 52.8% of users gave an excellent rating on cleanlinessthen45-50%ofusersgaveanexcellent rating on bus punctuality, comfort at the station, comfortinI-bus,safetyandsecurityatthestation andinI-bus,speedofI-bus,reliabilityofbusservice, convenienceinI-busandatthestationandalsofor the reasonable fare of I-bus and 40-45% of users gave an excellent rating for frequency of bus service,andpedestriancrossing Ontheotherhand, only39.1%ofpeopleweresatisfiedwiththewidth of the footpath provided, and only 25.9%are satisfiedwiththeoverloadingprobleminI-bus.
7. Asperoverallsatisfactionwithbusservice,itwas seenthat60.7%ofpeopleareextremelysatisfied, 28.4% people are satisfied and 7.2% people are fairlysatisfiedwiththeservice.
8. AfteracomparisonofPCUofexistingtraffic,itwas foundthatoutof4stations2i.e.Bhawarkuanand LIGareoverlycongested,andshiftingfrompersonal vehiclestoamasstransportationsystemwillhelp significantlyincurbingthecongestionissue.
9. ItwasalsoconcludedthatifpeoplewillshiftfromIBustopersonalvehiclesthentherewillbeahuge PCUincrementonroadsi.e.570PCUperhourby2 wheelerand456PCUperhourby4wheelerwhich will deteriorate traffic conditions as well as road surfaces badly so BRTS will be the appropriate solutionforthesustainabletransportsystem.
10. In comparison to BRTS of other cities, Indore’s system has some better features such as less waitingtime,highbusfrequency,goodconnectivity ofroadnetwork,etc.
11. Theinformationtechnologysystemofbusserviceis efficientenoughforgainingreal-timeinformation on buses, accidents, or any other incidents at the controlcenterofBRTS.
[1]M.Nadeem,M.Azam,M.Asim,M.A.Al-Rashid,O.C.Puan, andT.Campisi,“Doesbusrapidtransitsystem(Brts)meet thecitizens’mobilityneeds?Evaluatingperformanceforthe
caseofmultan,pakistan,” Sustainability (Switzerland),vol. 13,no.13,Jul.2021,doi:10.3390/su13137314.
[2]A.Kushwah,A.M.Gupta,Y.Rajput,B.TechStudent,andB. Tech,“TrafficImpactofBRTS-AcasestudyofIndoreBRTS,” © 2018 IJEDR |, vol. 6, no. 1, 2018, [Online]. Available: www.ijedr.org
[3]S. Dube, “Evaluation of Indore BRT: Passengers’ Perception of Services and Improvement Opportunities,” International Journal of IT, Engineering and Applied Sciences Research,[Online].Available:www.irjcjournals.org
[4]C. Kumavat, H. Sonawane, T. Patel, X. Sakhalkar, and A. Pansare,“EFFECTIVELEARNINGFROMDELHIBRTS-ACASE STUDYOFPUNEBRTSeSATJournalsEFFECTIVELEARNING FROMDELHIBRTS-ACASESTUDYOFPUNEBRTS”,[Online]. Available:http://ijret.esatjournals.org
[5]T.vAgarbattiwalaandB.VijaykumarBhatt,“Performance Analysis of BRT System Surat,” no. 5, p. 2016, 2016, doi: 10.17950/ijer/v5s6/621.
[6]M.MazharulHoque,D.Alam,S.AbdullahAlMamun,and H.MohammedAhsan,“BusRapidTransit(BRT):Whatisit andwhyDoWeNeeditforDhaka.”
[7]A.Jaiswal,K.K.Dhote,R.Y.Krishnan,andD.Jain,“BUS RAPIDTRANSITSYSTEM:AMILESTONEFORSUSTAINABLE TRANSPORT: A CASE STUDY OF JANMARG BRTS, AHMEDABAD,INDIA”.
[8]IRC:106-1990,“GuidelinesforCapacityofUrbanRoads inPlainAreas”