International Research Journal of Engineering and Technology (IRJET) e-ISSN:2395-0056

Volume: 09 Issue: 11 | Nov 2022 www.irjet.net p-ISSN:2395-0072
International Research Journal of Engineering and Technology (IRJET) e-ISSN:2395-0056
Volume: 09 Issue: 11 | Nov 2022 www.irjet.net p-ISSN:2395-0072
a Sr. Technologist, Automation Dept, Tata Steel India Limited, Jamshedpur 1 b Head Rolling Mill, LD3 TSCR Dept, Tata Steel India Limited, Jamshedpur 2 c Head OA-Mills, Automation Dept, Tata Steel India Limited, Jamshedpur 3 d Head Thin Slab Caster, LD3 TSCR Dept, Tata Steel India Limited, Jamshedpur 4 ***
Abstract - The width deviation is a critical statistic for evaluating the quality of a hot-rolled strip in steel production systems. This research proposes a machine-learning based Linear Regression Model to develop prediction model for predicting Final width in CSP Plant esp. for rolling special material with a tight width tolerance band than existing OEM Mill design. The overall objective of this effort is to create an online prediction model that can predict accurate width to be set at entry stage, thereby avoidingundergaugeorover gauge issues at Mill , and can lead to rejection of the Coils.
An original evolutionary algorithm and generalized linear regression was developed by choosing a representative variable from each process parameter impacting width and accordingly a prediction model was developed by using machine learning approach.
effectivelyappliedonline.Thishasmadeitpossibletoroll thisuniquegradeofspecialmaterialinmassquantitiesand analternaterouteofproductionforthisspecial gradehas started which is a great achievement and first of its kind acrossallsimilarkindofPlants.MassRollingofthisgrade withspecialtolerancebandhasbeengoingonnownormally forthepastsixmonthswithoutanyquality-relatedconcerns
Duetothecomplexityofthetask,themodel mustbeselflearning and take into consideration the current mill condition for which an adaptation coefficient has been added.Themodelresultsneedtobematchedwithongoing trialswithmodelresultstobeverifiedfromactualtrialsfor variedGWTLandsections
Words: Quality, Hot Rolled Coils, Width TOP OF COPPER, Machine Learning, Artificial Intelligence
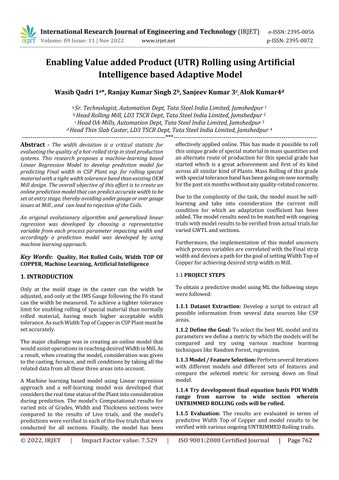
Only at the mold stage in the caster can the width be adjusted,andonlyattheIMSGaugefollowingtheF6stand canthewidthbemeasured.Toachieveatightertolerance limitforenablingrollingofspecialmaterialthannormally rolled material, having much higher acceptable width tolerance.AssuchWidthTopofCopperinCSPPlantmustbe setaccurately.
The major challenge was in creating an online model that wouldassistoperationsinreachingdesiredWidthinMill.As aresult,whencreatingthemodel,considerationwasgiven tothecasting,furnace,andmillconditionsbytakingallthe relateddatafromallthesethreeareasintoaccount.
A Machine learning based model using Linear regression approach and a self-learning model was developed that considerstherealtimestatusofthePlantintoconsideration during prediction. The model's Computational results for varied mix of Grades, Width and Thickness sections were compared to the results of Live trials, and the model's predictionswereverifiedineachofthefivetrialsthatwere conducted for all sections. Finally, the model has been
Furthermore, the implementation of this model uncovers whichprocessvariablesarecorrelatedwiththeFinalstrip widthanddevisesapathforthegoalofsettingWidthTopof CopperforachievingdesiredstripwidthinMill
1.1
ToobtainapredictivemodelusingMLthefollowingsteps werefollowed:
1.1.1 Dataset Extraction: Develop a script to extract all possible information from several data sources like CSP areas
1.1.2 Define the Goal: ToselectthebestMLmodelandits parameterswedefineametricbywhichthemodelswillbe compared and try using various machine learning techniqueslikeRandomForest,regression.
1.1.3 Model / Feature Selection: Performseveraliterations with different models and different sets of features and compare the selected metric for zeroing down on final model.
1.1.4 Try development final equation basis PDI Width range from narrow to wide section wherein UNTRIMMED ROLLING coils will be rolled.
1.1.5 Evaluation: The results are evaluated in terms of predictive Width Top of Copper and model results to be verifiedwithvariousongoingUNTRIMMEDRollingtrails.
International Research Journal of Engineering and Technology (IRJET) e-ISSN:2395-0056
Volume: 09 Issue: 11 | Nov 2022 www.irjet.net p-ISSN:2395-0072
Wedefinethe dataset asthecollectionoflabeledsamples. TheaccuracyofanyMachineLearningalgorithmdepends onthequalityofthedataset,inourcasethismeansthatwe need:
• LastoneyeardataofCoildata.
• Lastoneyeardataofcastingparameters.
• LastoneyeardataofTargetPDIfromLevel3
• To do a basic exploratory data analysis of width raw datasettoidentifycurrentCoilwidthVariationsinCSP Plant
• Identify pool of process parameters from Caster, Furnace and Mill having impact on final strip width deviation.
• Try to Identify a correlation among all process parametersonFinalstripwidth.
• DevelopawidthPredictionModelbasedonallprocess parametersidentified.
Width Control:
Mold Width Setting
Only place where width can be controlled
Width Measurement:
reachedMill,whichhasaminimumtimegapof30minutes. The model plans to predict Width to be set in Caster, to achievedesiredwidthinCSPPlantMill.
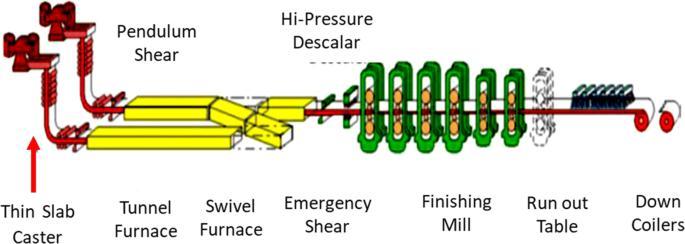
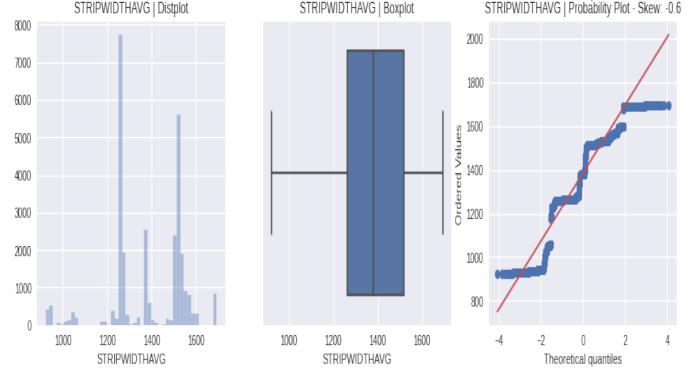
InitiallywetriedtoanalyzethemasterDatasettodetermine theexistingwidthdeviationscenarioinCSPPlantbasispast historiandata.Wetriedtocheckforanydataskewedness andoverallwidthdistribution.
Width Measurement
Only place where width can be measured
InCSPPlant,theonlyplacewherewidthcanbecontrolledis inCasterstageandthefinaloutputwherewidthismeasured isinMill.OncetheslabisgeneratedfromCSPPlantcaster, operatorcancometoknowfinalwidthonlywhenSlabhas
Asanalyzedfromdata,mostofthecoilsarerolledaround narrowSectionofwidthaswellaswidersectionwidth.The deviationinheadandtailpartofcoilismorethanthewidth deviationisrestofthecoilastensionisyettobuildandcoil ismoving freelyafter F4stand.Thisindicatesthatwidth controlneedstobemorecarefullyconsideredinheadand Tailpart
The main points which can be inferred from above exploratorydataanalysisisas:
● Special Grade Rolling width acceptable Target is leaserthannormalmaterial.
● SpecialGradeProductionwillbedonearoundtwo major width sections – around narrow & wider section
● AverageWidthDeviationisfoundtobemorethan thedesiredtolerancebandforthistypeofrolling frompastdata.
International Research Journal of Engineering and Technology (IRJET) e-ISSN:2395-0056
Volume: 09 Issue: 11 | Nov 2022 www.irjet.net p-ISSN:2395-0072
● AverageHeadendDev.isfoundtobewaygreater thandesiredtolerance band indicating head end controlforenablingspecialRollingfromCSPPlant ismorechallengingthanbody
The next important step in the development of the width predictionmodelistofindcorrelationbetweenvariousCSP Processparametersimpactingfinalwidth.
Initially,aheatmapalgorithmwhereinamatrixlayoutwith color and shading to show the relationship between two categories of values. The values are presented along each axis and the corresponding cell is then color-coded to represent the relationship between the two categories. Here, we have used a heat map to identify correlation between various process parameters. It is a matrix which helpsustoidentifystrongcorrelatedvariables.
• FMExitTemp.
• SlabWeight
• CoilWeight
• FMEntryTemp.
• CoilingTemp.
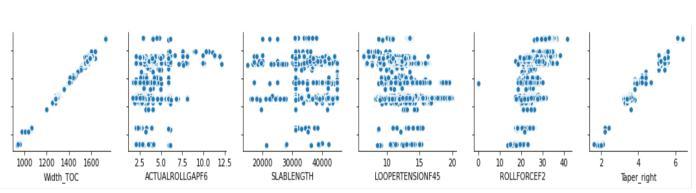
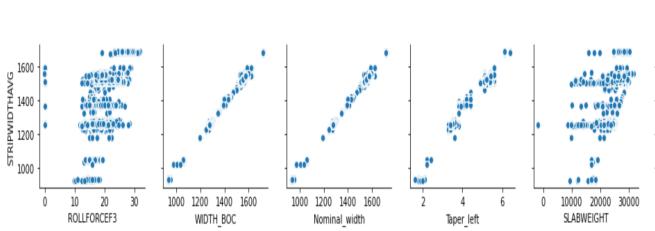
Thecorelationbetweenvariousvariableswasfurthercross verified by using Pair plot co relation technique. The technique reiterated the same strong co relation between the variables already established by Co relation matrix, indicatingourrightapproach.
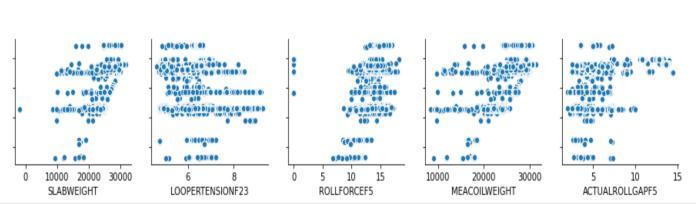
PairPlotisamethodwhichallowstoseethedistributionof data and relationship of various process parameters with targetvariable
Parameters identified with strong correlation with Strip width:
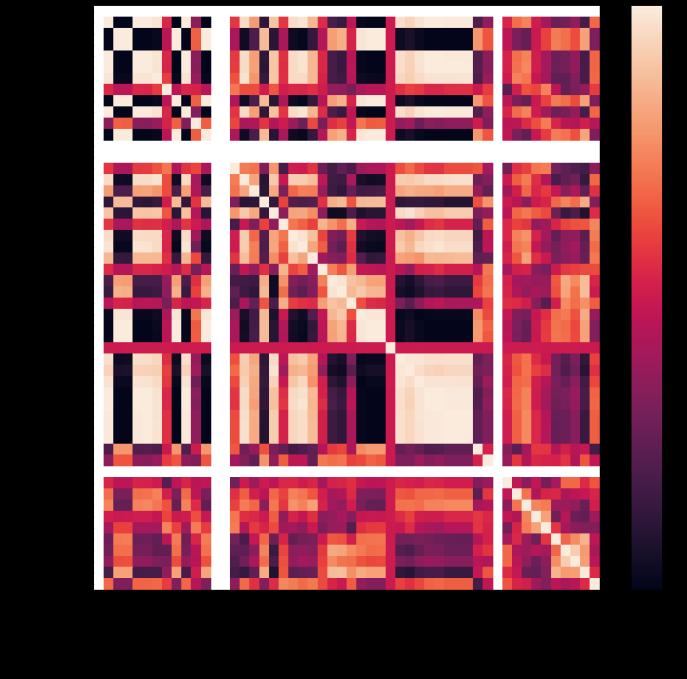
• WidthTOPOFCOPPER
• TaperRight
• TaperLeft
• CastSpeed
• Superheat
• RollForce.
• ActualRollGap.
• LooperTension
FromthePairplotting,theprocessparametersselectedfrom heatmaphavegoodstrongcorrelationwithWidth.
Width TOP OF COPPER, Width Bottom of Copper, Taper Right,Taperleft,RollForceStand2,Slabweightareshowing agoodcorrelationwithwidth.
For developing models, initially we have tried the Linear regressionapproachandtherandomforestapproach.
Linear regression is a basic and commonly used type of predictiveanalysis. The overall idea of usinga regression approachistodeterminewhetherprocessvariablesselected
International Research Journal of Engineering and Technology (IRJET) e-ISSN:2395-0056
Volume: 09 Issue: 11 | Nov 2022 www.irjet.net p-ISSN:2395-0072
fordevelopmentofthemodelaregoodenoughinpredicting Moldwidth.Theseregressionestimatesareusedtoexplain therelationshipbetweenonedependentvariableandoneor moreindependentvariables.
Regression approach is helpful to identify the effect of independentvariablesondependentvariables.Also,itcan be used to understand the impactof change in dependent variable with regards to independent variable which is helpfulinourcase.
Another approach we tried is Random Forest approach which is widely used for regression problems as well as identifyingfeatureimportanceofprocessvariables.
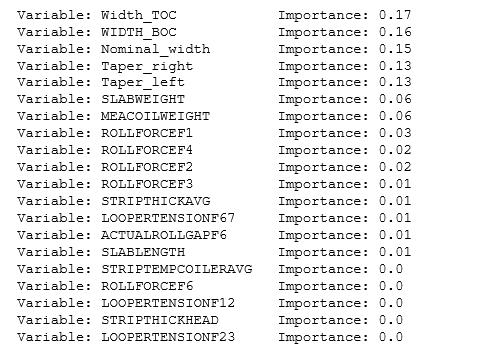
For all the process parameters identified, we first used a random forest approach which helped us to identify the featureandprocessvariablesselected.Themodelresultsare asbelow:
Thefinalmodelresultsareasbelow:
Inthe nextstep, features withimportancelessthan0.004 were not considered and were removed from final model development.
To improve model prediction, we tried Removing few Features which were having importance less than 0.004. Accordingly, a final list of 27 parameters with feature importancewereselected.
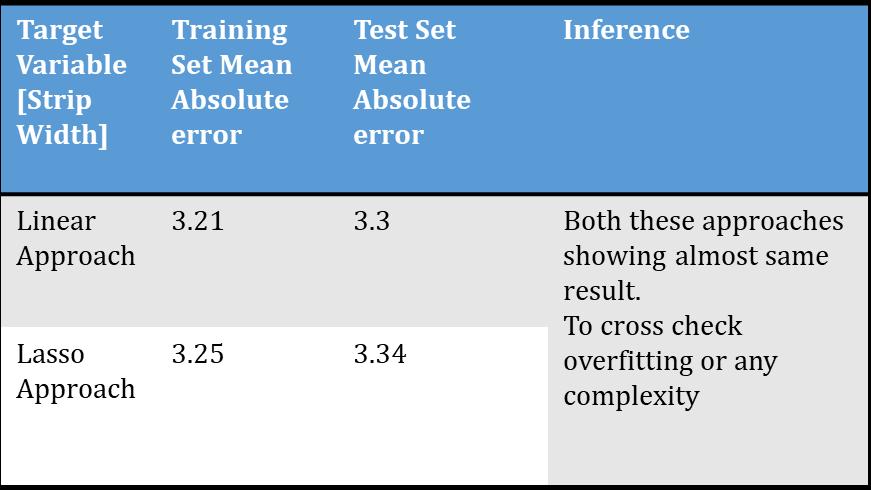
As the co relation among variables was high and good enough,soweusedlinearregressionmodeltounderstand width deviations from target as well achieve final model equationtobedeployedforgettingfinaltargetwidthTopof Copper
AsspecialgradeRollingwillbedonebetweentwomainsets ofPDIWidths,sothedatasetfortrainingmodelwasdivided intomainsetsconsideringnarrowandwidersectionwidths intoaccount.Thepurposeofdividingthedatasetintotwo separate widths is to improve model accuracy and width predictionassetupcalculationsundergomajorvariationin narrowandwidersectionsofrolling.
PDIWidthforNarrowsection
PDIWidthforwidersection
International Research Journal of Engineering and Technology (IRJET) e-ISSN:2395-0056
Volume: 09 Issue: 11 | Nov 2022 www.irjet.net p-ISSN:2395-0072
Dividingdatasetintotwopartsnarrow/widerandfinally devisingmathematicalequationtopredictfinalWidthTopof Copperforoperationvisualizationwasfinalizedasbelow: EquationResultsforNarrowsection
Several trials for special grade Rolling were taken in CSP PLANT to check the feasibility for enabling special grade Rolling . During first rolling, model development had not commenced,anditwasnotasuccess.Duringthethirdtrial, modeldevelopmenthadcompletedandthebasisPDIWidth desired,thefinalmoldwidthinCasterwassetaspermodel predicted Width TOP OF COPPER. The third trial was successful,andallcoilspassedqualityclearanceand were withinacceptedtoleranceband
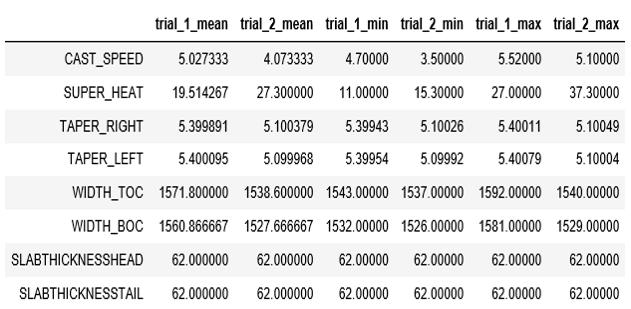
The comparative analysis was done to understand the differencebetweenprocessparametersofbothtrails.
First Trail taken was not successful wherein avg. Width Deviation was more than the acceptable widthrange.
2nd Trailmeandeviationwaswellwithintolerance band and was a huge improvement and step forward towards enabling special Rolling in CSP PLANT
Comparative analysis of parameters identified clearly explains the difference between two differenttrailresults.

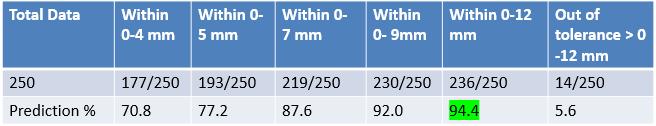
The Trail 2 was satisfactory, and the model calculatedwidthwassetinCastergivingoptimum results,therebygivingahugeleaptowardsenabling special grade Rolling in CSP PLANT. Below is the summarizedviewoftrail2widthmeasurements
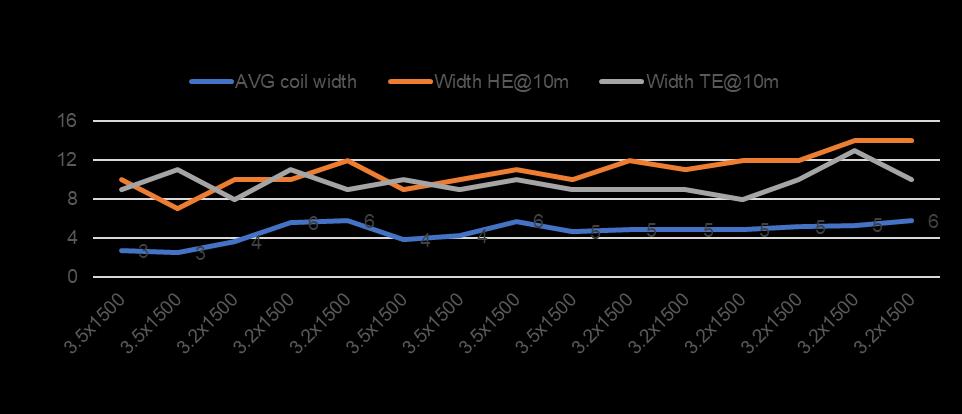
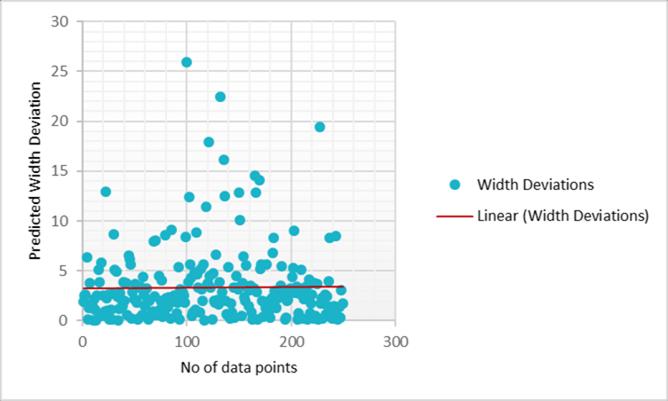
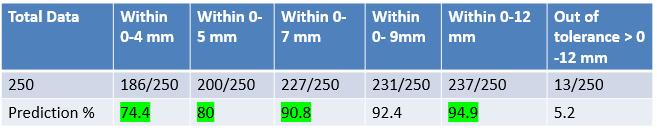
The Model accuracy was high and matching with ongoing trailsinCSPPLANTforpredictingWidth.Avisualizationhas been developed for viewing model output and visualizing overall width profile of coil wherein its deviation in head, bodyandtailisgenerateddynamically.Thishelpsoperation teamtoanalysesprofileoflastrolledcoilandvaluesofall processparametershavingimpactonfinalwidth.
International Research Journal of Engineering and Technology (IRJET) e-ISSN:2395-0056
Volume: 09 Issue: 11 | Nov 2022 www.irjet.net p-ISSN:2395-0072
Afterwards, third and fourth trail was also done with different other grades and sections. Model accuracy was accurate,andtrailsweresuccessful.Now,Massspecialgrade Rolling has started from CSP PLANT Route in TATA Steel India LTD, Jamshedpur making an alternate route of productionforspecialgradeRollingapartfromconventional HSMMill.
[1] William L Roberts : “Hot Rolling of Steel”, Volume 1 , Issue2,April2008
[2] Arif S. Malik ; Ramana V. Grandhi: “A computational methodtopredictwidthprofileinRollingMills”,IEEE Transactions on Instrumentation and Measurement, Volume62Issue3.March2013.
[3] YingjunJi , Shixin Liu , Mengchu Zhou , Ziyan Zhaoa , XiwangGuo,LiangQi: “Amachinelearningandgenetic algorithm-basedmethodforpredictingwidthdeviation ofhot-rolledstripinsteelproductionsystems”.
[4] NiteshV.Chawla,KevinW.Bowyer,LawrenceO.HallW. PhilipKegelmeyer:“SMOTE:SyntheticMinorityOversampling Technique” Journal of Artificial Intelligence Research16(2002)321–357.June2002.
[5] Shai Shalev-Shwartz, Shai Ben-David. Understanding Machine Learning: From Theory to Algorithms, page 360.CambridgeUniversityPress2014.