International Research Journal of Engineering and Technology (IRJET) e-ISSN: 2395-0056

Volume: 09 Issue: 11 | Nov 2022 www.irjet.net p-ISSN: 2395-0072

International Research Journal of Engineering and Technology (IRJET) e-ISSN: 2395-0056
Volume: 09 Issue: 11 | Nov 2022 www.irjet.net p-ISSN: 2395-0072
Abstract - One of the biggest musicplatformsinthe worldis Spotify. With over a 100 million users per day and over 80 million tracks on it, people have been using this music streaming app for multiple things like podcasts, motivational audio and most importantly songs. Spotify is mainly used for songs as most of the worlds renowned artists to publish their content so the world can hear it and enjoy it. Being avid users of Spotify ourselves, we tried to find out what drives the fame of a song – or even try to understand why people listen to a specific song. In this research paper and project, we used multiple algorithms to check what attributes of a song makes it famous and why does it top the weekly charts. This paper uses a Spotify Database and performs Exploratory Data analysis on it to recognize the most influential variables and then further work on them. We have used algorithms like Linear Regression,RandomForest,RidgeRegressionandLasso Regression to compare accuracies of our admired results. Finally, the accuracy will be compared so that we can calculate the approximate streams of a song based on the relevant attributes.
We chose a Spotify as our subject because for years as students, we have been using this app to help in various ways.Spotifyaidesusinentertainmentwithitsmillionsof songs and several genres. It has many more advantages whichmakesitabettermusicappthanotherappsthatexist. Firstly, it remains of the easiest apps to use and thus multiple age dynamics can be seen as users of the app. Spotifygivesagreatmusicsharingexperienceasfriendsand familycansharesongsusingasharedaccount.Theappalso providesuswithapremiumversionwithnoadvertisements whichenhancestheexperiencebysavingthemusicoffline and not using network data to stream it. The biggest advantageiscompatibility.Itcanbeusedovermanydevices includingiOS,AndroidandWindows.
Finally,themusiccollectioniswhatdrivespeopleonthe appandthat’swhymainlytheworldusesit.Wewantedto know why is a song famous, does the artist on the song matter, and what attributes of the song can affect the number of times it has been streamed. To answer our questions, we have implemented the following in our researchwork:
i) Usingdatavisualizationplotslikebarchart,scatterplot, andheatmapwefindtheattributeswhichaffectthestreams ofthesong.
ii) We then move forward by dropping theattributeslike Artistname,Songname,anditsreleasedateasinstep1we realize that they do not affect the streams of a song by a largerscale.
iii) CharacteristicsofasonglikeLoudness,Popularityofthe song,anditsenergywerethemostcontributingfactors.
iv) Lastly,wetaketheregressionalgorithmsmentionedand predictthestreamsofthesongusingtherelevantfactors.
Authorsofresearchpaper[2]investigatedtheconnection between song information, such as key & tempo from the databaseofSpotifyaudioproperties,andsongpopularityas determined by the numerous streams of Spotify. They researched four ML algorithms: Linear Regression (LR), RandomForest(RF),K-means,Clustering&createdahighly accurate model for predicting success of particular songs. Their research offers a prediction model for figuring out whetherasongwillbewell-likedbythegeneralpublicand usesmachinelearningtocategorizesongsaccordingtohow well-likedtheyare.
In [3], Charts Carlos Vicente S. Araujo Marco A. P. Cristo RafaelGuistimakepredictionsonwhetheranexistingwelllikedmusicwillgarnergreaterthannormalpublicinterest and go "viral." They also make predictions about whether unexpected jumps in popularity will last over time. They base their conclusions on information from the streaming service Spotify, using "Most Popular" list as a proxy for popularity and its "Virals" list as a proxy for interest increase.Additionally,theytakeaclassificationapproachto theissueanduseaSVMmodelpredicatedonfamousdatato forecastinterestandviceversa.Finally,theychecktoseeif acousticdatacanbehelpfulfeaturesforbothtasks.
In[4],ElenaGeorgieva,MarcellaSuta,andNicholasBurton attemptedtoforetellwhichsongswilltoptheBillboardHot 100.Theycollecteddatasetofaboutfourthousandpopular &nonpopularsongsandusedwebAPIofSpotifytoextract the audio properties of each song. Using five machine learning algorithms, they were able to predict a song's billboardsuccesswithabout75%accuracyonthevalidation
International Research Journal of Engineering and Technology (IRJET) e-ISSN: 2395-0056
Volume: 09 Issue: 11 | Nov 2022 www.irjet.net p-ISSN: 2395-0072
set.Thetwomost effective methodswereneural network logisticregression.
In [5], Rutger Nijkamp’s, study looks into the connection betweenmusicinformation,suchasthekeyandtempoofa song & popularity of song as determined on the basis of numberofsong’sstreamsreceivedonSpotify.Theattributeapproach was utilized to investigate the potential explanatorypowerofsongqualitiesonstreamcount.1000 tracks from ten different genres were examined via the Spotify database API. Regression was used to create a prediction model. With this research design, the results indicate that Spotify's audio features have minimal to averageexplanationpowerofgreatercountofstream.
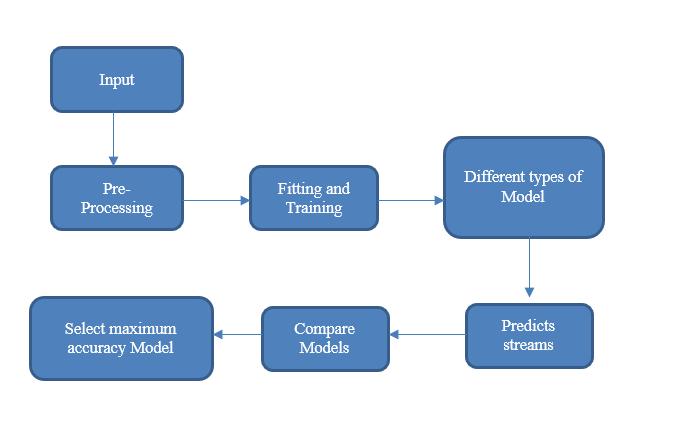
Methodology section of the paper explores the different methods which we have applied on the Spotify dataset to predictthenumberofstreamsofasong.Thedatasetisused in multiple cases of data visualization and predicting an approximate number. Fig 1 displays a flowchart of the methodologywhichhasbeenusedandimplementedinour research and includes data cleaning, its display on graphs and usage of various regression models and obtain appropriateresults.
Inthisstepweremovetheinaccurateornullvaluesdirectly fromthe csvfileofthedatasetwhichmightleadtowrong results. We had to perform less cleaning as the obtained datasetwasnearlyobsolete.
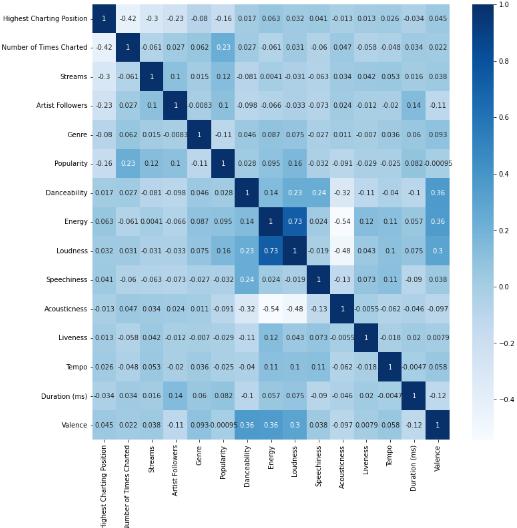
Figure6showsaheatmapofthedatawhichwehaveusedto achieve our results. Heatmap map is defined as graphical notationoflargevolumeofdatacodedbydifferentcolours. Theheatmaptakesallthevariablespresentandcorrelates them with each other at the same time. Figure 7 shows a histogramofnumberoftimesa songwaschartedvs Song Name,figure8isabarchartplottingofanartistvsstreams andfigure9isbarchartreflectionofgenreandstreams.
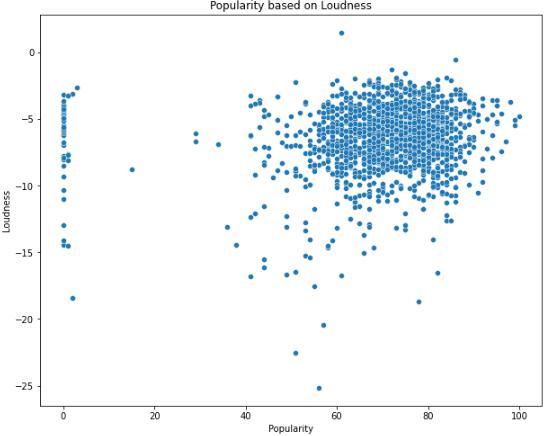
On further evaluation of the heatmap, we came to a conclusionthatthemostprominentfeaturesareLoudness andEnergy.Thiscanalsobeverifiedwiththegraphsshown inFigure3and4.
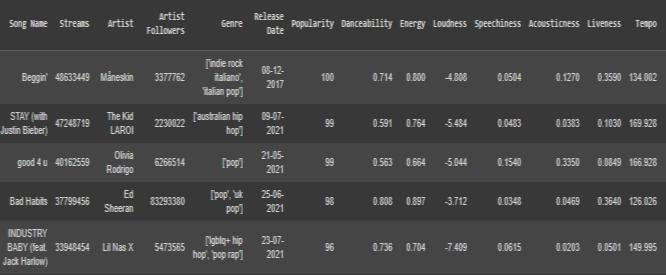
Figure 3 shows us a scatter plot between popularity and loudness. The graph displays the relation that higher the loudness,higherthepopularityofthesong.
Thedataisobtainedfrom[1].Thedatasetincludesfeatures like song name, artist, artist followers, genre, popularity, danceability,energy,loudnessandmanymore.
Fig. 3. Popularity
International Research Journal of Engineering and Technology (IRJET) e-ISSN: 2395-0056
Volume: 09 Issue: 11 | Nov 2022 www.irjet.net p-ISSN: 2395-0072
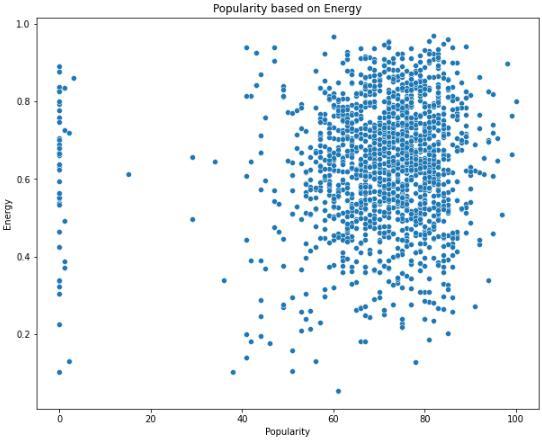
Figure4showsascatterplotbetweenpopularityandenergy and it shows that higher the energy of the song, more the popularity.
decisiontreesduringthetrainingperiodandprovidesusthe meanoftheclassesasapredictionofalltrees.
Here LASSO is used acronym of least absolute shrinkages selectionoperator.Extensionofitispenaltytermrelatedto costfunction. Summationofthecoefficientsisrepresented by this phrase. This particular term confine, forcing the modeltocurtailthevalueofcoefficientsinordertominimize thelosses,whenthevalueofcoefficientsincreasesfrom0to 1.Incontrasttolassoregression,whichcommonlymakes the coefficient absolute zero, ridge regression never puts coefficientvalueaszeros.
TheLASSOregressioncombinesstatisticsandMLtoenhance predictabilityaswellasunderstandabilityoftheresultant model.
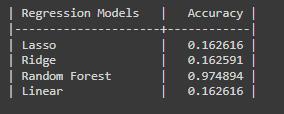
Figure5displaystheregressionmodelswehaveusedwith theirrespectiveaccuracies.Theregressionmodelwiththe mostaccuracyisrandomforest.
In essence, a regularised linear regressor is what a ridge regressoris.Inotherwords,weaddaregularizedtermto the initial cost function of the linear regressor in order to drive the learning algorithm to suit the data and help maintain the weights as low as feasible. The 'alpha' parameter of the regularised term controls the regularisationofmodel,thereforereducingthevarianceof the estimations. In some conditions where variables are independent&correlated,techniqueofridgeregressionis used for forecasting the coefficients of numerous regressions.
Linear Regression is a supervised machine learning algorithmwhichpredictsthetargetvalueonthebasisofthe independentvariablesprovided.
Accordingtotheaccuraciesfound,wededucedthatLinear Regression algorithm would provide us with the best possibleresultsforourdataset.
TheHypothesisfunctionoflinearregressionisstatedbelow: y=α1+α2.x …(A)
herexdenotesinputtraining y=labelstodata
α1=intercept
α2=coefficientofx
Regression in Random Forest makes use of ensemble learning method. It operates by construction of many
Fig. 6. HeatmapofCorrelationPlot
International Research Journal of Engineering and Technology (IRJET) e-ISSN: 2395-0056
Volume: 09 Issue: 11 | Nov 2022 www.irjet.net p-ISSN: 2395-0072
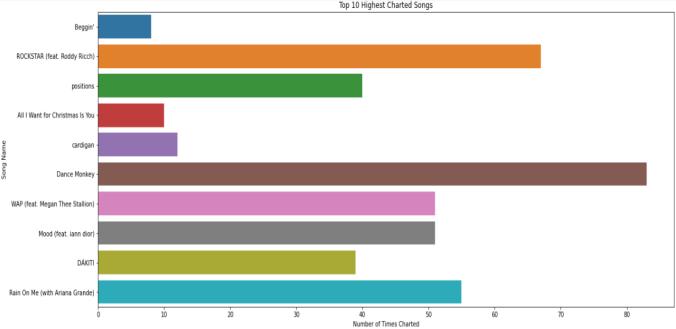
Figure7showsthatDanceMonkeyisthemostchartedsong whileBeggin’istheleastchartedsong.
Inthisresearchpaper, wehavesuccessfullypredictedthe popularityofsongsusingrelevantattributes,whichhelped usgainingourdesiredaccuracy.Themostinfluentialfactors that fulfilled our objective to determine streams were loudnessandenergy.Intheinitialpartofourresearch,we have used techniques like Lasso Regression, Ridge Regression,RandomForestandLinearRegression.Wehave obtainedthebestresultsfromRandomForest,whichcame outtobe97.48%,Hencethemostaccurateregressionmodel wasRandomForest.
Inthefuture,theresearchworkcanbeimprovedwiththe help of a dataset with more songs and attributes to gain betteraccuraciesofthemodels.
Fig. 7. HistogramofnumberoftimeschartedVsSong Name
Figure8showsthattheartists,Maneskinhavethehighest streamsfortheirsongwhileBadBunnyhasthelowest.
[1] Dataset:https://www.kaggle.com/datasets/sashankpilla i/spotify-top-200-charts-20202021
[2] J.S.Gulmatico,J.A.B.Susa,M.A.F.Malbog,A.Acoba,M. D. Nipas and J. N. Mindoro, "SpotiPred: A Machine Learning Approach Prediction of Spotify Music Popularity by Audio Features," 2022 Second International Conference on Power, Control and Computing Technologies (ICPC2T), 2022, pp. 1-5, doi: 10.1109/ICPC2T53885.2022.9776765.R.Nicole,“Title ofpaperwithonlyfirstwordcapitalized,”J.NameStand. Abbrev.,inpress.
Fig. 8. HistogramofArtistVsStreams
Figure9showsthatthegenres,IndierockItalianohavethe higheststreamswhiletraplatinohasthelowest.
[3] Araujo, C. S., Cristo, M., & Giusti, R. (2019). Predicting music popularity on streaming platforms. Anais Do Simpósio Brasileiro De Computação Musical (SBCM 2019).
Available: https://doi.org/10.5753/sbcm.2019.10436
[4] Suta, M. (2018, January 1). Hitpredict: Predicting hit songs using Spotify Data Stanford Computer Science 229:Machinelearning.Academia.edu.RetrievedOctober 7,2022.
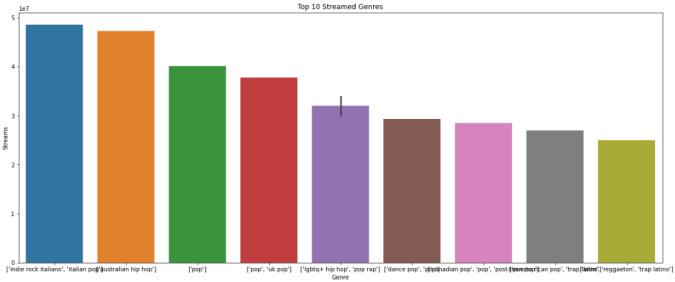
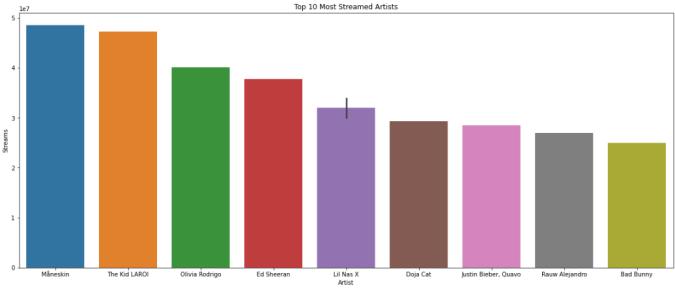
Fig. 9. HistogramofGenreVsStreams
Spotifyisaverylargeplatformthatisusedaroundtheworld everydaybymillionsofusersandthusthisresearchproject helpedustogainmoreknowledgeaboutit.Itwasinsightful toknowabouttheattributesthatactuallyaffectthestreams of a song and what causes a user to listen to a particular artist. Moreover, we gained knowledge about various regressionmodelswhichcanbeusedforotherprojectsin thefuture.
Available: https://www.academia.edu/73249006/Hitpredict_Pred icting_Hit_Songs_Using_Spotify_Data_Stanford_Computer _Science_229_Machine_Learning
[5] Nijkamp, R. (n.d.). Prediction of product success: Explaining song popularity by audio features from Spotifydata.RetrievedOctober6,2022.
Available: https://essay.utwente.nl/75422/1/NIJKAMP_BA_IBA.pd f
[6] https://www.statisticshowto.com/lasso-regression/
Factor value:
International Research Journal of Engineering and Technology (IRJET) e-ISSN: 2395-0056
Volume: 09 Issue: 11 | Nov 2022 www.irjet.net p-ISSN: 2395-0072
[7] https://towardsdatascience.com/ridge-regression-forbetter-usage-2f19b3a202db
[8] https://www.analyticsvidhya.com/blog/2021/06/unde rstanding-random-forest/
[9] http://www.stat.yale.edu/Courses/199798/101/linreg.htm
[10] https://www.mathworks.com/help/stats/what-islinear-regression.html
2022, IRJET | Impact Factor value: 7.529 | ISO 9001:2008 Certified Journal | Page725