International Research Journal of Engineering and Technology (IRJET) e-ISSN:2395-0056

Volume: 09 Issue: 11 | Nov 2022 www.irjet.net p-ISSN:2395-0072
International Research Journal of Engineering and Technology (IRJET) e-ISSN:2395-0056
Volume: 09 Issue: 11 | Nov 2022 www.irjet.net p-ISSN:2395-0072
Abstract - The stock market has achieved new heights of popularity in the recent past. The growth in the inflation rate has led people to invest in the stock and commodity markets and other areas of the financial market instead of saving. Technical analysis of stocks with the help of technical indicators has been one of the most popular ways used by traders and investors to help them make decisions like buying or selling in order to make monetary gains. Further, the increase in the availability of computational power and Deep Learning techniques have made it possible to predict the markets to some extent. In this paper, we will make use of various deep-learning algorithms to analyze price trends, predict closing prices and thereby identify trading opportunities. Also we want to leverage our model for predicting and identifying gold prices and prices of various other commodities such as silver , platinum.
Key Words: Stock Market, Technical Indicators, Deep Learning,PriceTrends,ClosingPrices
Stock market prediction is an extremely ambitious yet essentialtaskforanyinformedinvestor.Therandom,nonlinear, non-stationary, and noisy behavior of the market does not help make the task any less challenging. We can programdifferentmodelstopredictthefuturetrendsthat emerge from observing years and years of stock market data. These trends and patterns help investors make informed decisions to maximize their profits. The erratic nature of the markets could intimidate even the most experienced ofinvestorsandthereforeitiscrucial forthe tasktobeautomatedtoprovidesomesortofastructureto theever-fleetingmarket.
Accurately predicting stock market prices is a laborious task. Investors make use of technical and fundamental analysis which in turn make use of certain technical indicatorstoindicatewhichstockstoinvestininorderto maximize profits for the organization. Even today, a majority of investors and traders manually design and follow a set of rules derived from the said technical & fundamental analysis. This process, however reliable it might be, is tedious and fleeting based on the current
market trends. A better and more comprehensive approach should be to use deep learning models to automate the task and make it more generalized in order toencompassawiderrangeoftrendsandpatterns
Severalmodelsexistforstockmarketprediction.Selecting therightmodelthatissuitableforourusecaseisarduous. In addition to this, we also have to choose the right hyperparameters. This involves a lot of trial and error over a large dataset and this process is extremely timeconsuming. There might also be times when a certain model isbettersuitedfora certain periodoftimeor for a certain sector. This makes the entire process of stock marketpredictionseverelycomplex.
The preliminary challenge was to access the publicly available APIs for obtaining accurate and reliable stock market data, one needs to have a trading account, so this was a major inconvenience. The major challenge still lies in the fact that stock indicators are used to accurately predict future trends, we need to calculate the required terms in order to make informed decisions. Another pertinent challenge is the volume of the data involved. In order to make our prediction more accurate, we need to make the dataset more and more inclusive, taking into accountseveralyears’worthofstockmarketdata.
Stock Market behavior has been studied through various research studies. The research has evolved from using technical indicators to create rules to using deep learning techniquesthatactasablackbox.Thisblackboxcontains complexrulesusingwhichoutputisgiven.Theserulesare learnedbythemodelthroughthetrainingprocess.
Logistic regression, Long Short-Term Memory, Support VectorMachine,andRandomForestaresomeofthemost frequent deep learning algorithms that can be used for StockMarketPrediction.
International Research Journal of Engineering and Technology (IRJET) e-ISSN:2395-0056
Volume: 09 Issue: 11 | Nov 2022 www.irjet.net p-ISSN:2395-0072
Faraz et al. (2020) have used AE-LSTM for the prediction of the closing price of S&P stocks. The autoencoders are trainedtoprovideareducedrepresentationofthedataby giving importance to appropriate aspects of the data. The reduced representation is then fed to an LSTM-based forecastingnetworktopredicttheclosingpriceofthenext day. Technical indicators like MACD, RSI, SMA, etc are added as features apart from OHLC and Volume. The authors have performed various things as part of data preprocessing - converting data to stationary time series data, using wavelet transform to denoise the data, removingoutliersbythez-scoremethod,andnormalizing data using the min-max normalization method. The proposedmethodperformsbetterthanGANsinpredicting thenextday'sclosingpriceasdepictedinthepaper.After predicting the next day's closing price, buy/sell signal is generatedbyfollowingapairofsimplerules.
Ghoshetal.(2021)[2]used2methods-cuDNNLSTMand Random Forest to predict the probability of the stock giving intraday returns greater than the cross-sectional median intraday returns of all the stocks at time t. Data from the S&P 500 for the period from 1990 to 2018 is considered.Thedataisbrokendownbytakingwindowsof size 4 years and stride of 1 year. In each window, approximately 3 years’ worth of data is used for training andtherestfortesting.3typesoffeaturesarederivedfor eachstockattimet - intradayreturnsfor mdays,returns withrespecttoclosingpricemdaysprior,andreturnwith respect to opening price m days prior. The authors have chosen31valuesofm,thusthereareatotalof93features. Random forest uses these 93 features, and LSTM derives its 3 features from 93 features by using Robust Scaler Standardization. Their setting involving LSTM obtains daily returns of 0.64% and that involving Random Forest obtains 0.54% daily returns, both prior to transaction costs.
Tomar et al. (2020) [3] have used various variants of LSTM (Slim Variants) for predicting next-minute price movements(binaryclassification,1forbuyand0forsell). The variants are then compared using measures such as precision,recall,F1score,andAUC.
Mabrouk et al. (2022) [4] used a model that stacked CNN Layer, GRU Layer, and Dense Layer upon the Input Layer to predict whether to buy, sell or hold a currency using one-hot encoding. The input layer contains a 2d matrix in which each row contains observation of all features of a particular currency on a specific day. Feature selection techniques were used to reduce the number of features from 150 to less than 30 important input features. Technicalindicatorsarealsoincludedinthesefeatures.
Paspanthong et al. (2019) [5] experimented with various models with the aim of predicting the next-minute price movements(binaryclassification,1forbuyand0forsell). Statistically, significant features like SMA, Crossovers, Consecutive Price Trends, etc were selected using Lasso regularization. SPDR S&P 500 Trust (NYSE: SPY) dataset with 1-minute intervals from March 1st until May 24th, 2019. Models like logistic regression, CNN, RNN, LSTM, and SVM were used. SVM that used Polynomial kernels obtained the best accuracy and gave the best returns among other models. The authors highlight that higher accuracy might not always mean greater returns since there can be greater instances of small profits and fewer instancesofhugelosses.Futurescopesasdiscussedinthis paper are - modifying models to take into account the magnitude of profit/loss, assigning weights to different stocks based on their predicted probability, and trading accordingly.
HamoudiandElseif(2021)[6]testedtwotypesofmodels - 3 LSTM and 2 CNN which differed in their architecture. Only the top k (e.g. - 10) percentile of all the trades were labeled as positive trades for training purposes which is consistent with the study of S&P 500 historical returns according to which 10 days in a year are responsible for generatinganaverageof50%ofthetotalmarketreturnof that year and 50 days responsible for about 93%. The datasetisextractedfromtheJaneStreetMarketPrediction competition on Kaggle. The authors chose to use a rolling cross-validation approach owing to the sequential nature ofthedataset.Themodelsarethentrainedafterreplacing missing data points with feature median and normalizing the data. The models are then compared on the basis of measures like precision, recall, and F1 score and using financial performance metrics like the number of trades, Sharperatio,Totalreturn,etc.LSTM256x128wasfoundto be the best among all the other models that were tested withalmostdoublethetotalreturnsthananyothermodel.
Miao (2020) [6] employed LSTM to predict the closing price ofAmazon,Google,andFacebookafterrescalingthe data. The author confined the scope to only 3 stocks so that there is no unnecessary influence due to other industries. The author experimented by varying the hyperparameters of the LSTM like layers, dropout, batch size,andepoch,andcomparedthemonthebasisofRMSE onthe3datasets.
Toimplementa modelthat analyzesthedailypricesof all the stocks in an index and predicts trends in the closing
International Research Journal of Engineering and Technology (IRJET) e-ISSN:2395-0056
Volume: 09 Issue: 11 | Nov 2022 www.irjet.net p-ISSN:2395-0072
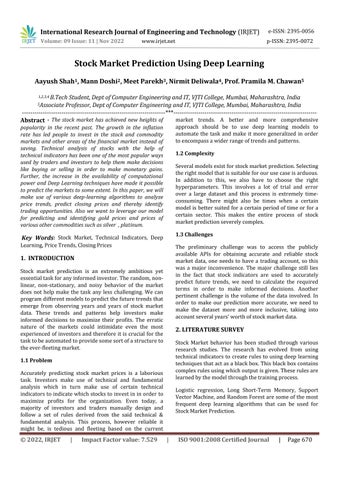
prices ofthestocksthushelping inidentifyingtradesthat give the most returns. This may help traders/investors to automate the task of shortlisting promising stocks and thus help them boost their profits. First, we obtain OHLC data for all the stocks. Then values of technical indicators and other features are derived from the data. Some preprocessingisthenperformedonthedataafterwhichit is fed to the model as input. The model then predicts the closingpriceofallthestocksforthenextdaywhichhelps decidewhattobuy/sell.
We aim to build a model that will analyze trends and predicttheclosingpriceofallthestocksattimet+1,given their history till time t. Thus, the model helps determine the stocks which will have a high probability of giving goodreturns.
For the purpose of building such a model, we would require huge amounts of data for training. For now, we will restrict the stocks under consideration to NIFTY 50. WecaneasilygetthedailyOHLCdataofthosestocksfrom the NSE website. Apart from OHLC, multiple features are calculatedusingthisdata.
Thisdata is then used to trainthe model. After the model istrained,itwillbeabletohelpshortliststocksthatcanbe tradedtoearnprofitsbyanalyzingpricetrends.
Inordertopredictstockprices,weneedhistoricaldataon all the stocks in NIFTY 50. The data available contains daily OHLC prices and the volume of the stocks. Other features are derived from the price data and appended to the dataset. The Lasso regularization method was used to select statistically significant features by reducing their correspondingcoefficientstozero.
Together, the OHLC and the derived features of all the stocksonalldaysinNIFTY50comprisesourrawdataset. The NIFTY50 index is updated every 6 months. To avoid survivorshipbiasthisfactistakenintoconsideration.
The data is then annotated. The intraday gain of every stock is calculated and the trade that occurs in the top k percentileislabeledas1,therestarelabeledas0.Rather than trading in every opportunity that is predicted as a probable profitable trade, the model will wait for a trade thatisidentifiedtobeinthetoppercentile.Thismethodis consistent with studies of historical returns on the S&P 500 and other market indices showing that the best 10 days in any given year are responsible for generating approximately 50% of the total market return for that
year. Furthermore, the best 50days in any given year are responsibleforabout93%ofthetotalreturnforthewhole year. Thus, it is better to focus on identifying the most profitable trading opportunity and avoiding taking an unnecessaryriskbyactingoneverypossibletradesignal.
Afterlabeling,variouspre-processingtasksareperformed on the data before feeding the data to the model for training. Random validation and test sets are not appropriate owing to the sequential nature of the data. Hence,arollingcross-validationapproachisadopted.
Transformation to achieve stationarity: Stationarydata refers to the time series data in which the mean and variance do not vary with time. The data is considered non-stationaryifastrongtrendorseasonalityisobserved. A common assumption in many time series techniques is that the data are stationary because many statistical analysis models are built upon the assumption that mean andvarianceareconsistentovertime.
Noise reduction using Wavelet Transformation: The basic idea behind wavelet denoising, or wavelet thresholding, is that the wavelet transforms lead to a sparse representationformanyreal-worldsignals,i.e. the wavelet transform concentrates the signal in a few largemagnitude wavelet coefficients. Wavelet coefficients that are small in value are typically noise, hence they can be reduced or removed without affecting the signal quality. The data is then reconstructed using the remaining coefficientsusingtheinversewavelettransform.
Outlier removal using z-score: Z score, also called the standard score, is an important concept in statistics that helps detect outliers. Z score value indicated the number of standard deviations a point is from the mean. If the z
International Research Journal of Engineering and Technology (IRJET)
e-ISSN:2395-0056
Volume: 09 Issue: 11 | Nov 2022 www.irjet.net p-ISSN:2395-0072
score of a data point is more than 3, it indicates an anomaly.Suchadatapointcanbeconsideredanoutlier.
Data Normalization: Normalization is used to ensure similar distribution of values across all features. Normalization gives equal importance to each variable, thus preventing a single variable with large values from steeringthemodelinitsdirection.Wehaveusedmin-max normalization for normalizing the data since it ensures that the values of all the features lie in the same range of values.
Technicalindicatorsareheuristicorpattern-basedsignals that are produced by the price, volume, and/or open interestofasecurityorcontract.Theyareusedbytraders who follow technical analysis. Following are some of the technical indicators derived from the closing price of the underlyingsecuritytohelptrainthemodel.
Global uncertainty in terms of political and geopolitical aspects is another crucial factor that affects stock prices and gold. The monetary policies adopted by major global Central Banks like the US Fed, the ECB, and the Bank of Japan have a pressing impact on gold prices. Economic growth in key economies like tax cuts, and big pushes to infra have an impact on gold prices as when a country is growing well, investors would typically prefer to participateinthis growththrough equitiesand rather not parktheirmoniesingold.
Measuring and leveraging Exchange rates, economic wellness,andcentralgoldreservesofmajorimportersand exporters of gold i.e. Switzerland, U.K., Singapore, Hong Kong, India, China, and Thailand will help us make better predictionsofgoldandrelatedcommodities.
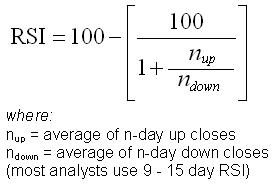
Relative strength index (RSI) is a technical indicator and displays momentum oscillations. It indicates overbought and oversold conditions for a particular security by measuringthemomentumoftherespectivesecurity.
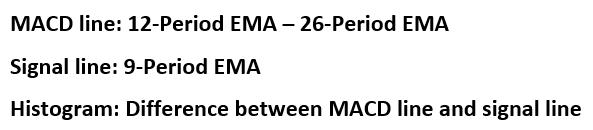
Moving average convergence divergence(MACD) is a technicalindicatorthatdisplaystheoccurrencesoftrends based on the momentum of the underlying security. It is derived from two exponential moving averages of the particularsecurity.
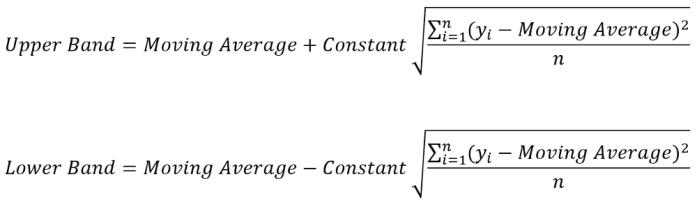
Stochastic is a momentum-based oscillator of a particular security across the range of its prices over a period of time. It generates indications of overbought and oversold levelsofsecuritysimilartoRSI.
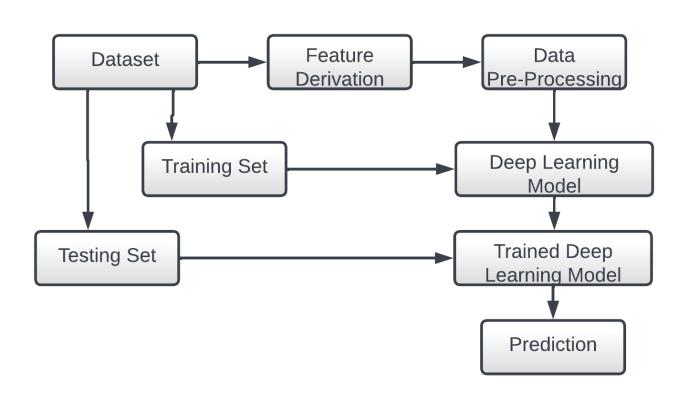
Bollinger Bands are technical indicators based on the volatility of the underlying security’s price. These bands are plotted at a particular value of the standard deviation ofthepriceofsecurityaboveandbelowtheactualvalue.
Asimplemovingaverage(SMA)iscalculatedbytakingthe average of a selected closing price ranges divided by the numberofperiodsinthatrange.
International Research Journal of Engineering and Technology (IRJET) e-ISSN:2395-0056
Volume: 09 Issue: 11 | Nov 2022 www.irjet.net p-ISSN:2395-0072
called maximum likelihood estimation (MLE) which is a conditional probability. If the probability is greater than 0.5, the predictions will be classified into the class 0. Otherwise,class1willbeassigned.
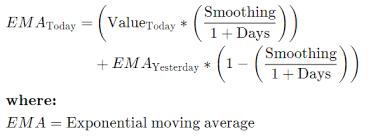
Exponential moving average (EMA) calculates a weighted average of the selected range of price of a security from the number of periods in that range. It gives more weight tothemorerecentpriceofthesecurity.
Convolutional Neural Network is a feed-forward neural network.Liketheclassicarchitectureof a neural network including input layers, hidden layers, and output layers, the convolutional neural network also contains these features and the input of the convolution layer is the output of the previous convolution layer or pooling. The number of hidden layers in a convolutional neural networkismorethanthatinatraditionalneuralnetwork, which, to some extent, shows the capability of the neural network.
An ordinary CNN model consists of three primary layers: TheConvolutionalLayer,ThePoolingLayer,andTheFully ConnectedLayer.
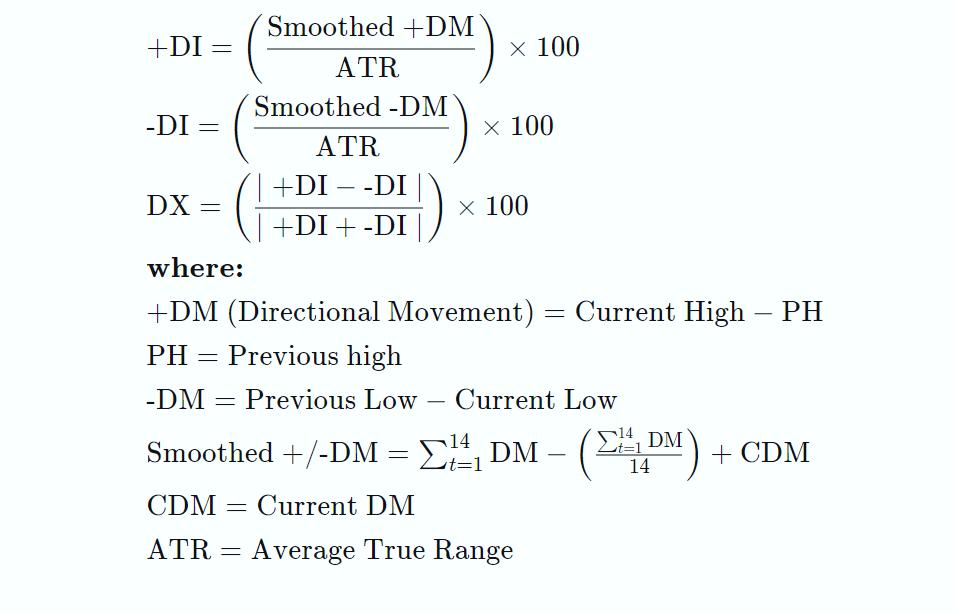
The Directional Movement Index (DMI) is a trend based oscillationindicatorthat measuresthestrengthofa trend ofthesecurity.
Supportvectormachines(SVMs)areagroupofsupervised learning methods aimed at solving problems related to classification, regression, and outlier detection. SVM’s target is to create the best line or decision boundary that can segregate n-dimensional space into classes which enables us to classify a new data point in the correct categoryinthefuture.Thisbestdecisionboundarycanbe calledahyperplane.SVMpickstheextremepoints/vectors that help in creating the hyperplane. These boundary casesarecalledsupportvectors.
LongShort-TermMemoryNetworkisanadvancedRNN,a sequential network, that allows information to persist, thus enabling it to make predictions in the time domain. LSTMtakescare ofthe vanishinggradient problem which was an issue in RNN. Since LSTMs are effective at capturing long-term temporal dependencies without suffering from problems faced by RNNs, they have been usedinmanystate-of-the-artmodels.
Logisticregressionisaprocessofmodelingtheprobability of an outcome for an input variable. The most common logistic regression models an output that could have values such as true/false, yes/no, and so on. While in Linear Regression MSE or RMSE is used as the loss function, logistic regression makes use of a loss function
ThefollowingarethecomponentsofanLSTMnetwork:
1. Forget Gate: The forget gate forgets information that is not useful, thus giving importance to what really matters.
2. LearnGate:Currentinputandshort-termmemory are combined together so thatnecessary informationthat
International Research Journal of Engineering and Technology (IRJET)
e-ISSN:2395-0056
we have recently learned can be applied to the current input.
3. RememberGate:AnupdatedLTMisformedinthe Remember gate by combining information obtained from LTMandSTM.
4. Use Gate: This gate also uses LTM, and STM as a combinedSTMtopredicttheoutputofthecurrentevent
AE-LSTMisanimplementationofanautoencoderusingan Encoder-Decoder LSTM architecture. An encoder-decoder LSTM is configured to encode, decode, and recreate an inputsequence.
Theperformanceofthemodelisevaluatedonthebasisof to what extent the model recreates the original sequence. Aftertrainingtheencode-decodermodel,thedecoderpart ofthe model is discarded, leaving just the encoder model. The resulting model is then used to encode input sequences to a fixed-length vector. The resulting vectors can then be used in applications like compression. The trainingobjectiveforcestheencodertoincludeonlyuseful features/trends in the fixed-length vector, which then servesasanimprovedinputtothepredictionmodel.
Random forest is a Supervised Machine Learning Algorithm that is used mainly in classification or regression models. It builds decision trees on different samplesandperformsaggregationontheoutputgiven by thesedecisiontrees.
Stepsinvolvedintherandomforestalgorithm:
Step1:First,nnumberofrandomrecordsoutofkrecords fromthedataset.
Step 2: Different decision trees are constructed for each sample.
Step 3: Each decision tree, created on different samples, will generate an output. Thus, we will have multiple intermediateoutputs.
Step4:MajorityVotingorAveragingforClassificationand regression respectively is performed to compute the final output.
Ensemblelearningishow multiplemodels,likeclassifiers or experts, are critically generated and combined to solve
problems.Ensemblelearningisprimarilyusedtoimprove the (classification, prediction, function approximation, etc.) performance of a model,or reduce the chances of an unfortunateselectionofalessthoroughone.
By using bootstrapped replicas of the training data the diversity of classifiers in bagging is obtained. From the entiretrainingdataset,withreplacementdifferenttraining data subsets are randomly drawn. Each training data subset isutilized to traina different classifier of thesame type. By taking a simple majority vote on their decisions , individualclassifiersarethencombined.Theclasschosen bythemostnumberofclassifiersistheensembledecision foranygiveninstance.
Eveninbagging,wecreatemanyclassifiersbyresampling thedata,whichfurtherarecombinedbymajorityvoting. Butit differsin resampling oftraining data .Here we tend to provide most informative training data for each successiveclassifier.
Explaining further , each iteration of boosting creates 3 weak classifiers , the 1st classifier C1 being trained on a random subset of available training data ,c2 being fed the most informative training data with 50% of which was correctly classified by its predecessor and remaining half misclassified . C3 is trained with instances where C1 and C2 diaggree and all 3 classifiers are combined via 3 way majority.
Inthecontext of reinforcement learning,anagent obtains information from the environment. The agent adapts the received data to the environment’s current state. The AI then decides on an action to be taken based on the rewards associated with each choice. Moreover, each action alters the environment and the total number of rewardpoints.Reinforcementsforrewardingorpunishing specific actionsareimmediatelyaddedonthebasisofthe new state. This interaction between action and environmentwillpersistuntiltheagentmasterstheartof choosing a decision strategy that maximizes the total return.
Input:Initialconditionsforthemodeltobeginwith
Volume: 09 Issue: 11 | Nov 2022 www.irjet.net p-ISSN:2395-0072 © 2022, IRJET | Impact Factor value: 7.529 | ISO 9001:2008 Certified Journal | Page675
Output:Possibleoutputsinaccordancewiththevarietyof solutionspossibletoaparticularproblem
International Research Journal of Engineering and Technology (IRJET) e-ISSN:2395-0056
Volume: 09 Issue: 11 | Nov 2022 www.irjet.net p-ISSN:2395-0072
Training: Based on the current conditions and possible actionsandlong termgoals,themodel takesaction.And based on its action the model will be punished or rewarded.
Themodelcontinuestolearn.
The best solution is determined based on the maximum reward.
FewbasicelementsofanRLproblem:
Environment The physical world in which the agent operatesandwillreceivefeedbackfrom.
State Explainsthecurrentsituationoftheagent
Reward Feedback received from the environment basedontheaction
Policy This helps in choosing which actions to take basedonone'scurrentstate.
Value Longtermrewardthatthemodelaimstoachieve
In this research paper we have provided an overview of the relevant research that has been carried out in similar fields.Weprovidea review andrelativestudyofdifferent deeplearningmodelsthathavebeenusedforthepurpose of predicting stock market prices. The purpose of a stock market price prediction system is to analyze current trendsandpredictprices.Thiswillhelpshortlistprobable winningtradestherebyprovidingprofits.
[1] M. Faraz, H. Khaloozadeh and M. Abbasi, "Stock Market Prediction-by-Prediction Based on Autoencoder Long Short-Term Memory Networks," 2020 28th Iranian ConferenceonElectricalEngineering(ICEE),2020,pp.1-5, doi:10.1109/ICEE50131.2020.9261055.
[2] Ghosh, P., Neufeld, A., & Sahoo, J. K. (2020). Forecasting directional movements of stock prices for intraday trading using LSTM and random forests. arXiv. https://doi.org/10.48550/arXiv.2004.10178
[3] G. Taroon, A. Tomar, C. Manjunath, M. Balamurugan, B. Ghosh and A. V. N. Krishna, "Employing Deep Learning In Intraday Stock Trading," 2020 Fifth International Conference on Research in Computational Intelligence and Communication Networks (ICRCICN), 2020, pp. 209-214, doi: 10.1109/ICRCICN50933.2020.9296174.
[4] Nabil MABROUK, Marouane CHIHAB, Zakaria HACHKAR and Younes CHIHAB, “Intraday Trading StrategybasedonGatedRecurrentUnitandConvolutional Neural Network: Forecasting Daily Price Direction” International Journal of Advanced Computer Science and Applications(IJACSA), 13(3), 2022. http://dx.doi.org/10.14569/IJACSA.2022.0130369
[5] Art Paspanthong, Nick Tantivasadakarn and Will Vithayapalert. (2019). Machine Learning in Intraday Stock Trading. Computer Science Department, Stanford University.
[6] Hamdy Hamoudi and Mohamed A Elseif. (2021). Stock Market Prediction using CNN and LSTM. Computer ScienceDepartment,StanfordUniversity.
[7] Yan Miao. (2020). A Deep Learning Approach for Stock Market Prediction. Computer Science Department, StanfordUniversity.
[8] https://www.motilaloswal.com/blogdetails/What-factors-impact-the-price-of-gold-in-theglobal-markets/1310
[9] https://www.bankbazaar.com/gold-rate/top-5factors-that-affect-gold-rate-in-india.html
Aayush Shah, B. Tech Student, Dept. of Computer Engineering and IT, VJTI College, Mumbai, Maharashtra,India

Mann Doshi, B. Tech Student, Dept. of Computer Engineering and IT, VJTI College, Mumbai, Maharashtra,India

Meet Parekh, B Tech Student, Dept. of Computer Engineering and IT, VJTI College, Mumbai, Maharashtra,India.

International Research Journal of Engineering and Technology (IRJET) e-ISSN:2395-0056
Volume: 09 Issue: 11 | Nov 2022 www.irjet.net p-ISSN:2395-0072
Nirmit Deliwala, B. Tech Student, Dept. of Computer Engineering and IT, VJTI College, Mumbai,Maharashtra,India.

Prof. Pramila M. Chawan is working as an Associate Professor in the Computer Engineering Department of VJTI, Mumbai. She has done her B.E. (Computer Engineering) and M.E. (Computer Engineering) from VJTI College of Engineering, Mumbai University.Shehas28yearsofteaching experienceandhasguided80+M.Tech.projectsand100+ B. Tech. projects. She has published 134 papers in International Journals and 20 papers in National/InternationalConferences/Symposiums.Shehas worked as an Organizing Committee member for 21 International Conferences and 5 AICTE/MHRD sponsored Workshops/STTPs/FDPs. She has participated in 14 National/International Conferences. She has worked as NBA Coordinator of the Computer Engineering DepartmentofVJTIfor5years.Shehadwrittenaproposal under TEQIP-I in June 2004 for ‘Creating Central Computing Facility at VJTI’. Rs. Eight Crores were sanctioned by the World Bank under TEQIP-I on this proposal. The Central Computing Facility was set up at VJTI through this fund which has played a key role in improvingtheteaching-learningprocessatVJTI.