International Research Journal of Engineering and Technology (IRJET) e-ISSN:2395-0056

Volume: 09 Issue: 11 | Nov 2022 www.irjet.net p-ISSN:2395-0072
International Research Journal of Engineering and Technology (IRJET) e-ISSN:2395-0056
Volume: 09 Issue: 11 | Nov 2022 www.irjet.net p-ISSN:2395-0072
T.Swapna1 , T.Shivani2 , P.Srija3 , D.Akhila4 , P.Srinidhi5
1 Asst.Professor , CSE Department, G Narayanamma Institute of Technology and Science, Telangana, India. 2,3,4,5 Students, CSE Department, G Narayanamma Institute of Technology and Science, Telangana, India. ***
Abstract Diabeticretinopathy(DR)isahumaneyediseasefoundindiabeticsthatdamagestheretinaandcanleadtolongtermvisionloss.Itcausesvisualimpairmentand,intheworstcase,severeblindnessaslesionsformintheretinaduetorupture of retinal vessels. Early detection of the diseasehas become critical to avoid exacerbation and difficulty in identifying subtle lesions in advanced stages of the disease. The main cause of blindness isbelieved to be asymptomatic in the early stages. Diagnosisofthesediseasesistime-consuminganddifficultforophthalmologists.EarlydetectionandclassificationofDRcasesis an important step in providing needed treatment. This work is mainly focused on DR detection and classification based on features extracted from retinal fundus images. Feature extraction for DR detection and classification includes microaneurysm detection and Exudatesdetection. The proposed system consists of phases such as Pre-processing which includes image resizing,Greenchannelseparation,andCLAHE (ContrastLimitedAdaptiveHistogramEqualization),Gray-LevelCo-occurrence Matrix (GLCM)-based method is used to extract textural features, i.e., exudates and microaneurysms, from retinal fundus images.Evaluatingtheresults,theproposedmethodshowedbetterperformanceonreal-timedatasetcollectedfromLVPrasad EyeHospital.
Keywords Machine Learning, Diabetic Retinopathy, Image Processing, Microaneurysm detection, Exudates detection
Theanatomyoftheeyeiscomplicated.Themajorstructuresoftheeyehaveassociatedchangesthatcanaffecttheeye andsurroundingstructures.Diabeticretinopathyistheleadingcauseofblindnessinadultsfromage20toage74intheUnited States. Diabeticretinopathyiscausedbyelevatedglucoselevelsintheopticnerve.Highbloodsugarcanblockbloodvesselsin the optic nerve,causing leakage and swelling. There are several signs to recognize Diabetic Retinopathy, such as microaneurysms(MAs),hemorrhages,hard exudates,cotton wool spots,and venous loops.Undercertainconditions,theopticnerve of patients with diabetic retinopathy experiencesabnormalitiesasitgrowsonthesurfaceoftheretina.Ifnotdetectedearly,it can lead to blindness. Symptoms in DR patientsare difficult to identify and it is too late for effective treatment. Therefore, detection and early medical intervention are critical. Ophthalmologists typically observe DR based on features such as vessel segmentation, hemorrhage, microaneurysms (MA), texture, and vasodilation. MA is the first scientific sign indicating and identifyingasredlesionsofdiabeticretinopathy.
Thebasicmethodofdiagnosisisforadoctortoexamineaperson'seyesandperformteststodeterminewhatdiseasethe personhas. Detecting and classifying diabetic retinopathy is a time-consuming process, and time is of the essence when cases are severe. Therefore,anautomated systemisrequired todothejobcorrectlyand efficiently.Early diagnosisandcontinuous monitoringofpatientssufferingfromoculardiseaseshavebeenmajorconcernsincomputer-aideddetectiontechniques.
Texture features have properties that describe visual patterns based on the spatial definition of an image. Identifying a particular textureinanimageisdonebyrepresenting thetextureasatwo-dimensional Gray-levelvariationknownasaGraylevel co-occurrence matrix (GLCM). GLCM is defined as a statistical method for finding textures that considers spatial relationships of pixels. The GLCMfunction computes the frequency of occurrence of pixel pairs with a particular value and a particular pixel relationship in the image, and subsequently extracts a statistical measure from a matrix defining normalized probabilitiesoftheco-occurrencematrixtodeterminethetextureoftheimage.
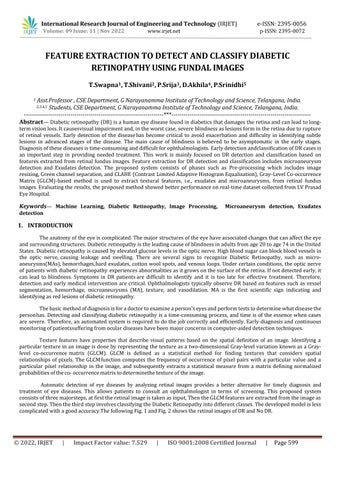
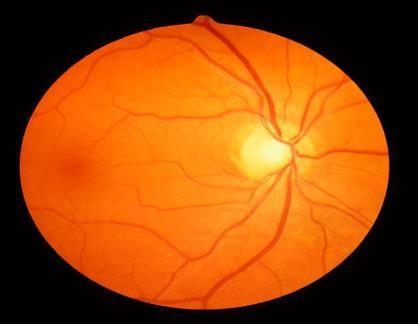
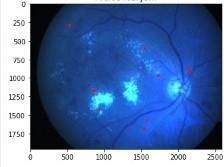
Automatic detection of eye diseases by analyzing retinal images provides a better alternative for timely diagnosis and treatment of eye diseases. This allows patients to consult an ophthalmologist in terms of screening. This proposed system consistsofthreemajorsteps,atfirsttheretinalimageistakenasinput,ThentheGLCMfeaturesareextractedfromtheimageas secondstep.ThenthethirdstepinvolvesclassifyingtheDiabeticRetinopathyintodifferentclasses.Thedevelopedmodelisless complicatedwithagoodaccuracy.ThefollowingFig.1andFig.2showstheretinalimagesofDRandNoDR.
2395-0056
[Helena M. Pakter and et.al 2011] suggested a computer-assisted method of retinal vessel analysis by a micro densitometry methodofcolorretinographywasabletopreciselymeasurethecompletebloodcolumnthatfillsthevessellumen,includingthe centralredbloodcellsandtheperipheralplasmastream.Studiesofcorrelationsbetweenvesseldiametersandcardiovascular outcomes should thereforeassume that micro densitometry methods of color FPs measure only the complete vessel lumen. Pearsoncorrelation coefficients and Bland-Altman plots were used to evaluate the agreement between the measurements made by FPandFA.Itis not clearwhich componentofthevesselstheyaremeasuring[1].
[R. Priya and P. Aruna 2013]developedasystemusedpre-processingtechniqueslikeGrayscaleconversion,AdaptiveHistogram Equalization, Discrete Wavelet Transform, Matched filter Response and Fuzzy C-means segmentation are applied. From the pre-processedimages,featureswereextractedfortheclassificationprocess.Asanachievementofthiswork,theDRhasbeen classified into two categories NPDR and PDR using PNN, Bayes theory and SVM. All the three techniques used for the classificationweregoodinperformance,butSVMismoreefficientthanPNNandBayesTheoryfromtheobtainedresults.Thus this work has given a successfulDiabetic Retinopathy Diagnosing method which helps to diagnose the disease in early stage whichmutuallyreducesthemanualwork.PNNhasachievedanaccuracyof87.69%BayesClassifierhasanaccuracyof90.76% andSVMhasanaccuracyof95.38%[2].
[Muhammad Moazam Fraz, and et.al 2010] proposedanAnEnsembleClassification-BasedApproachAppliedtoRetinalBloodVessel Segmentation. In this paper, they have presented an effective retinal vessel segmentation technique based on supervised classification using an ensemble classifier of boosted and bagged decision trees. They have used a 9-D feature vector which consistsofthevesselmapobtainedfromtheorientationanalysisofthegradientvectorfield,themorphologicaltransformation; line strength measures and the Gabor filter response which encodes information to successfully handle both normal and pathological retinas. The ensemble classifier was constructed by using 200 weak learners and is trained on 20 0000 training samples randomly extracted from the trainingset of the DRIVE and 75000 samples from STARE databases. Their algorithm achieved best accuracy in the case of the cross-trained classifierforDRIVEandSTARE;thecross-trainedaccuracyofMarinis slightly better. In addition, the simplicity of the method shouldalso be high-lighted. The algorithm is a suitable tool for automatedretinalimageanalysis[3].
[S. Muthu Lakshmi et. al 2010] suggested a Supervised Blood Vessel Segmentation in Retinal Images Using Feature Based Classification. Thispaperproposesasupervisedmethodforbloodvesseldetectionbasedonfeatureclassification.Therequired featurevector is calculated from the preprocessed retinal images in the neighbourhood of thepixel under consideration. The followingprocessstagesmaybeidentified: 1. Selectingtheinputimagefromthedatabase,2. FundusimagepreprocessingforGraylevelhomogenizationandbloodvesselenhancement,3.Featureextractionforpixelnumericalrepresentation,4.Postprocessing for removing the falsely detected isolated pixels. The input images are read from the DRIVE database. The green channel provides the best vessel-background contrast of the RGB representation. This method of blood vessel detection uses feature based pixel classification. Membership value ofthese feature based image is also used to segment the blood vessel but The resultsobtainedforregiongrowingalgorithmarenotcompletelysatisfactory[4].
[P. C. Siddalingaswamy, and et.al 2010] proposed an Automatic detection of multiple oriented blood vessels in retinal images Automatic segmentation of the vasculature in retinal images is important in the detection of diabetic retinopathy that affects the morphology of the blood vessel tree. In this paper, a hybrid method for efficient segmentation of multiple oriented blood vesselsincolourretinalimagesisproposed.Initially,theappearanceofthebloodvesselsisenhancedandback-groundnoiseis suppressedwiththesetofrealcomponentofacomplexGaborfilters.Thenthevesselpixelsaredetectedinthevesselenhanced imageusing entropic thresholdingbasedonGraylevelco-occurrencematrixasittakesintoaccountthespatialdistributionof Gray levels andpreserving thespatial structures. The performance of the method is illustrated on two sets of retinal images from publiclyavailableDRIVE(Digital Retinal Images forVessel Extraction)and Hoover’sdatabases.For DRIVEdatabase, the
International Research Journal of Engineering and Technology (IRJET) e-ISSN:2395-0056
Volume: 09 Issue: 11 | Nov 2022 www.irjet.net p-ISSN:2395-0072
blood vessels are detected with sensitivity of86.47±3.6 (Mean±SD) and specificity of 96±1.01. These images are of very large variability in terms of fundus disease and image quality and were used to test the robustness of proposed retinal vessel detection method but These methods suffer from problems associated with detecting smaller and tortuous vessels that are pronetochangesinbackgroundintensity[5].
[Ana Maria Mendonça, and et.al 2007] proposedanalgorithmfortheautomateddetectionoftheretinalvascularnetworkwhich combines differential filters, for centerline extraction, with morphological operators, used for filling vessel segments. Several intensityand morphological properties of vascularstructures, such as linearity, connectivity, and width, are considered in the approach. The segmentation of blood vessels here in described has the following main phases: 1) image preprocessing for backgroundnormalizationandthinvesselenhancement;2)vesselcenterlinedetectionfordefiningasetofpointsinthecentral partof thevessels; 3) seeded regiongrowing, to fill finally the blood vessels. Vessel centerlines, considered as local intensity maximaalongvesselcrossprofiles,aredetectedusingthesignsoffourdirectionaloperators.Thesecenterlinesegmentsarethe seedsforaniterativeregion growingprocess, whichin eachstepusesonelevel of a multiscalerepresentationofthevascular structure based on a morphological approach with variable sized structuring elements. The method was evaluated using the images of two publicly available databases, the DRIVE database and the STARE database.This algorithm outperforms other solutions and approximates the average accuracy of a human observer without a significant degradation of sensitivity and specificity.Ithasnotyetbeenextensivelyexplored[6].
[Jingdan Zhang Yingjie Cui, and et.al 2015] proposed Blood Vessel Segmentation of Retinal Images Based on Neural Network Thisstudyproposesaretinalvesselsegmentationmethodbasedonneuralnetworkalgorithm.Toovercometheproblemoflow contrastandlargevariabilityinretinalimages,andconstructthefeaturevectorwiththeintensityfromgreenchannelandthe vesselenhancedintensityfeature.Then,classifythepixelsinretinalimagewithSOMalgorithm.Finally,labeleachneuroninthe output layer of SOM.as retinal neuron or non-vessel neuron with Otsu’s method, and get the final segmentation results. The method is validated on the DRIVE database with available gold standard images. From the visual inspection and quantitative validation of the method in the experiments, it is evident that the proposed method is robust to the low contrast and large variabilityintheretinalimages,andgetsaccuratesegmentationresults.[7].
[Benson S. Y. Lam, and et.al 2010] suggested a General Retinal Vessel Segmentation Using Regularization - based Multiconcavity modeling. This paper presents a novel regularization -based multi -concavity approach for effectively segmenting bloodvesselsin bothnormal and pathological retinas with bright and dark lesions in a single system. A perceptive transform derived from Weber’s law is proposed to map an input image into a perceptive space for robust vessel segmentation. The results showed that system performances of both accuracy and R area tested on grey -scale intensity, RGB and L*a*b* color channelsareconsistentlybetterintheperceptivespacethanintheimagespace,demonstratingthebroadereffectivenessofthe proposed perceptive space method. As the bright lesion has a steep intensity transition profile, measuring the degree of concavity can effectively distinguish the bright lesions from the vesselsand non -vessels. The proposed method shows very attractiveperformancesnotonlyonhealthyretinasbutalsoonamixtureofhealthyandpathologicalretinas[8].
[Razieh Akhavan, and et.al 2010] proposed A Novel Retinal Blood Vessel Segmentation Algorithm using Fuzzy segmentation. This technique is based on vessel centerline detection and fuzzy segmentation. The proposed vessel extraction technique has consistent performance in both normal and abnormal images. To validate the proposed method, they used images provided from two public databases, DRIVEand STARE databases.They couldachieve the greatest specificity,accuracyandsensitivity, 95.13%,72.52%and97.33%fortheDRIVEdatabaseand95.37%,77.66%and96.80%fortheSTAREdatabase.Thisalgorithm isveryeffectivemethodtodetectretinalbloodvessels[9].
[Attila Budai, and et.al 2010] proposedMultiscaleBloodVesselSegmentationinRetinalFundusImages.Theproposedalgorithm startswiththeextractionofbloodvesselcenterlinepixels.Thefinalsegmentationisobtainedusinganiterativeregion growing method that merges the binary images resulting from centerline detection part with the image resulting from fuzzy vessel segmentation part. In thisproposed algorithm, thebloodvessel is enhanced usingmodified morphological operationsandthe saltandpeppernoisesareremovedfromretinalimagesusingAdaptiveFuzzySwitchingMedianfilter.Thismethodisappliedon two publicly available databases, the DRIVE and the STARE and the experimental results obtained by using green channel imageshavebeenpresentedandcomparedwithrecentlypublishedmethods.Theresultsdemonstratethatthealgorithmisvery effectivemethodtodetectretinalbloodvessels.
Most of the existing algorithms used DRIVE and STARE databases, and majorly concentrated on Blood Vessels segmentation [10].
Our proposed system uses a real time dataset labelled by an expert ophthalmologists and focused on extracting the features Micro- aneurysms detection, andExudates detection for detecting and SVM algorithm is used forclassifying DR into different classes.
International Research Journal of Engineering and Technology (IRJET)
e-ISSN:2395-0056
Volume: 09 Issue: 11 | Nov 2022 www.irjet.net p-ISSN:2395-0072
Real-time dataset is collected for classification to overcome all shortcomings of existing systems. In existing systems, theimagesusedarealreadyprocessedathighresolution.However,inrealtime,imagescanhavevariousresolutionissues,noise, and imagesharpness issues. Here for this work the retinal fundus images are collected from the L V Prasad eye institution. It consists of 250 fundusimages of diabetic retinopathy.Fundus images are captured by various cameras in the market, such as Canon,Zeiss,andKowa,resultinginvariedimageresolutions.Annotationswerelabelledbytrainedhumanexpert.
Thedatasetincludesimagesbelongingto5differentclasses.
MILDDRconsists50images
SEVEREDRconsists50images
MODERATEDRconsists50images
PDRconsistsof50images
NON-DRconsistsof50images
The proposed image processing model for DR detection and classification is mainly used to analyze the blood vessel of the retinal fundus image for the features exudates, microaneurysms. Exudate is a lipid and lipoprotein deposit that occurs near leakycapillariesintheretina.InthefirststageofDR,theretinalimagecontainsmanysmallredspots 10–100μmindiameter. These tiny red spots are called microaneurysms. The retinal fundus images may be subjected to noise, low contrast, nonuniformillumination,diffusionandvariationinlightreflection,differencesincamerasanddifferenceinretinalchrome.
Toslimdowntheimagevariationsandtoamendtheimagequalitythepre-processingstageisreallyimportant.Medianfilteris appliedto green plane images to decrease the noise before a (CLAHE) Contrast Limited Adaptive Histogram Equalization is applied. Thresholding segmentation is applied to extract foreground of the image. Gray Level Co-occurrence Matrix (GLCM) algorithmisusedtogetthefeaturesofsegmentedimagessuchasEnergy,Entropy,Homogenity,Contrast,Correlation.Overthe extractedGLCM features,SupportVectorMachine,a machinelearningtechniqueisappliedtoclassifytheimageintodifferent classes. This research represents a possible improvement in the detection and classification of diabetic retinopathy over real timeimagesandfinallytheperformanceofproposedmodeliscalculatedusingaccuracy,precision,andrecall.
International Research Journal of Engineering and Technology (IRJET) e-ISSN:2395-0056 Volume: 09 Issue: 11 | Nov 2022 www.irjet.net p-ISSN:2395-0072
ThearchitectureofthemodelFig.3showstheentireprocess.
Dataset
Image Resize
Channel separation


Morphological
Thresholding
Input image GLCM
Feature Extraction Exudates
Microaneurysms
SVM Disease classification
Classification
Mild Severe PDR Moderate
Fig. 3 Architectureoftheproposedsystem
Themodulesintheproposedmodelare:
Inthefirststage,thecollectedinputimagesundergopreprocessing.Thisinvolvesresizingtheimageto256x256and extractingthegreenchanneloftheimage.Toreduceimagevariabilityandimproveimagequality,amedianfilterisappliedtothe greenplaneimagetoreducenoisebefore(CLAHE)contrast-limitedadaptivehistogramequalizationisapplied.Medianfilteringis anonlinearmethodusedtoreducenoise.CLAHEalgorithmisappliedtoimprovethecontrastoftheimagewhichhelpsinbetter featureextraction.
Image segmentation aims to subdivide and group similar regions or segments of an image under their respective class designation. Thisstepconvertsthe greenchannel image toa Grayscalebinaryimage.Thesimplestmethodofsegmentation in imageprocessingisthe thresholdmethod.Subdividethepixelsintheimagebycomparingthepixelintensitytoacertainvalue (80).Sincetheretinal image hasa higher intensity than the background, using a threshold for segmentation purposes is very appropriate.
International Research Journal of Engineering and Technology (IRJET) e-ISSN:2395-0056
Volume: 09 Issue: 11 | Nov 2022 www.irjet.net p-ISSN:2395-0072
In this step, the GLCM algorithm is used to extract the textural features from the images and those extracted features will be savedasthetrainandtestfeatures.
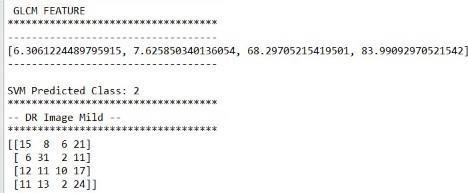
CalculatetheselectedFeature.ThiscalculationusesonlythevaluesintheGLCM.Let(��,��)representimagesofsize����and���� thathavepixelswithLlevelsandristhedirectionvectorofspatialoffset.(��,)isaGLCMfunctionanddefinedbythenumberof pixels(��)occurringatoffsetrtopixel(��)andwheretheoffsetrcanbeanangleordistance,��∈1,2, ,��and��∈1,2, .,�� GLCMfunctioncanbeseeninequation(��,)={(��1,��1),(��2,��2)}.(1)
1. Contrast: Contrastistheratioofthebrightnessintensitybetweenpixelofthatimage.Thatresultoftheimageisgood ifthathaveahighbrightnessintensity.Contrastcanbeobtainedwithequation ����������������=∑∑|�� ��|2(��,)��������,(2)where��(��,��)ismatricsco-occurrence,��∈1,2, ,��and��∈1,2, ,��
2. Homogeneity:HomogeneityisavaluefromthelevelofuniformityatthelocalGraylevel.Homogeneityiscanbecalled Inverse Difference Moment (IDM). Homogeneity is inversely proportional to the value of contrast and high contrast valuehavelowhomogeneity).Thehomogeneityequationcanbeseeninequation.
����������������������=∑∑(��,)21+(�� ��)2����=1����=1.
3. Entropy: Entropy can be used to search for information on images and the results obtained based on the amount of missinginformationpresentintheimageTheentropyequationcanbeseeninequation.
��������������=∑∑(��,��)(−ln��(��,��)).����=1����=1
4. Energy: Energyistheuniformityofco-occurrencematrix.ThisenergycanalsobecalledAngularSecondMoment.The energyequationcanbeseeninequation. ������������=∑∑(��,)��2��=1����=1.
5. Correlation: Correlationsareusedtomeasurethedegreeofinterconnectednessordependencybetweenpixelsand otherpixels
Thecorrelationequationcanbeseeninequation.
����������������������=∑∑(�� )(�� ����)��(��,��)������������=1����=1,where����=∑��∑��(��,��)���� ����=∑��∑��(��,��)���� ����=∑(�� ����)2∑��(��,��)���� ����=∑(�� ����)2∑��(��,��)����
This step uses an SVM classifier to classify the input as mild, severe ,moderate , PDR and No DR images. The Support Vector Machineisusedforclassification,becauseitissuitableforsmallerdatasetsandalsogivesgreateraccuracy,itworksreallywell withaclearmarginofseparation,anditiseffectiveinhighdimensionalspaces.Basedonthefeaturesextractedfromtheretinal image,itwillbeconcludedthatwhetherthegivenretinalimageiseffectedwithdiabeticretinopathyornotandeachimagein theframeisfurtherclassifiedasabnormal(PDR,MILD,MODERATE,SEVERE)ornormal(normalretinalimage).
Truepositive(TP)=thenumberofcasescorrectlyidentifiedaspatient.
Falsepositive(FP)=thenumberofcasesincorrectlyidentifiedaspatient.
Truenegative(TN)=thenumberofcasescorrectlyidentifiedashealthy.
Falsenegative(FN)=thenumberofcasesincorrectlyidentifiedashealthy.
International Research Journal of Engineering and Technology (IRJET)
e-ISSN:2395-0056
Volume: 09 Issue: 11 | Nov 2022 www.irjet.net p-ISSN:2395-0072
Accuracy:Theaccuracyofatestisitsabilitytodifferentiatethepatientandhealthycasescorrectly.Toestimatetheaccuracyof atest,weshouldcalculatetheproportionoftruepositiveandtruenegativeinallevaluatedcases.Mathematically,thiscanbe statedas:
Accuracy=(TP+TN)/(TP+TN+FP+FN);
Precision: The Precision evaluates the fraction of rightly classified instances or samples among the ones classified as positives.Therefore,theformulaoftheprecisioncanbemathematicallywrittenas,
Precision=TP/(TP+FP)
Recall:TheRecallistheabilityofamodeltofindalltherelevantcaseswithinadataset.Mathematically,wedefinerecallasthe numberoftruepositivesdividedbythenumberoftruepositivesplusthenumberoffalsenegativeswrittenas,
Recall=TP/(TP+FN).
Inordertoshowthegeneralizationabilityoftheproposedsystem,weevaluatedtheperformanceoftheproposedsystemusing the fundus images datasetthatisprovided byLVPEI hospital, which consistsof several diabetic retinopathies affected retinal images aboutof 250 images, that is adequate for the GLCM based model. The feature extraction starts from an initial set of measureddataandbuildsderivedvalues(features)intendedtobeinformativeand non-redundant,facilitatingthesubsequent learning and generalization steps, and in some cases leading to better human interpretations. The Categorical classifier is trainedusingfeaturesextractedfromtheretinalimagesdatatrainingsetandtestedonone-fourthoftheretinalimagesdataset. Asimplefunctioniscreated,ittakesthefilenameoftheimage(alongwithpath)asinputandloaditusingloadimagemethodof imagescalingandresizetheimageas250X250withthehelpofmatplotlibplotit,convertitintoarastergraphicsimagewith nolossofquality,anewimagewithahigherorlowernumberofpixelsmustbegenerated,whichwepassasaninputtopredict methodofthemodelobject.Thesegmentedregionsareconsideredforthepredictionofdiabeticretinopathyfeatureextraction andclassificationoftheimage,consideringtheGLCMfeaturesvaluesthatarestoredinpicklefile.
TypeofDR No.ofImages PDR 50 MILD 50 SEVERE 50 NORMAL 50 MODERATE 50
Table1:Totalnumberofimages:250
Thedataisdividedintotraindataandvalidationdata.Thetrainingdataconsistsof195imagesofeachdiseaseincluding normal.Thetestingdataconsistsof55imagesofeachdiseaseincludingnormal.
International Research Journal of Engineering and Technology (IRJET)
e-ISSN:2395-0056
Volume: 09 Issue: 11 | Nov 2022 www.irjet.net p-ISSN:2395-0072
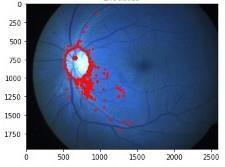
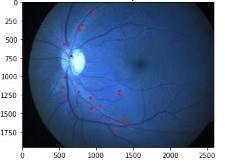
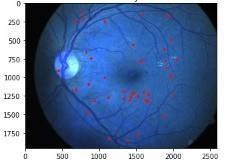
Fig.4:Microaneurysmsextraction
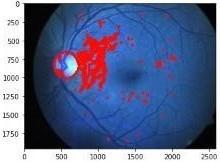
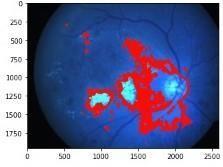
Fig.5Exudatesextraction
Fig.7Microaneurysmsextraction
Fig.8Exudatesextraction
International Research Journal of Engineering and Technology (IRJET) e-ISSN:2395-0056
Volume: 09 Issue: 11 | Nov 2022 www.irjet.net p-ISSN:2395-0072
Fig.9 DRimageclassifiedasModerate
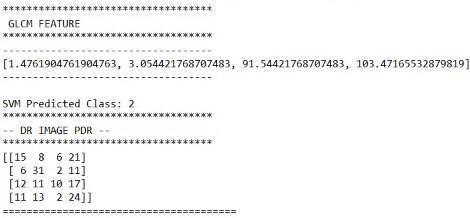
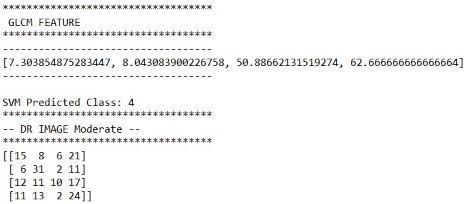
Fig.12.DRimagepredictedasPDR
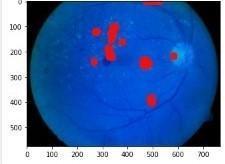
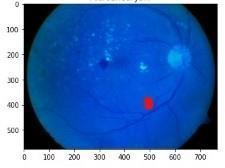
Fig.13Microaneurysmsextraction
Fig.14Exudatesextraction
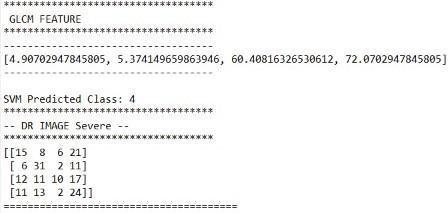
Fig.15DRimagepredictedasSevere
Theresultsofthemodelaremeasuredusingperformancemetricssuchasaccuracy,precisionandrecall.Theaccuracy, precisionandrecallmeasuresremainsconstantoverthe250images.
Fig.16Performanceoftheclassifier
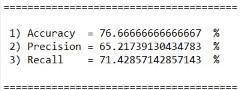
TheAccuracyofatestisitsabilitytodifferentiatethepatientandhealthycasescorrectly.Toestimatetheaccuracyofatest,we shouldcalculatetheproportionoftruepositiveandtruenegativeinallevaluatedcases.Mathematically,thiscanbestatedas: Accuracy =(TruePositives+TrueNegatives)/(Truepositives+TrueNegatives+FalsePositives+FalseNegatives)Themodel gaveusanoverallaccuracyof76.67%,precisionvalueof65.21%,andRecallvalueof71.43%.
We proposed a GLCM based feature extraction model for extracting features of retinal images to detect Diabetic Retinopathydisease. The proposed method has several unique characteristics. First, our retinal fundus images go through
International Research Journal of Engineering and Technology (IRJET) e-ISSN:2395-0056
Volume: 09 Issue: 11 | Nov 2022 www.irjet.net p-ISSN:2395-0072
pre-processing andsegmentation. Then GLCM features are extracted using that segmented images. All the retinal fundus images are tested against thetrained feature images and detects whether the fundus image is suffering with DR or not. An imagewithDRisfurtherclassifiedintoPDR,MILD,MODERATEandSEVERE.Finally,ourmethodwasshowntobetterhandlethe challengesinretinalvesselsegmentation.
The classification is performed based upon values of microaneurysms area, exudates area marked through GLCM features values. The proposed method achieves 76.67% Accuracy,65.2% Precision, and 71.43% Recall for all the 200 images. ThisaccuracycanbefurtherimprovedbycollectingmorerealtimeimagesorbyenhancingImagedatasetusingaugmentation techniques.
H. M. Pakter, S. C. Fuchs, M. K. Maestri, L. B. Moreira, L. M. Dei Ricardi, V. F. Pamplona, M. M. Oliveira, and F. D. Fuchs, “Computer-
[1] assisted methods to evaluate retinal vascular caliber: What are they measuring?” Investigative Ophthalmol. Visual Sci. , vol.52,no.2,pp 810–815, 2011
[2] R. Priya and P. Aruna, “Diagnosis Of Diabetic Retinopathy Using Machine Learning Techniques” A Review”, Springer Science+BusinessMedia,JMedSyst,6April2013
[3] Muhammad Moazam Fraz, Paolo Remagnino, Andreas Hoppe, Bunyarit Uyyanonvara, Alicja R. Rudnicka, Christopher G. Owen,andSarahA.Barman, “AnEnsembleClassification-BasedApproachAppliedto Retinal BloodVessel Segmentation” IJAIS,Vol.6,FCS,November2012
[4] S.MuthuLakshmiMCA,“SupervisedBloodVesselSegmentationinRetinalImagesUsingFeatureBasedClassification”IEEE Trans.MedImag.,vol.30,no.1,pp.146–158,Jan.2012

[5] P. C. Siddalingaswamy, K. Gopalakrishna Prabhu, “ Automatic detection of multiple oriented blood vessels in retinal images”Proc.BildverarbeitungfrdieMed.,pp.261–265,Mar.2010.
[6] Ana Maria Mendonça, Ana Maria Mendonça, “Segmentation of Retinal Blood Vessels by Combining the Detection of CenterlinesandMorphologicalReconstruction”inProc.CanadianConf.Electr.Comput.Eng.,2007,pp.717–720
[7] Jingdan Zhang Yingjie Cui, Wuhan Jiang, and Le Wang, “Blood Vessel Segmentation of Retinal Images Based on Neural Network“IEEETrans.Med.Imag.,vol.30,no.1,pp.146–158,Jan.2015
[8] Benson S. Y. Lam, Yongsheng Gao, Alan Wee-Chung Liew, “General Retinal Vessel Segmentation Using RegularizationbasedMulti-concavitymodeling“IEEEJ.Biomed.HealthInformat.,no.99,Dec.2010,doi:10.1109/JBHI.2013.2294635.
[9] Razieh Akhavan, Karim Faez, “A Novel Retinal Blood Vessel Segmentation Algorithm using Fuzzy segmentation” IEEE Trans.Med.Imag.,vol.23,no.4,pp.501–509,Apr.2014
[10]Attila Budai, Georg Michelson, Joachim Hornegger, “Multiscale Blood Vessel Segmentation in Retinal Fundus Images” IEEE Trans.Biomed.Eng.,vol.59,no.9,pp.2538–2548,Sep.2010
T.SwapnareceivedM.Techdegreein2010fromSITJNTUHyderabad.SheiscurrentlyasAssistantProfessor inG.NarayanammaInstituteofTechnology&ScienceandHerprimaryresearchinterestisImageProcessing andMachineLearning.
T.Shivani, B.Tech 3rd year, student of G.Narayanamma Institute of Technology & Science and Her primary researchinterestisImageProcessingandMachineLearning.
International Research Journal of Engineering and Technology (IRJET) e-ISSN:2395-0056 Volume: 09 Issue: 11 | Nov 2022 www.irjet.net p-ISSN:2395-0072


P.Srija, B.Tech 3rd year, student of G.Narayanamma Institute of Technology & Science and Her primary researchinterestisImageProcessingandMachineLearning.
D,Akhila, B.Tech 3rd year, student of G.Narayanamma Institute of Technology & Science and Her primary researchinterestisImageProcessingandMachineLearning.
P.Srinidhi,B.Tech 3rd year,studentofG.NarayanammaInstituteofTechnology&ScienceandHerprimary researchinterestisImageProcessingandMachineLearning