International Research Journal of Engineering and Technology (IRJET) e-ISSN:2395-0056

Volume: 09 Issue: 11 | Nov 2022 www.irjet.net p-ISSN:2395-0072
International Research Journal of Engineering and Technology (IRJET) e-ISSN:2395-0056
Volume: 09 Issue: 11 | Nov 2022 www.irjet.net p-ISSN:2395-0072
[1] HOD, Department of Computer Science, G.H. Raisoni Institute of Engineering and Technology, RTMNU, Maharashtra, India 440033.
[2] Student, Department of Computer Science, G.H. Raisoni Institute of Engineering and Technology RTMNU, Maharashtra, India 440033. ***
Abstract Coronavirus disease 2019 is an infectious disease caused by serious acute respiratory syndrome coronavirus 2 ((SARS-CoV-2).. It was first identified in December 2019 in place Wuhan, China, and has resulted in an ongoing pandemic. The virus is primarily spread across people during close contact, most frequently via small droplets produced by coughing, sneezing, and talking. The droplets generally fall to the ground or onto surfaces rather than travelling through air over long distances. Less commonly, people may become infected by touching a dirty surface and then touching their face. It is most contagious in starting of first three days after the onset of symptoms, although spread is even possible before symptoms appear, and from people who do not show symptoms. The project will help in analyzing and recognizing the insights that will be gained by using the Technologies Python and Tableau are used to make all the visualizations which are displayed on the dashboard, these insights will help in identifying and giving an idea of how the number of covid cases are impacted as possibility of being diagnosed positive on the basis of the symptoms.
Keywords- COVID-19, data analysis technique, Prediction,MachineLearning,Classificationtechniques
On 31st December 2019, in the city of Wuhan (CHINA), a group of cases of pneumonia of unknown cause was reported to World Health organization. In January 2020, a previously unknown new virus was identified, which is named 2019 novel corona virus. WHO has declared the COVID-19 as a pandemic. A pandemicisdefinedasdiseasespreadoverawiderange of geographical area and that has affected high proportionofthepopulation.
Every person in the world suffers from the coronavirus, directly or indirectly. Someone is confronted directly, when the virus attacks them and some are indirectly affected because of the closure of theirbusinesses,work,everydaywork.Today,theglobal economy is also slowing down day in and day out. All countries are battling it, be it developing, developed or underdevelopment.Ourgoalistomakepeopleawareso
that they can protect themselves and unite the world to killthisdiseaseanditsexistence.
As this COVID-19 is spread from person to person, Artificial intelligence based electronic devices can play a verypivotalpartinpreventingthespreadofthisvirus.As the part of healthcare epidemiologists has expanded, the pervasivenessofelectronichealthdatahasexpandedtoo. The increasing availability of electronic health data presents a major occasion in healthcare for both discoveries and practical applications to improve healthcare. This data can be used for training machine learning algorithms to improve its decision-making in terms of predicting the diseases. The project will help us in recognizing the insights that will be gained by using machine learning algorithms on the data, these insights will help us in identifying and giving an idea of how the numberofcovidcasesareimpactedaspossibilityofbeing diagnosedpositiveonthebasisofthesymptoms.
Thedifferentresearchspheresofdataanalysisthat have considered COVID-19. While providing an epidemic computational model , GLEaM visualizes the spread of COVID-19 and analyzes realistic scenarios in comparison to data. As the model is developed, it regards transportation and interaction layers based on new emerging pandemic strains. Moreover, by allowing the integration of different processes not necessarily of biologic origin, the GLEaM model takes advantage of an individual’s mobility to create simulations of the epidemic. Amidst large influenza-like illnesses, official health institutions may take weeks to reveal the data, hinderingepidemiologicadvancement.However,informal mediatypicallyholdsavailabledatainreal-timewhichcan allowforthedevelopmentofepidemicforecasts.
Approximate Bayesian Computation (ABC) algorithms can be implemented to predict infectious disease trends when applied in a timely manner [6]. This paper provides training for users with little to no experience in parameter estimation from mathematical data. Three case studies with a focus on infectious diseases are presented to spotlight the many userbased factors that can increase accuracy and processing time.
International Research Journal of Engineering and Technology (IRJET) e-ISSN:2395-0056
Volume: 09 Issue: 11 | Nov 2022 www.irjet.net p-ISSN:2395-0072
Pujari, et al.proposed anapproachthat offers rapidand realistic epidemic predictions useful for health personnel in India. Although, the spread of COVID-19 is well-studied, most models are either computationally expensive, too coarsegrained to be reliable, or too finegrainedto beefficient. The model showninthisstudy is ahybridapproachoftheSusceptible-Infected-Recovered (SIR) model. It includes well-mixed intra-city populations and intercity coupling based on transportation.
This allowed for rapid and accurate COVID-19 predictions in India. It predicted most of India’s urban population to be exposed to thevirus within the first 90 daysoftheepidemicunlessstrictpreventativemeasures were taken that. The study concluded that a small infected population is sufficient for the rapid spread of the pandemic due to its incredibly infectious nature and thepopularuseofdomestictransportnetworks.
The pandemic has already taken grip over peoples’ live. Since the pandemic has started, some countries are facing problem of ever-increasing cases. Through the data analysis of cases one can analyze how countries all over the world are doing in terms of controlling the pandemic. Analyzing data leads to accommodate the preventionmodelofthecountriesthataredoinggreatin terms of lowering the graph. Predictions are made with the dataset which available to the individual/country/associations, therefore helping them to decide how far they are able to control the pandemic or up to how much extent they should guide preventive measures.
Through the project, a step towards helping people to understand the spread and predict the cases in their country has been done. The project also gives an vision ofhowacountryisdoingintermsoflimitingthespread.
We are using Machine Learning to give predictions on the basis of data taken from government website[11], and then we clean the data by using excel cleaning methodsandgivepredictionbyusingthealgorithmwith highestaccuracytopredictCOVID-veor+veonbasison 5majorsymptoms.
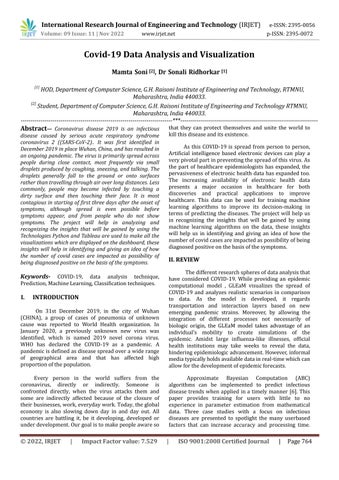
This is the total process of data collection, how the data was collected, and the method that is still using for increasing data collection. The whole process of data collectionthroughgraphsisgoingtobeanidea.
Theprocesscanbeexplaininfollowinggivenpoints:
1. First, Take the dataset, remove redundant data and organisethedataaccordingtoourneeds.
2.Second,LoadthedatasetontheJupyterNotebookand apply data visualization techniques to understand the databetter.
3. Third, then we calculate accuracy for various algorithms and plot a graph on the basis of accuracy of variousalgorithms.
4. Finally, using the accuracy graph we finally use the algorithm with best accuracy in this case (Decision Tree Classifier)topredictthepersoniseither-veor+veonthe basisofsymptoms.
Wearebuildingourowncovidprediction Systemusingjupyternotebook.
Wecandescribetheprocessinfollowingsteps:
Theveryfirststepinourprojectistogetareliableand
authentic dataset for the prediction and analysis. Our search for dataset ended on which is govt website which has provided dataset for free use and is absolutely authentic.
International Research Journal of Engineering and Technology (IRJET) e-ISSN:2395-0056
Volume: 09 Issue: 11 | Nov 2022 www.irjet.net p-ISSN:2395-0072
Then next thing we did was to clean the dataset and remove unwanted columns from dataset for faster computation.
Here,weusethedatasetandchecktheconsistencyofthe dataset by checking the values out of the dataset randomly.
Thenwedodatavisualizationforbetterunderstandingof databytheuseofvariousplots,graphandheatmaps.All thisgraphsandplotsgetsusaninsightintohugedatasets easily.
Inthisstep wecomputeaccuracyofall thealgorithmsby checking the four algorithms mentioned here: Logistic Regression, KNN, Random Forest Classifier, Decision tree Algorithm , we selected these algorithms on the basis of theirqualitiesofregression&classification.
In the last step, all we need to do is plot a graph of accuracyofall thealgorithmsanduse the algorithmwith best accuracy to predict whether a person has corona or not.
We take input of 5 symptoms in binary values and using our predictor we predict the person is positive nor negativeonthebasisofthese5symptoms.
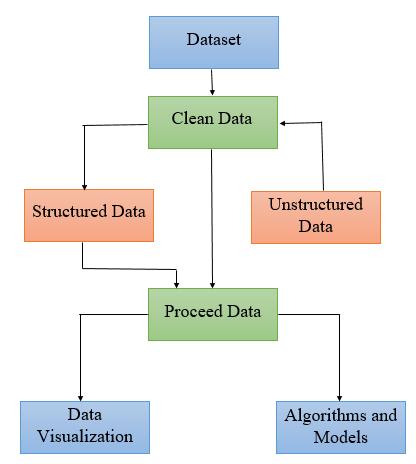
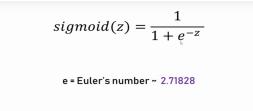
Logistic Regression is a Classification model, which tries to classify the data based on the probability of it occurring .This algorithm is used in multiple places where classification is required, we have used it to classify if the patient is susceptible to be infected by covid or not This is one of the classification methods whichwehaveused. Itused Sigmoidfunctiontoclassify thedata
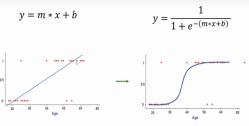
KNN is a supervised machine learning algorithm KNN forms groups based on the criterias and then decides for the incoming data where to put in which category It can be used for regression and for classificationtoo,butmostlyfortheclassificationonlyits used.
Fig[b].RepresentationofKNNAlgorithm
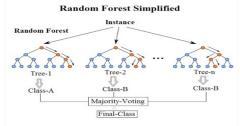
Randomforestisasupervisedlearningalgorithm.
The "forest" it builds is an group of decision trees, usually trained with the “bagging” system. The general idea of the bagging system is that a combination of learning models increases the overall result. Put simply: random forest builds multiple decision trees and combinesthemtogethertogetamoreaccurateandstable prediction. One big advantage of random forest is that it can be used for both classification and regression problems, which form the most of current machine learningsystems
Fig[c].RandomForestClassifier
International Research Journal of Engineering and Technology (IRJET) e-ISSN:2395-0056
Volume: 09 Issue: 11 | Nov 2022 www.irjet.net p-ISSN:2395-0072
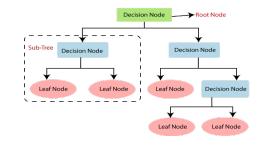
a. Decision Tree is a supervised machine learning algorithm
b.Twonodeswhicharedecisionnodeandleafnodeare theonesmakingthedecision
c.Repeated if clauses are at work when deciding the classificationforthealgorithm
Fig[d].RepresentationofDecisionTree
COVID-19 outbreak motivates to do an EDA on the datasets, scraped from different sources such as “MinistryofHealthandfamilyWelfare”,“COVID-19India website”and “Wikipedia” using “Python” and thus analyzingthespreadandtrend oftheCOVID-19inIndia and done comparison with the neighboring and worst affected countries of the world. The dataset that uses EDAundergoesthemethodofnormalization,choosingof essential columns using filtering, deriving new columns, and visualizing the data in the graphical format. This paper used “Python” for “data processing” and “web scrapping”, “pandas” library to process and extract information from the available dataset. Appropriate graphs created for the better visualization are the resultsof“Matplotlib”and“Seaborn”libraryof Python.
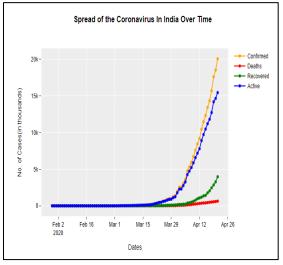
IntheFigure1,theXaxisshowstheDatesonaninterval of 15 Days and Y axis shows the number of cases (in thousands).Orange line shows “Confirmed cases” (positive cases), Red line represents “Deaths” cases which showing the number of cases who had lost their lives, Green line represents “Recovered” cases which depicts the count of people who has recovered and the Blue line represents “Active” cases, the difference of DeathsandRecoveredfromConfirmedcases.
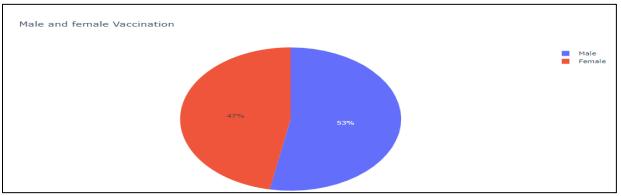
Using matplotlib, we create a histogram using the hist method. We used the histogram to show the details of the campaign vaccination that is currently running in Indiaonamassivescale.
International Research Journal of Engineering and Technology (IRJET) e-ISSN:2395-0056
Volume: 09 Issue: 11 | Nov 2022 www.irjet.net p-ISSN:2395-0072
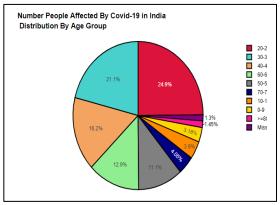
The pie chart analyse the spread of COVID-19 in India to understandwhichagegroupisaffectedmost.
4)
Fig[g].Age-wisespreadofCOVID-19inIndia
Kerala reported the first coronavirus case in India on January 30 when a student who had returned from Wuhan. Till February 3, two more students were tested positive after their return from Wuhan. Till then the spreadoftheCOVID19inIndiahasbeenonrampage
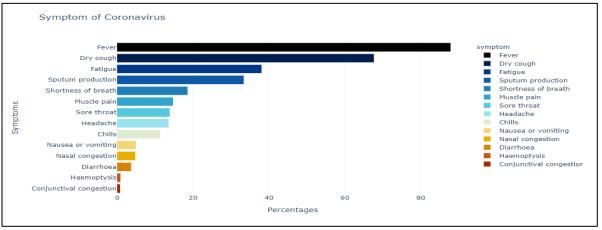
Fig[i]..SymptomsforCOVID-19
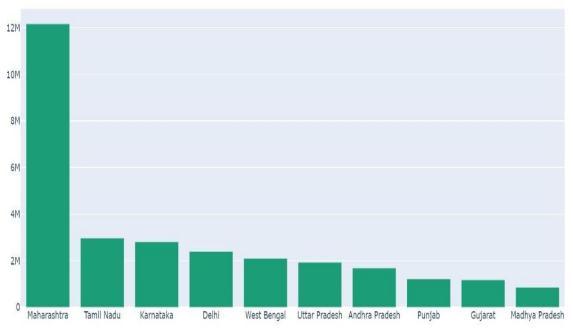
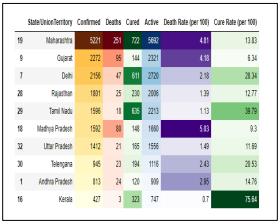
6) Recovery Rate
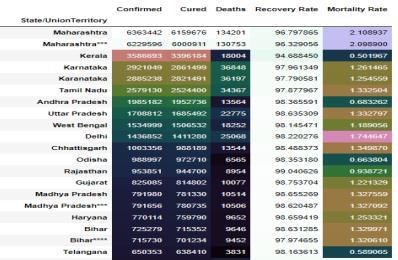
Recovery Rate is calculated by 100* (number of recoveries in a state/number of confirmed cases in a state)
Thenumberobtainafterthiscalculationisthenumberof recovered patients behind every confirmed cases in that state.
Fig[h].Sate-wiseanalysisofCOVID-19inIndia
ThebargraphinFig.5X-axisshowsthepercentagesand Y-axis shows the name of symptoms which has been analyzedfromthepeoplewhohasbeentestedtillnowin India. This is the observation to keep the average symptomschecklistthathasbeencreatedtokeepalead if some new patients comes and can be helpful in classifyingthemaspositiveandnegative
Fig[j].RecoveryRate
7) Male and Female Vaccination Ratio
Fig[k].MaleandFemaleVaccinationRatio
International Research Journal of Engineering and Technology (IRJET) e-ISSN:2395-0056
Volume: 09 Issue: 11 | Nov 2022 www.irjet.net p-ISSN:2395-0072
In this study the main purpose was to analyze the COVID-19 spread in India since the day of outbreak and patternofspreadingofthisvirus.Studyisdoneaboutthe most common symptoms of COVID-19 that are observed till now, age wise spread of COVID -19 to observe which age group is affected most, the spread of the disease in India, the state wise trend of the pandemic to get detail understandingofhowthisisspreading.Thisanalysisisto be fed into machine learning models for forecasting the number of confirmed cases, recovery cases and deaths acrosstheglobebyanalyzingthisCOVID-19datasetusing machinelearning algorithm. This project may be a better model in the future. Or the algorithm that is not giving good predictions, need to work on the algorithm so that the algorithm gives more good predictions. More models can try to create using algorithms. This research work, analysis, and prediction model will help this epidemic situation.
[1] Zhu Junlan, Yang Chengke "Data-analysis-based discussion on COVID-19 Pandemic Shocks to the Economy and Policy Responses ," Management Science Informatization and Economic Innovation DevelopmentConference,Year:2020
[2] Changchang hu, “The Topological Properties of COVID-19 Global Activity Time Series Forecasting,” 5th InternationalConferenceonInformationScience, ComputerTechnologyandTransportation(2020)
[3] Ping Zeng, Kewei Yang,, ” Using Big Data to Monitor the Impact of the COVID-19 Epidemic on Notifiable Diseases Reported in China,” 6th International Conference on Big Data and Information Analytics, Year:2020
[4] Afshar Shamsi, Hamzeh Asgharnezhad, Shirin Shamsi Jokandan, “An Uncertainty-Aware Transfer Learning-Based Framework For Covid-19 Diagnosis,” IEEE Transactions On Neural Networks AndLearningSystems,Vol.32,No.4,April2021
[5] Carson K. Leung, Yubo Chen,” Big Data Visualization and Visual Analytics of COVID-19 Data,” 24th International Conference Information Visualization, (2020)
[6] Huda Khaloofi, Jamil Hussain, Zahra Azhar,“PerformanceEvaluationofMachineLearning Approaches for COVID-19 Forecasting by Infectious Disease Modeling,” International Conference on WomeninDataScienceatTaifUniversity,Year:2021
[7] Yunxiang Liu, Yan Xiao,” Analysis and Prediction of COVID-19 in Xinjiang based on Machine Learning,” 5th InternationalConferenceonInformationScience, ComputerTechnologyandTransportation(2020)
[8] Abir Abdullha, Sheikh Abujar,” COVID-19: Data Analysis and the situation Prediction Using Machine Learning Based on Bangladesh perspective,” 15th International Joint Symposium on Artificial Intelligence and Natural Language Processing , Year:2020
[9] CarsonK.Leung,YuboChen,“MachineLearningand OLAP on Big COVID-19 Data,” IEEE International ConferenceonBigData,Year:2020
[10] Lyn Bartram, Michael Correll, Melanie Tory,” Untidy Data: The Unreasonable Effectiveness of Tables,” IEEE Transactions On Visualization And Computer Graphics,Vol.28,No.1,January2022