International Research Journal of Engineering and Technology (IRJET) e-ISSN:2395-0056

Volume: 09 Issue: 11 | Nov 2022 www.irjet.net p-ISSN:2395-0072
International Research Journal of Engineering and Technology (IRJET) e-ISSN:2395-0056
Volume: 09 Issue: 11 | Nov 2022 www.irjet.net p-ISSN:2395-0072
1234Students (U.G.), Dept. of Civil Engineering, Dr. D. Y. Patil School of Engineering, Lohegaon, Pune, Maharashtra, India 5Professor, Dept. Of Civil Engineering. Dr. D. Y. Patil School of Engineering, Lohegaon, Pune, Maharashtra, India ***
Abstract - The primary goal of the study was to identify patterns of groundwater depletion and recharge in Pune Region before and after the COVID-19 Era using a spatial data perspective. Data on groundwater levels were obtained from the Groundwater Survey and Development Agency in Pune. The elevation information was obtained from the Indian-WRIS website. The effects of geology, soil types, topographic elevation, and land-use changes were critically examined, and it was discovered that these factors control infiltration capacity. Furthermore, the author visited the Groundwater Survey and Development Agency in Pune, Maharashtra, in the study area, to learn about the water levels in the Region. Remote sensing (RS) and Geographic Information Systems (GIS) are two accurate methods for identifying and monitoring observations wells. The expanding population, as well as agricultural and industrial enterprises, demand enormous amounts of water, especially groundwater. The study also created a novel, inexpensive approach for quickly assessing groundwater variations.
Key Words: Groundwater, Industrial Enterprises, COVID19Era,SpatialData,Groundwaterdepletionandrecharge, PuneRegion.
One of the most heavily utilised natural resources in India is groundwater, which has an impact on the entire population. India is the country with the biggest groundwater use in the world, using an estimated 235 km2, according to a World Bank analysis. Drinking, residential, irrigation, and industrial use are the main groundwater-using businesses. Water that occurs below the surface of the Earth and fills all or a portion of the voids left by soil or geologic layers is known as groundwater. To distinguish it from surface water, it is also known as subsurface water. Most economic operations have historically relied on groundwater as a reliable source of supplies, particularly for urban supply and industrial use. Groundwater is becoming a preferred resource option as farmers invest in individual water supply. Understanding and managing groundwater resourcesnecessitatestheintegrationofmassiveamounts of high-quality data from various sources. Through an
integrated approach, the India-WRIS platform collects, stores, and disseminates data on ground water resources. Thisground waterdata isalsousedto deriveinformation intheWaterAuditmodule.[1]
A geographic information system (GIS) is a useful tool for handling spatial data, determining the trend of water-level fluctuation (WLF), and managing water resources. Recently, a number of researchers all over the world have used GIS techniques to assess groundwater level fluctuation and create maps of protection zones. While the world has made great strides in all areas of science and technology, access to enough clean water is stillformanypeopleapipedream.
The Pune Region of Maharashtra, which is predominately an industrial area, is where this study is being conducted. The purpose of this study is to comprehend groundwater level fluctuations and their geographical mapping utilising a geostatistical modelling approach that is GIS-based. The factors that affect groundwater level changes are examined closely, and the effects of those factors on groundwater supply are investigated. This is the first preliminary study of its kind in the study area, and it will be helpful for managing groundwaterinthefuture.
The Pune Region has grown in size as a result of the rapid population expansion brought on by political and economicchanges.Thesizehasgreatlyexpandedrecently, although not in a planned way; both the quantity and depth of wells have increased recently. This has a big effect on the ecosystem and the actual land. Additionally, in order to get water for their industrial products, industrialists must spend more money and utilise a lot of electricity. Planning ahead and keeping a watchful eye on all elements are essential in these situations. GIS and remote sensing methods can offer helpful data and a detailedexaminationofthestudy.Thestudyalsocreateda novel, inexpensive approach for quickly assessing groundwatervariations.
International Research Journal of Engineering and Technology (IRJET) e-ISSN:2395-0056
Volume: 09 Issue: 11 | Nov 2022 www.irjet.net p-ISSN:2395-0072
To offer suggestions for future studies and groundwaterprospectionguidelines.
To recognise and define groundwater potential zones by combining different themed maps using GIStechniques.
certain Save Catchments appear to have followed a predictable trend between 2008 and 2010. Compared to low lying and level terrain, catchments with higher and steeperslopeslosewatermorequicklytothenorthofthe country. The findings demonstrate a decline in the study area's average monthly and seasonal groundwater levels, with more seasons and months recording below-average levels.[3]
To evaluate groundwater regulating features using a combination of field research, remote sensing,andDEM(DigitalElevationModel).
ApplicationofRemoteSensing.
To create a system for monitoring the quality of groundwater.
The quantity of the resource and the degree of groundwater variability are key factors in effective groundwater resource management. Both manmade actions,suchasexcessivepumping,andnaturalprocesses, particularly through a decline in recharge, are linked to fluctuations in groundwater levels. Only looking at shortterm water-level records makes it impossible to pinpoint thereasonsofchanges.Therefore,inordertocomprehend the reasons behind the groundwater level oscillations in Pune's industrial zone, a complete analysis of the longterm groundwater level data in the Pune region was conducted.
Hydrogeological and GIS mapping techniques are used to examinegroundwaterlevelvariationsduringthepre-and post-monsoon in their research area. According to the study,ahandytoolforidentifyingprospectivezoneswasa geographical map of water table fluctuation. Additionally, thisstudydetailshowthegroundwatertablehaschanged in the study area both before and after the monsoon seasons. The largest variation in water table was 2 m below ground level because excessive pumping and consequent sea water intrusion in the southern coastal region pose major concerns to groundwater quality. However, 50% of the research area is still at risk of overexploitation.[2]
Thestudy'sfindingscanthereforebeextrapolatedtoshow that groundwater levels are generally declining throughoutthestudyregioncatchments,asdemonstrated bythenegativetrendlineequation.Theprimaryobjective of the study was to generate seasonal and yearly groundwater fluctuations in catchments surrounding the study region from a remote sensing perspective in order to discover patterns of groundwater depletion and recharge. Groundwater shortages in the study area and
In order to build point maps in the ILWIS GIS, the groundwaterlevelsduringthepre-monsoonmonthofMay for the years 1995, 2000, 2005, and 2010 were observed at 109 wells located in the study area watershed. Overall, the findings indicate that the district has been struggling with a falling groundwater table since around the year 2000. In the current study, the interpolation of groundwater levels from the study area to the droughtaffected area was done using the Kriging approach. The study will be helpful for developing groundwater in the study area and for suggesting alternative cropping patterns for the development of sustainable water resources. The watershed's current characteristics are favourable for a dropping water table, and the groundwater contours follow the topography naturally. [4]
The assessment of groundwater-level risk, WLF, seasonal trend variation, and result validation all benefited greatly fromtheuseofGIS-basedmaps.TheWLFmaprevealsthat low WLF predominately covered the area, followed by mediumWLF.LowerWLFwasfoundintheeasternpartof the research area. However, the research area's western and northwestern parts showed higher WLF. 26 observation wells in the study region were monitored for groundwater levels in the current study throughout the dryseason(June2013)andwetseason(November2013) todeterminehow muchthe water level fluctuated (WLF). Finally, this study recommends that, in accordance with the regional climatic circumstances, a groundwater qualitative and quantitative monitoring programme be carriedoutatintervalsofeverysixmonthsorfewer.[5]
TheNear-Infrared(NIR)andRed(R)bandswerealsoused to compute the NDVI pictures for this investigation, in addition to the Thermal IR bands (Bands 4 and 5, respectively). For non-vegetated surfaces, the usual range of the NDVI measured from vegetation and other earth surface materials is between roughly 0.1 (NIR less than Red)andashighas0.9forextensivevegetativecover.The study uses three different kinds of satellite images, including the 30-meter-resolution Landsat-8 OLI from 2013 to 2021, to determine the Normalized Different Vegetation Index (NDVI) in the study area. Finding out why groundwater levels are dropping in the study area requires a remote sensing approach. With the help of the remote sensing technique, the study was able to identify
International Research Journal of Engineering and Technology (IRJET) e-ISSN:2395-0056
Volume: 09 Issue: 11 | Nov 2022 www.irjet.net p-ISSN:2395-0072
thefactorsthatledtogroundwaterlevelsinthestudyarea decliningbetween2001and2021aswellastheeffectsof irrigation systems on groundwater levels as a result of changes in the classes of urban land use and land cover. [6]
The second largest city in the state of Maharashtra aft the capital Mumbai, Pune is the ninth most populous city inall ofIndia.Thedistrict's coveredarea is16642square kilometres. It is situated on the east bank of the Mutha RiverinthewestoftheState.Theprimarysourceofwater for Pune and its s cityof Puneis nowhometo numerous IT and automotive businesses, a sizable industrial area, and well educational institutions. In Pune, too many individuals move around for a variety of reasons. As a result, t needs all facilities, including water, to accommodate its population. demand,soitisnecessarytorechargeasurfacebelowthe groundbyincreasingsubsurfacestoragecapacity.
3.1
In information systems may offer relatively less expensive methods of learning about regional groundwater variations. Due to the difficulty and expense of setting up andmaintainingfieldwork techniques, remote sensing and geographic information system data play a significant role in the Pune region. Whenaccessible,pointdatacanbecombinedwithremote sensingandgeographicinformationsystemdata todetect changesingroundwaterr
3.2

Over the past three decades, Pune's environment has transformed, especially with the rapid growth of the industrial belts. Pune experiences hot, semi with a tropical wet and dry climate, with typical temperatures between 19 and 33 °C (66 and 91 °F). Summer, monsoon, and winter are the three seasons that Pune encounters. The typical summer months are from MarchtoJune, frequentlylastinguntil June15, withhighs occasionallyreaching42°C(108°F).P hottestweatherbetweenthe20thofAprilandthe20thof May,eventhoughsummerdoesn'tofficiallyenduntilMay. (Andhumidity remainshigh).Due toPune'shighaltitude, the nights are typically cold even during the hottest months.
°C (109.9 °F). The monsoon season lasts from June to October,whentemperaturesrangefrom22to28°C(72to 82°F)andthereismoderaterainfall.Thewettestmonthof the year is July, which receives the maj annual rainfall of 722 mm (28.43 in), which falls between
June and September. In this area, hailstorms are not unheard of. November is the traditional start of winter; this month is known as the Rosy Cold and is frequently associated with the Diwali festival. In December and January,thenight-timelows
areoften5 to6 °C(41to43°F),while the dailyhighs are
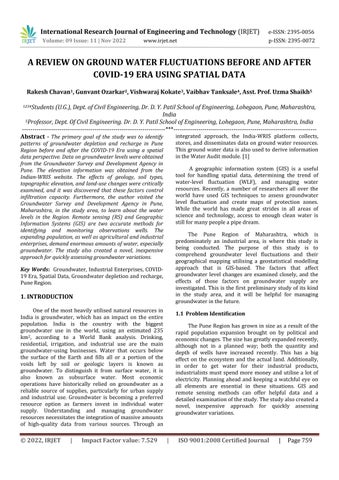
Fig -1: Studyareamapshowingthelocationoftheobservationwells[7]
International Research Journal of Engineering and Technology (IRJET) e-ISSN:2395-0056
Volume: 09 Issue: 11 | Nov 2022 www.irjet.net p-ISSN:2395-0072
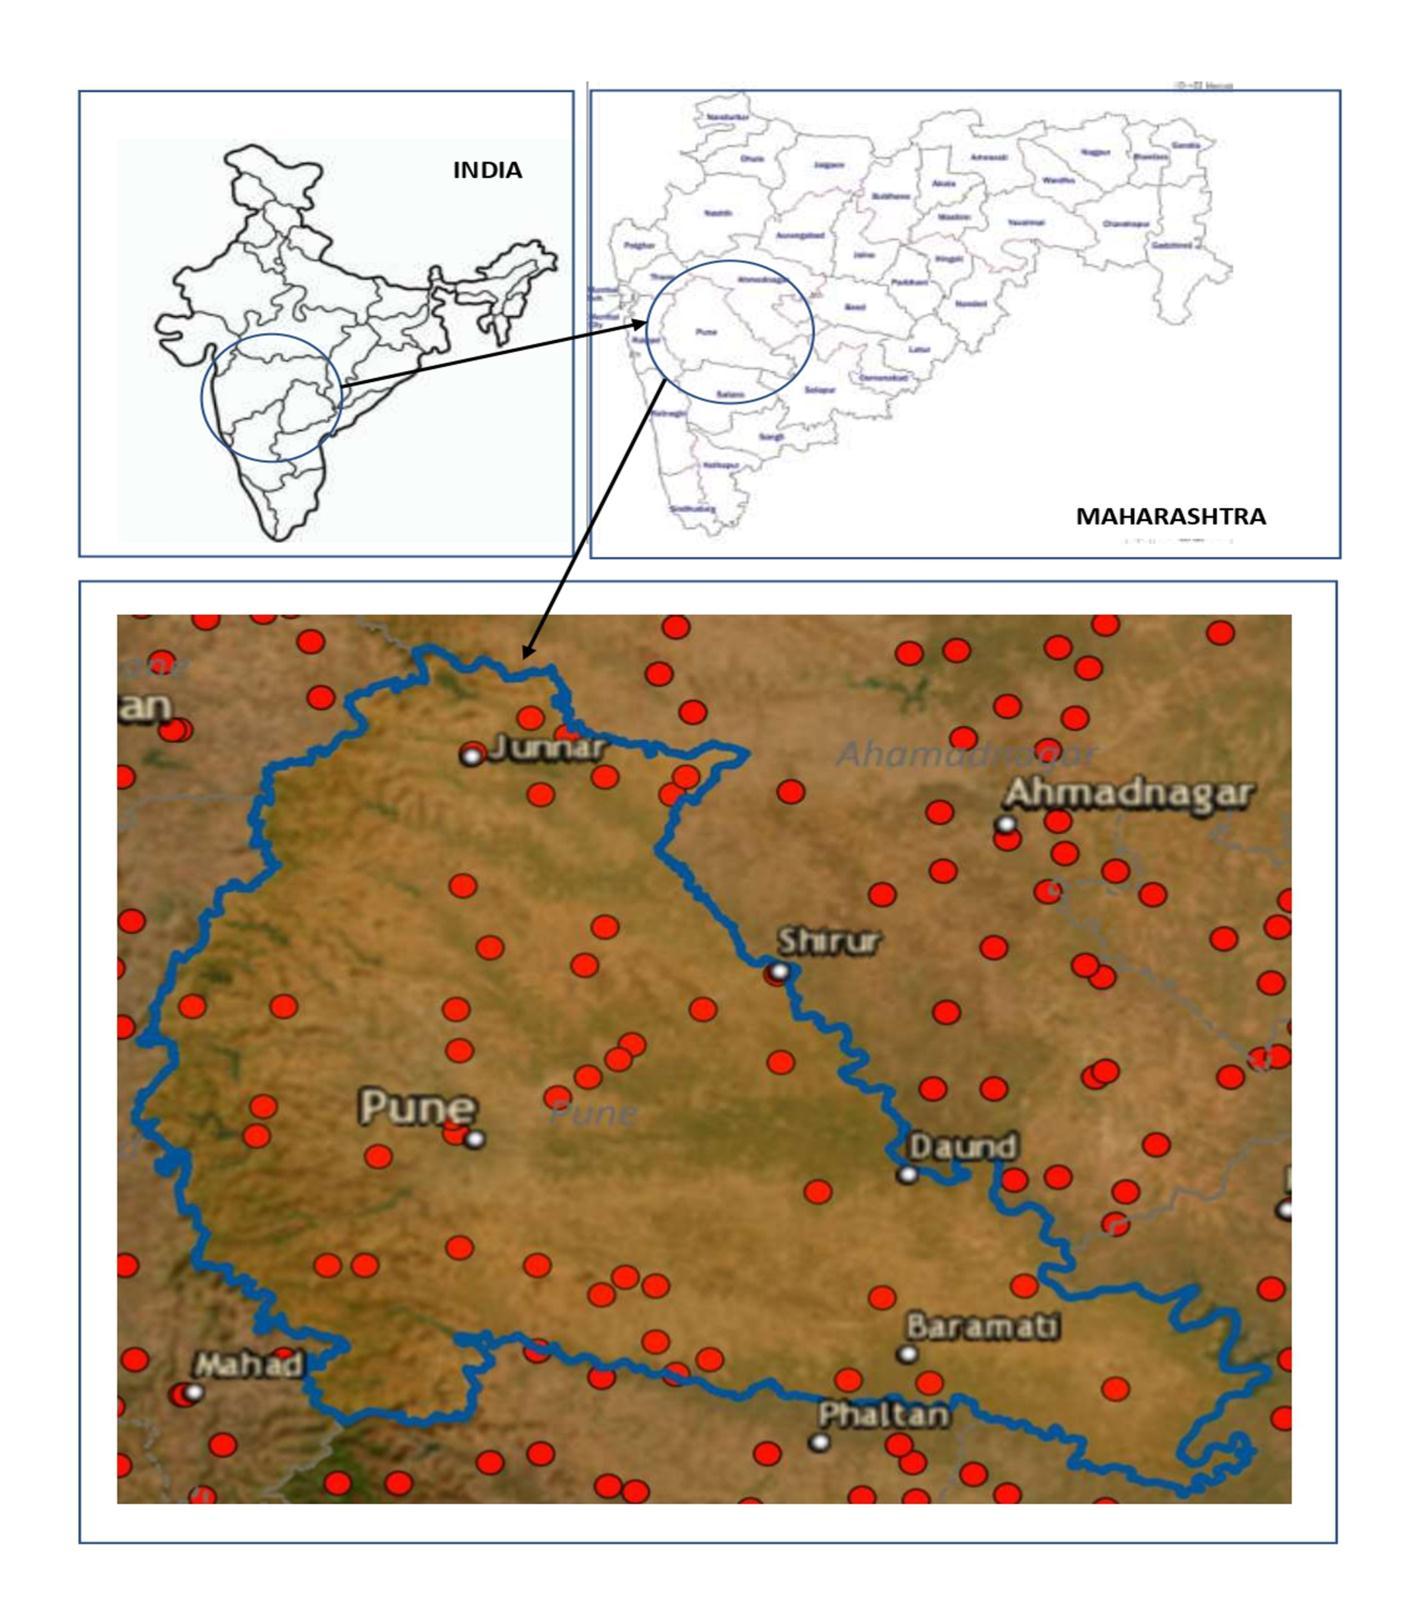
A flow chart is produced as the overarching research methodology for this project (see Fig. 2). Estimating different groundwater body inputs, outputs, and storage changes are necessary for the evaluation of groundwater resources. Rainfall infiltration, seepage from waterways like canals and tanks, and return flow from surface and groundwater irrigation are some of the different inputs (sources of recharge). Groundwater draught (drawing through groundwater structures) and aquifer outflow are themajoroutputfactors.Thetotalreplenishableresource for an area doesn't vary, but the draught typically increases over time, lowering the amount of groundwater thatisaccessibleforusageinthefuture.Thegroundwater levels represent the storage change those results from this.
elevation considerably more quickly than before when rechargeoccursinanunconfinedandshallowaquifer.For instance, as water is added to a can, the water level will increase. The amount of groundwater will rise by much morethan 2 mmasa result of,say,2 mm of precipitation migratingundergroundtothewatertable.
The study's findings lead to the conclusion that groundwater levels are rising in most areas of the Pune region. Using spatial approaches, the groundwater level changes prior to and following COVID-19 in the Pune regionareinvestigated.Geology,soil,height,andland-use pattern are the main variables affecting the water level. Duetoexcessivepumping,thequalityofthegroundwater is seriously threatened. According to this study, quarterly quantitative monitoring is necessary for effective groundwatermanagement.
I would like to thank GOD for his help and support. Without His help, it would have been impossible to succeed in this project. I want to express my deep gratitude to my project guide, Prof. Uzma Shaikh for her patience guidance, encouragement, and helpful criticism on this research work. Many thanks to Mr. Pradeep Kadam, Senior Geologist at GSDA Department, Pune, Maharashtra and Dr. J. Davithuraj, Officer In-charge at CGWB, Pune, Maharashtra for advice and support throughoutthepaperpreparation
[1] https://nwic.gov.in/
[2] P. J. Sajil Kumar, “GIS-based mapping of water-level fluctuations (WLF) and its impact on groundwater in an Agrarian District in Tamil Nadu, India,” Environment, Development and Sustainability (2022) 24:994–1009 https://doi.org/10.1007/s10668-02101479-w
[3] David Chikodzi, “Analysis of Monthly and Seasonal Groundwater Fluctuations in Zimbabwe: A Remote Sensing Perspective,” Chikodzi, Hydrol Current Res 2012,S1DOI:10.4172/2157-7587.S1-003

The Pune Region's points of observation wells are depictedinFigure1.Themajorityoftheregion'swellsare shallow,unconfinedwells,whichmayhelptoexplainwhy Pune responded to precipitation unusually quickly during the COVID-19 ERA. The water table rises to a higher
[4] T.R. Nayaka, S.K. Gupta and R. Galkate, “GIS Based Mapping of Groundwater Fluctuations in Bina Basin,” AquaticProcedia4(2015)1469–1476
[5] Ashwani Kumar Tiwari, Nicole Nota, Federico MarchionattiandMarinaDeMaio,“Groundwater-level risk assessment by using statistical and geographic information system (GIS) techniques: a case study in
International Research Journal of Engineering and Technology (IRJET) e-ISSN:2395-0056
the Aosta Valley region, Italy,” https://doi.org/10.1080/19475705.2017.1337655
[6] Twana A. Hamad, Mehmet Ali ÇULLU , Ali Volkan BİLGİLİ,ErhanAkça,“Temporalandspatialvariation of Groundwater level in Barnaty plain districts using GISandRSdata -CaseStudy:inErbilCity,Iraq,”2022 August; 16(8): pages 22-34 DOI: 10.22587/ajbas.2022.16.8.3
[7] https://indiawris.gov.in/wris/#/
Volume: 09 Issue: 11 | Nov 2022 www.irjet.net p-ISSN:2395-0072 © 2022, IRJET | Impact Factor value: 7.529 | ISO 9001:2008 Certified Journal | Page763