International Research Journal of Engineering and Technology (IRJET) e-ISSN:2395-0056

Volume: 09 Issue: 11 | Nov 2022 www.irjet.net p-ISSN:2395-0072
International Research Journal of Engineering and Technology (IRJET) e-ISSN:2395-0056
Volume: 09 Issue: 11 | Nov 2022 www.irjet.net p-ISSN:2395-0072
1Mtech Student, Dept. of Civil Engineering (Structural Engineering) VEC Ambikapur,C.G. India 2 PhD Scholar VEC Ambikapur,C.G. India 3 Assistant Professor and PhD Scholar VEC Ambikapur,C.G. India ***
Abstract - Behavior of multi-storey framed buildings throughout strong earthquake motion depends on the stiffness, strength and mass distribution in horizontal as well as vertical planes of the buildings. Damage occurring due to earthquake ground motion mainly starts at locations where structural weakness is present in the frames of multi-storey buildings. This weakness further increases and concentrates on the damage of structures by plasticization resulting in completecollapse of building. In many cases weakness occurs due to discontinuities in stiffness, mass or strength between two successive storey’s The storey discontinuities are often due to immediate variations in the geometry of framesalong with height. In past earthquakes, there are many examples of building failure due to such type of discontinuity in vertical direction. Irregularity in configuration either in elevation or plan was sometimes recognized as one of the main causes building failure during earthquakes. A common type of vertical irregularity (geometrical) in building develops due to sudden reductionin the lateral dimension at specific levels of the building. This type of building is known as setback building. Many investigations has been performed to understand the behavior of setback buildings and to visualize method for further improvement in performance
Key Words: SeismicAnalysis,Baseshear,Pushover,Static nonlinearIn multi-storey building frames, damages from earthquake ground motion generally starts at locations of structural weaknessinthelateralloadresistingframes.Thesebehaviors ofmulti-storeyframedbuildingsduringstrongearthquakes dependuponthedistributionofstiffness,massandstrength in both vertical and horizontal planes of building. In some casestheseweaknessmaybecreatedduetodiscontinuitiesin mass, strength or stiffness of subsequent storey’s. Such discontinuities between storey’s are often associated with variationsinthegeometryofframealongtheheight.There are also lots of examples of building failures due to such discontinuities from various previous earthquake data. Structural engineers have developed confidence in the designofbuildingshavingdistributionstiffness;strengthand massaremoreorlessuniform.Butlessconfidenceisshownin designofstructureshavingirregulargeometry.
Acommontypeofvertical irregularityingeometryexistsin thepresenceofsetbacks,i.e.duetosuddenreductionofthe dimension of building laterally at specific levels. These buildings are known as setback building. These types of building form gains increasing popularity in multi- storey building,constructionnow-a-daysbecauseofitsfunctionalas well as aesthetic architecture. This type of setback firm providesadequatedaylightandventilationforlowerstorey’s inanurbanlocalitywitha numberoftall buildingsnearby. Thisformofbuildingalsocomplieswiththenormsrelatedto floor area ratio practiced in India. Change in stiffness and massalongtheheightrenderdynamiccharacteristicsdiffer fromregular buildings. It has been mentioned in literature (Athanassiadou, 2008) that higher mode participation is significantinthesebuildings.Theinterstoreydriftsinsetback buildingsareexpectedtobelessinlowerfloorsandmorein upper floors as compared to building with regular configurations.
Many investigations have been done to understand the structuralbehaviorofregularaswellassetbackbuildingsand to find method for further improvement of performance. BecauseofthelimitationsoutlinedinFEMA356(2000)about theconventionalnon-linear static(pushover)analysis,itmay not be possible to evaluate the performance (seismic) of building with setback accurately. In many reports, it is mentioned to extend pushover analysis to includedifferent categoriesofirregularbuildings.However,nothinghasbeen addressesinthisregardtosetbackbuildings.
The primary objective of the present study is to study the performance of setback building using conventional pushover analysis method and to suggest necessary improvementsinthisregard.
Nodesigncodeshavegivenparticularattentiontothesetback buildings. Research on setback buildings shows that displacement demand depends upon geometrical configurationandconcentratedonnearestvicinityofsetback insetbackbuildings.Italsomentionssignificantcontribution ofhighermodestotheresponsequantitiesofthestructure.
AsperdescriptionbyPresentedandCommentarySeismic Rehabilitation of Buildings (FEMA 356:2000); American Society of Civil Engineers, the non- linear static analysis
International Research Journal of Engineering and Technology (IRJET) e-ISSN:2395-0056
Volume: 09 Issue: 11 | Nov 2022 www.irjet.net p-ISSN:2395-0072
(pushoveranalysis) is to estimate the seismic demand and capacity of the existing structure. Lateral loadis increased monotonicallythroughthebuildingheightinthisprocedure. Thebuildingissettodisplaceuptothetargetdisplacementor untilthebuildingcollapses.Agraphicalrepresentationofbase shearvs.roofdisplacementisobtained.Thiscurveisknown ascapacitycurveorpushovercurve.Thebuildingcapacityfor an assumed displacement pattern and load distribution is definedbycapacitycurve.Also,specific stateofdamage is defined byapointoncurve.
Maximumdisplacementofthebuildingduetoearthquake isfoundbycorrelatingthecapacitycurvetoseismicdemand generated by a certain earthquake ground motion. This is calledperformancepointortargetdisplacement.Locationof performance point relative to performance levels defines whetherperformanceobjectiveismetornot.AsperFEMA 356, it is basically meant for buildings with regular configuration having fundamental modes participation dominant. There are also a number of approaches for pushover analysis mentionedin the literature to make it applicabletoregularbuildingsofdifferentcategories.These comprise (i) modal pushover analysis (ii) modified modal pushover analysis(iii)upperboundpushoveranalysisand (iv) adoptivepushoveranalysisetc.However,noresearchhas beendoneonthismethod’sapplicabilitytosetbackbuildings.
Theobjectivesforthestudyarementionedbelow: Application of pushover method is available for their applicabilitytobuildingswithsetbackofdifferent planand elevationirregularity.Theprincipleobjectiveoftheproposed studyistoapplytheconventional method(FEMA-356)with conceptualsimplicity,butprovidemoreaccuracyinseismic demandestimationofsetbackbuildings.
Thepresentstudyislimitedtomulti-storeybuildingframesof reinforcedcementconcretewithpossiblesetbacks.Setback building models of 20 storey’s with irregular plan of equal setback area are taken in consideration. Three buildings havingsetbacks inalldirectionsaretaken.Planasymmetry arising due to geometrical irregularity vertically requires three-dimensionalanalysisforconsiderationofeffectsdueto torsions.Torsioneffecthasnotbeenconsideredinthepresent study. Storey numbers of 20 storey’s with different bay numbersandirregularityareconsidered.Withuniformbay width4mand heightofeachstoreyisrestrictedto3m.For inclusion of effect due to progressive yielding in structure adoptive load pattern should be considered. To keep the procedure simple computational fixed load distribution shapesareplanned.Effectsofsoilstructureinteractionsare notconsideredinthisstudy
Thestudyinthisreportisbasedonnon-linearanalysis ofstructuralmodelsrepresentingverticallyirregularmultistoreybuildingswithsetback.Firstpartpresentssummary ofvariousparametersofthecomputationalmodel,thebasic assumptions and geometries of the buildings were consideredforstudy.Itisimportanttomodelthenon-linear
properties accurately in non- linear analysis. Frame elementsweremodeledwithinelasticflexuralhingeswith pointplasticitymodel.Secondpartexplainstheproperties of hinges, the assumptions are made and procedure for generationofproperties.
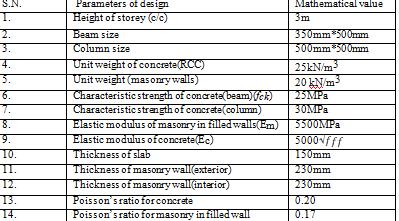
The buildings are assumed which are regular in plan are selected with respect to variation in number of bays, number of storeys and basically three types of configurations with equal setbacks in upper floors. Description of building frames are given in tabular form withbasicassumptionsasfollows:
• Heightofeachstorey:3m
• Length of each bay (centre to centre in bothdirection):4m
• Buildingconfiguration:
SquareBuildingisselectedduetosamedimensioninboth directionsandtostudytheimpactofanearthquake. Rectangularbuildingisselectedtostudythecomparative effect with respect to square buildingdue to change in dimension. L- Type building is selected to study the effectsofearthquakeforcesonaunsymmetricalbuilding
Table3.1Typeofbuildingconfigurationwith setback
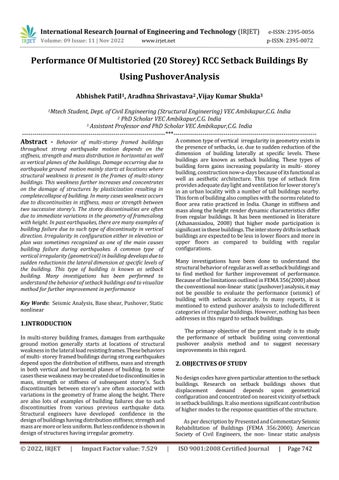
R.C.CbuildingwhichisconsideredasSpecialMoment ResistingFrame(SMRF)becauseitsdetailingconformsto IS: 13920.Various other details related to building framesandmaterialusedissummarizedintabularf or min table3.2:
International Research Journal of Engineering and Technology (IRJET) e-ISSN:2395-0056
Volume: 09 Issue: 11 | Nov 2022 www.irjet.net p-ISSN:2395-0072
Table.3.3Seismiczoneproperties SL.NO Parameter Value
GravityLoadConsideredForDesign: Deadload(IS875:part-1)
i. Deadloadofbeams andcolumns:Asper unit weightofmaterialanddimensions.
ii. Deadloadonfloor/roofslabs(flooringload): 12kN/m2
iii. Deadloadonperipherybeams(Exteriorwall load,230mmthick):11.5kN/m
iv. Deadloadoninteriorbeams(Interiorwall load,230mmthick):11.5kN/m Liveload(IS875:part-2)
iLive load on floor/roof slab :3 kN/m2 (Residential Building)
Asper IS1893:2016,clause7.3.1,thepercentageoflive load considered for seismic loadcalculationis25%iflive loadis lessthan3kN/m2
3.2
Beams and columns are modeled as 2D frame elements. Column baseswereconsidered fixedforallmodelsinthe study.Theentireframeelementsaremodeledwithnonlinearproperties. Diaphragm isassignedateach floorlevelforthestructural effectofin-planestiffnessofslab.
3.2.1
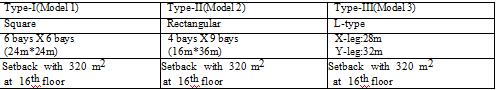
The study is based on setback buildings with 3m storey heights and 4m bay width. Three types of building geometry were taken in this study. The geometrics of buildingrepresentsequalamountofsetbackareainallthe threemodelsabove15th floorlevels Baysvaryingfrom6 to 9inXaswellasYdirectionwithuniformbaywidthof 4m have been considered. Different building plans with setback at different height have been shown in figures mentionedbelow:
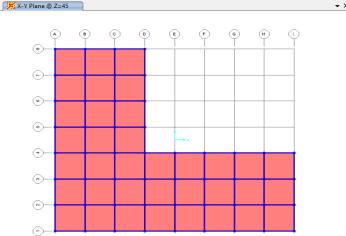
Fig3.1(a)model1(squaretype)upto45mheight.
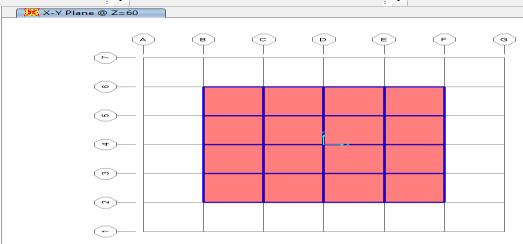
Fig3.1(b)model1(squaretype)beyond45mheight.
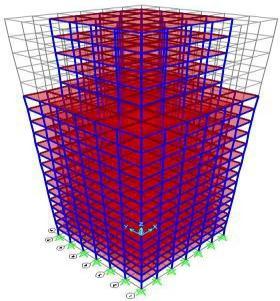
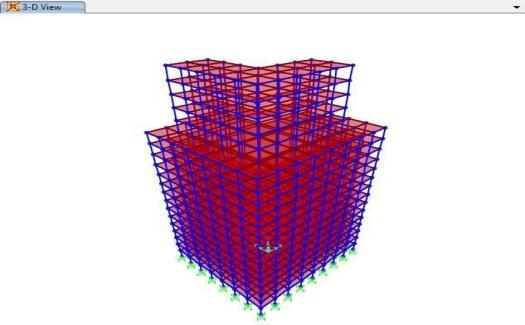
Fig3.23-Dviewofmodel1(squaretype)
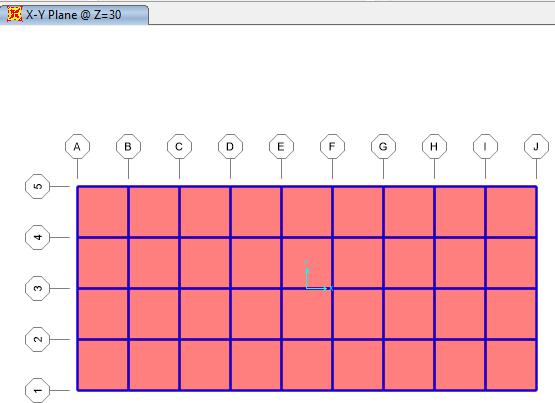
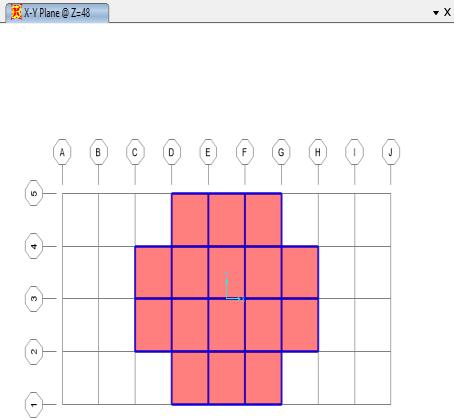
Fig3.3(a)model2(rectangulartype)upto45mheight
Fig3.3(b) model2(rectangulartype)beyond45mheight
International Research Journal of Engineering and Technology (IRJET) e-ISSN:2395-0056
Volume: 09 Issue: 11 | Nov 2022 www.irjet.net p-ISSN:2395-0072
-
Fig3.43-Dviewofmodel2(rectangulartype)
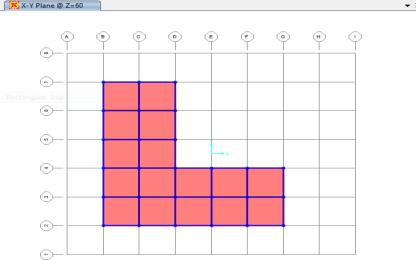
Fig3.5(b) model3(L-type)beyond45mheight
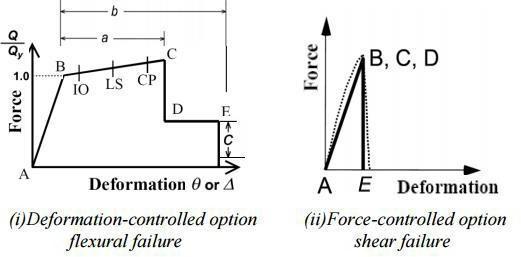
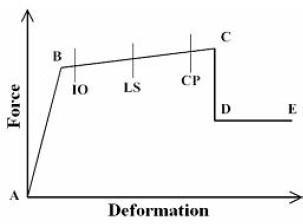
Fig3.8Forcevs.deformationbehaviorofhinges
Pushover analysis is a non-linear static procedure in which structural load is increased incrementally with predefined pattern. ATC-40 and FEMA-356 documents describetheparameters. During analysis the yielding of frame members is also been described in FEMA-356. During analysis, the inelastic behavior of structural elements two methods was governed asshown in fig. 3.8. Firstoneisdeformationcontrolledandsecondoneisforce controlled.
Performancelevelofcolumnsandbeams:-Whenastructureis analyzedwiththreeloadingconditions(gravity,earthquakexandearthquake-y),pushovercurveisobtained.Thisisalso baseshearvs.deformationcurve Followingkeypointshavebeendrawnfromtheabovecurve:
• Point‘A’istheorigin.
• Point‘B’istheyieldingpoint.Uptothispointno deformationtakesplaceinthehinge.Beyond point‘B’onlyplasticdeformationinhinge occurs.
• ‘C’pointrepresentsultimatecapacityin pushoveranalysis.
• Residualstrengthisrepresentedbypoint‘D’in thecurve.
• ‘E’isthepointoftotalfailure.
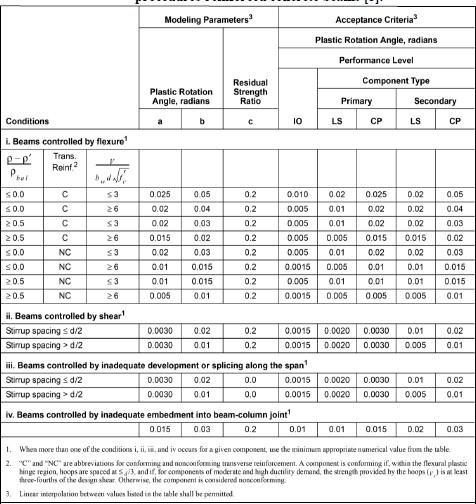
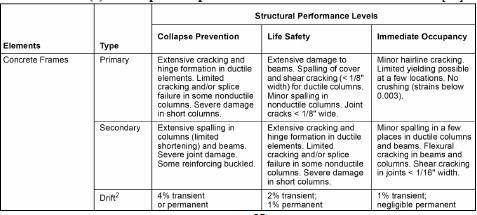
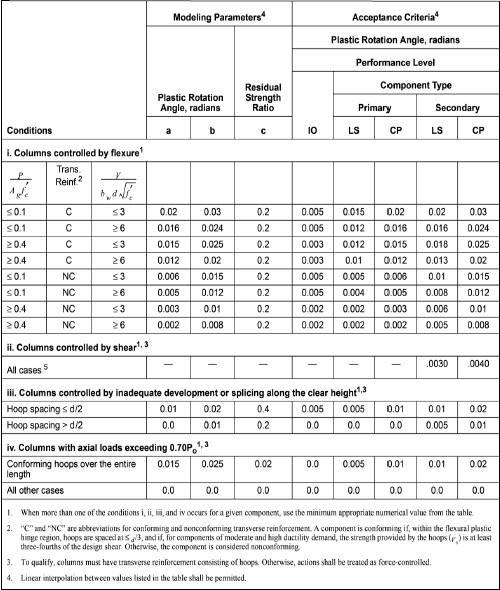
PointsIO,LSandCPareusedtodescribethecriteriafor acceptanceleveloftheplastichingeformednearthejoints (at ends of columns and beams), where IO- immediate occupancy, LS- life safety, CP- collapse prevention. The assigned value of each point depends up on the typeof memberanddefinedparameterinATC-40andFEMA-273 documents. Acceptance criteria values for columns and beams are mention in table 3.4 and table 3.5. Levels of structuralperformancearedescribedintable3.6
Fig3.7Forcevs.deformationcurve
International Research Journal of Engineering and Technology (IRJET) e-ISSN:2395-0056
Volume: 09 Issue: 11 | Nov 2022 www.irjet.net p-ISSN:2395-0072
Itisessentialtomodelloaddeformationcurveofallelements inpushoveranalysis.Thecolumnsandbeamsaremodeledas frame elements. Diaphragm action is assigned to slabsin modeling.Itisessentialtomodeltheloadversusdeformation curve, as deformationslikely go beyond elastic range. Itis necessarytoincorporatethenon-linearbehaviortotheload versus deformation property of hinge connected to the member.Amomentversusrotationshingeisassignedtoa beam.Tomodeltheexpectedshearfailureofasection,shear forceversussheardeformationcurveis plotted.Columnis assignedwithshearandflexiblehinges.
3.5
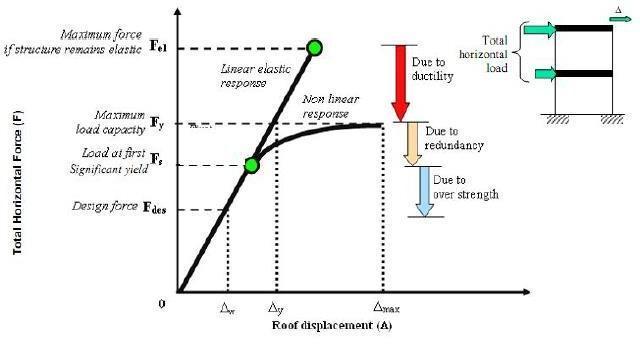
Inforcebasedseismicdesignprocedure,Risthefactorfor forcereductionusedtoreducethelinearelasticresponse spectra to inelastic response spectra. For structures to remainlinearly static,it isdesigned forseismic force less thantheexpectedunderstronggroundmotion, R=Ve/Vd
R=responsereductionfactor(empirical)whichcountsover strength,dampingandductilityinthestructuralsystemat greaterdisplacementsafterinitialyieldandapproachableto displacementatultimateloadinstructure.
International Research Journal of Engineering and Technology (IRJET) e-ISSN:2395-0056
Volume: 09 Issue: 11 | Nov 2022 www.irjet.net p-ISSN:2395-0072
Response reduction factor formulation:
ATC-19 describes R which consists of three factors R=RS.R RR
WhereRSrepresentsoverstrength,whichistheratioof maximumbaseshearatyield(Vy)todesignbaseshear(Vd) R representsductilityfactor,whichistheratioofbaseshear atelastic response(Ve)tobaseshear yield (Vy) ,RR isthe factor of redundancy and depends upon the number of verticalframesparticipationinseismicresistance.
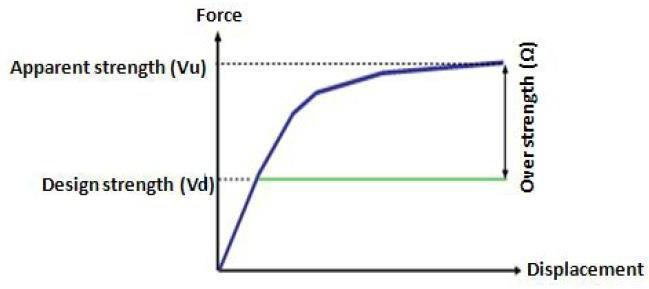
Over strength factor:-Afterthestructurereachesif ultimatestrengthanddeformationcapacity,thestrength beyonddesignedstrengthisknownasoverstrength.
Over strength factor ( )= Apparent strength/design strength=Vu/Vd
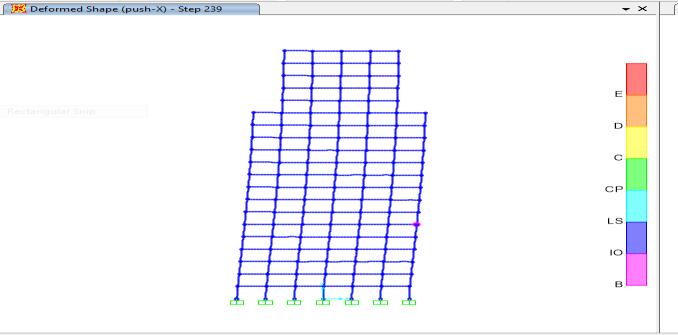
Fig.4.2(a)Hingeformationmodel1(squaretype)atstep239
Fig.4.2 (b) Hinge formation model 1 at step-240
Fig 3.10 Force vs. displacement curve for over strength
Non –linear static analysis (pushover analysis) has been done to all the three type of buildings (square, rectangularandL-type)withequalsetbackprovidedineach model.
Theanalysisisperformedinsap2000(version19).
( b ) ( a )
Fig.4.1
curveofmodel1
( b )
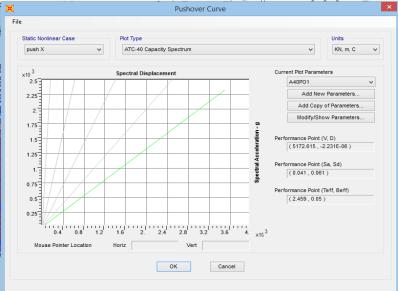
Fig.4.3 Pushover curve (X- direction) of setback model 2
Discussionsdrawnfromtheabovetableandthe figuresof hingeformationofsetbackbuilding
model-1(squaretype): Fromtheabovepushovercurve(fig4.1)thefollowingkey pointsare:
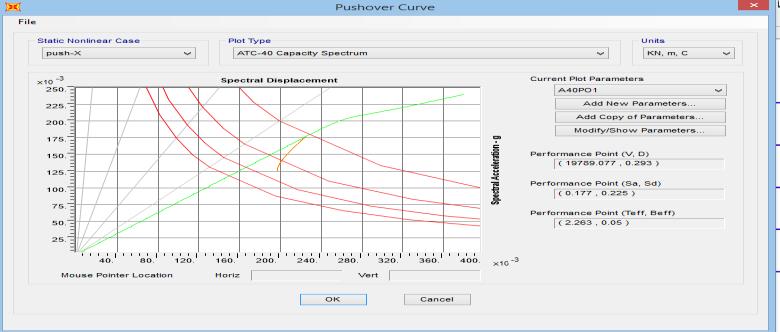
1. Curve ‘a’ indicates demand spectrum and curve ‘b’ indicates capacity spectrum,where‘a’and‘b’intersectsis knownasperformancepoint.
2. It is observed that base shear at performance point is 19789.077kNwithcorrespondingdisplacement0.293m.
3. Plastic hinge formation in this model starts fromstep239.Performancepointsremainbetweenstep-244andstep245 of pushover in x-direction. Plastic hinges formed at step-244are12innumber.
4.Sincewehavedesignedthestructureforlinearanalysis andchecktheperformancelevelofthestructure,itisfound that around 0.26% plastic hinges formed at performance pointarewithinimmediateoccupancylevel.
2022, IRJET | Impact Factor value: 7.529 | ISO 9001:2008 Certified Journal | Page747
International Research Journal of Engineering and Technology (IRJET) e-ISSN:2395-0056
Volume: 09 Issue: 11 | Nov 2022 www.irjet.net p-ISSN:2395-0072
Discussion drawn from the hinge formation during pushover in both x and y direction ofsetback building model-2(rectangulartype)summarizedas: From the above pushover curve (fig 4.3 and fig 4.5) the followingkeypointsare:
i) Curve ‘a’ indicates demand spectrum and curve ‘b’ indicates capacity spectrum,where ‘a’ and ‘b’ intersects is knownasperformancepoint.
ii) Base shear in x-direction at performance point is 5172.615kNwithrespecttodisplacement-2.231E-06.
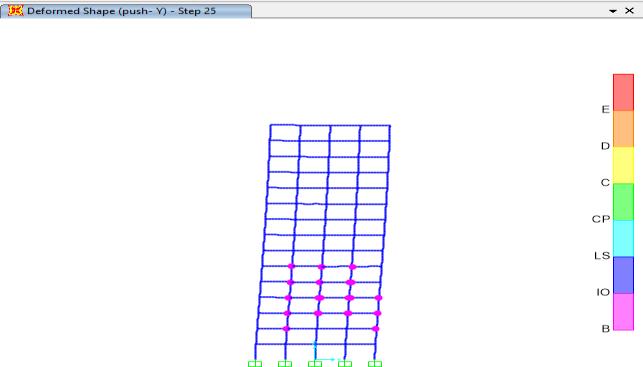
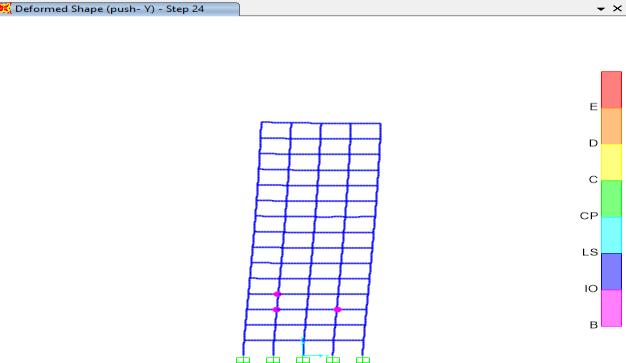
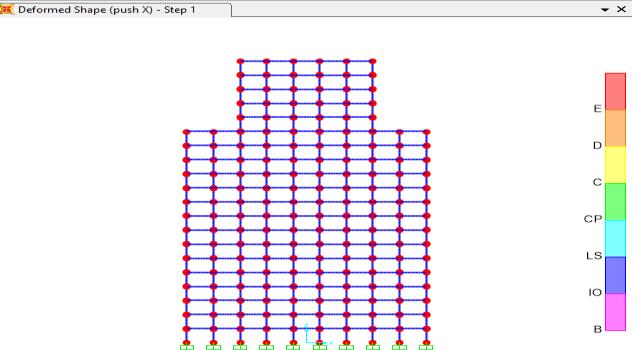
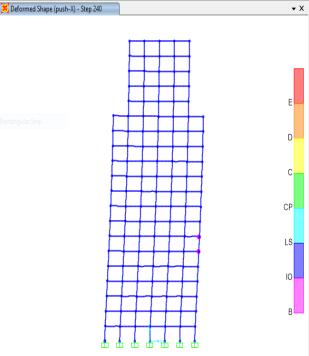
Fig.4.4 Hingeformationpushoverx-direction
iii)Pushoveriny-directionperformancepointcomesnearly betweenstep-34andstep-35withnumberofplastichinges formedare308and334respectively.
iv)Percentageofplastichingesformedremainswith6.5% v) Base shear in y-direction at performance point is 4623.166 kN with displacement0.085m.
vi)Themaximumstoreydriftremainswithin 0.1%atperformancepointinbothxandy direction.
Fig.4.5(a)Hingeformationpushovery-direction
( b ) ( a )
Fig.4.6Pushovercurve(Y-direction)
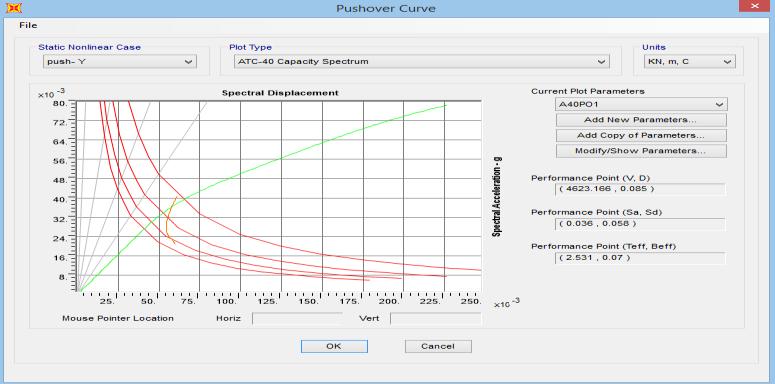
Fig.4.7Hingeformationduringpushoveriny-direction
2022, IRJET
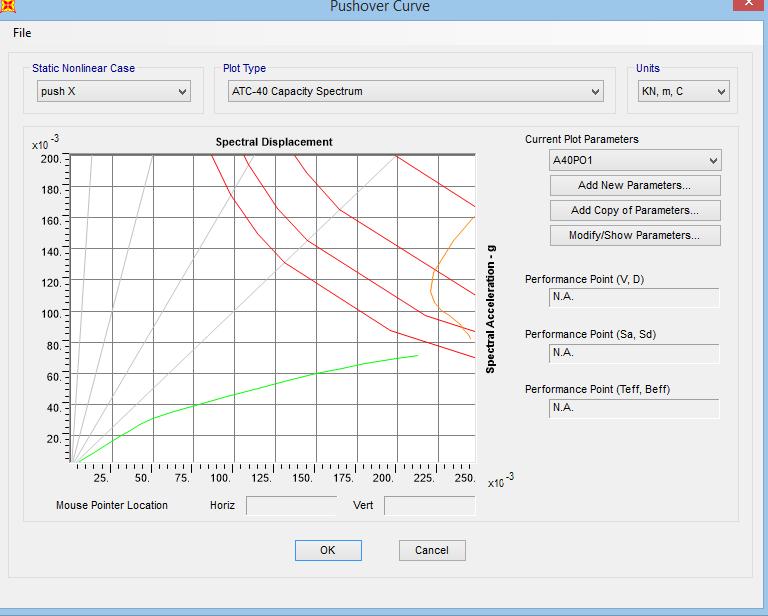
Fig.4.8Pushovercurve(X-direction)(L-type)
( a ) ( b ) ( b ) ( a )
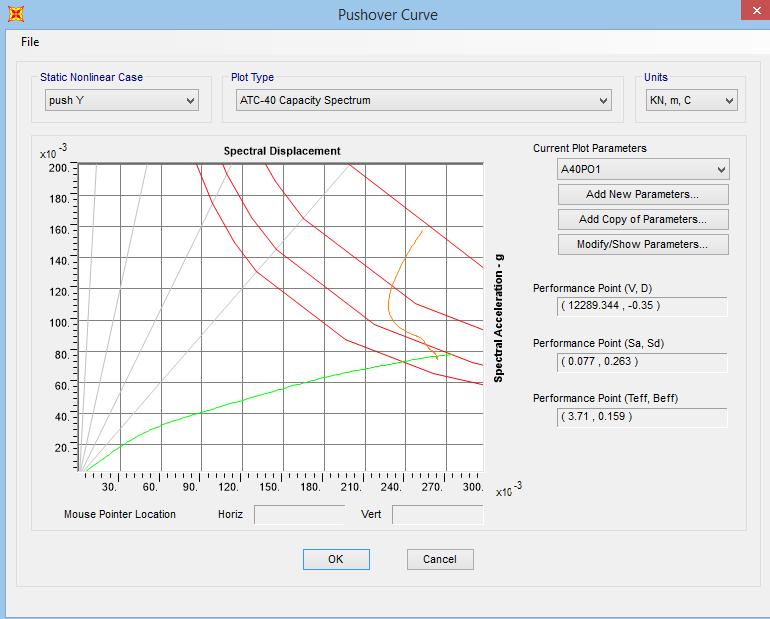
Fig.4.9Pushovercurve(Y-direction)(L-type)
Impact Factor value: 7.529 | ISO 9001:2008
International Research Journal of Engineering and Technology (IRJET) e-ISSN:2395-0056
i)Curve‘a’indicatesdemandspectrumandcurve‘b’indicates capacity spectrum, where ‘a’and ‘b’ intersects is knownas performancepoint.
ii)Performancepointnotapplicabletothismodel.
iii) The corresponding base shear is found to be not applicable.
iv)Plastichingeformationpushinxdirectionatstep5is0 whereas in step 6 it is 02. Maximum number of members undergoneinelasticdeformationimmediatelyinStep7is107.
Fig.4.10(a)Hingeformationpushoverx-direction3(L-type)
v) In y-direction performance point is found at base shear 12289.344kNwithcorrespondingdisplacement-0.035m.
vi)Performancepointliesbetweenstep1andstep2ofpush overiny-direction.
vii)Numberofplastichingesformediny-directionis9 withinperformancepoint.
viii) The maximum storey drift remains within 0.6% at performancepointinydirection.
Fig.4.10 (b) Hinge formation pushover x-direction of (Ltype)
Basedontheworkpresentedinthisreportwithequalplan areaandequalsetbackfollowingconclusionsaredrawn:
1. A detailed literature review on setback buildings concludethat the displacementdemandisdependentonthe geometricalconfigurationofframes.
2.Themaximumbaseshearinducedinthebuildingsisfound tobemoreinSquaretype(model1inX- direction)setback building.
Fig.4.11(a)Hingeformationpushovery-direction3(L-type)
3.Thebaseshearandcorrespondingdisplacementinduced inthebuildingwithinperformancepointisminimumincase ofRectangular-typeofsetbackbuilding(InYDirection).
4. The Square - type setback building has maximum displacementwithinperformancepoint.
5.Fromthecomparisonthemaximumbaseshearatcollapse occursinSquare-Typesetbackmodel(x-direction).
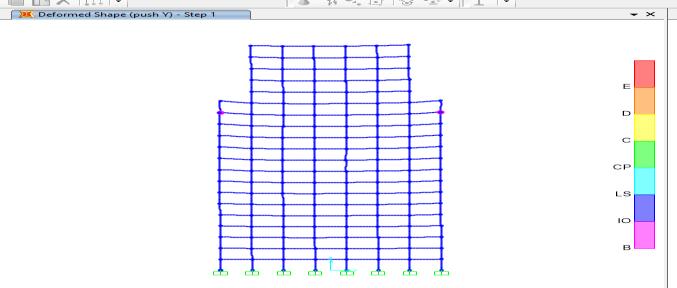
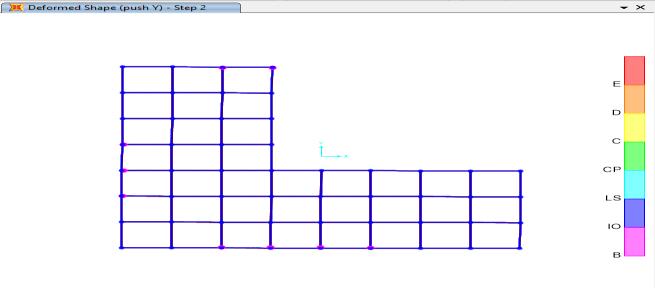
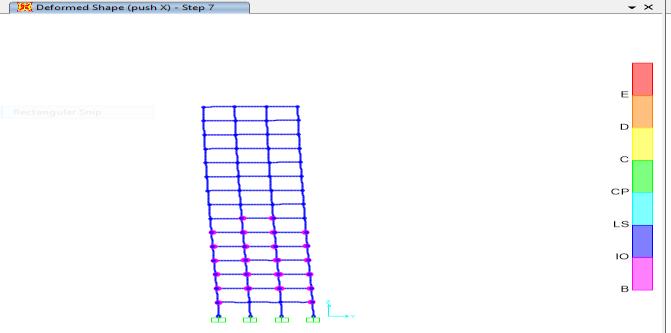
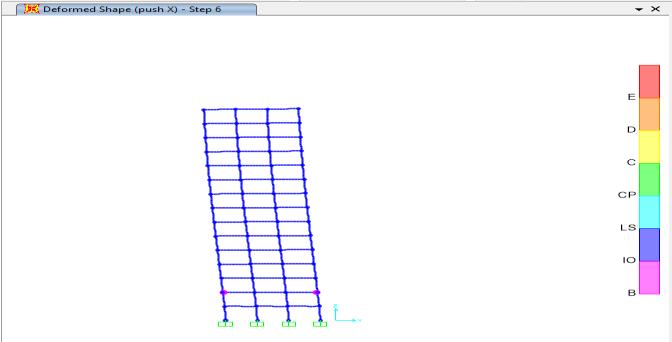
Fig.4.11(b)Hingeformationpushovery-directionof(L-type)
Discussionsdrawnfromthehingeformationduringpushover inbothxandydirectionofsetbackbuildingmodel-3(L-type) summarizedasfollows:
From the above pushover curve (fig 4.8 and fig 4.9) the followingkeypointsare:
Volume: 09 Issue: 11 | Nov 2022 www.irjet.net p-ISSN:2395-0072 © 2022, IRJET | Impact Factor value: 7.529 | ISO 9001:2008 Certified Journal |
6.Numberofplastichingesformedwithinperformancepoint islessincase ofSquare-typeofsetbackbuilding i.e.,hinge formationascomparedtoothertypeofbuildings.
7.Itisobservedthatforalltypeofstructuralelementsofouter peripheryenteredinplasticzonebeforeinternalelementsdue theirfartherplacement.
International Research Journal of Engineering and Technology (IRJET) e-ISSN:2395-0056 Volume: 09 Issue: 11 | Nov 2022 www.irjet.net p-ISSN:2395-0072
8. In case of L-type setback building (In Y Direction) some hinges exceeds the limit of immediate occupancy without any performance point making it more susceptible to earthquakegroundmotionduetoadditionaltwistingeffect.
1. ACI 318 (2005). “Building code requirements for reinforcedconcreteandcommentary”ACI318-05/ACI318R05,AmericanConcreteInstitute.
2. Aschheim, M.A., Maffei, J., and Black, E.F. (1998). Nonlinear static procedures and earthquake displacement demands. Proceedings of 6th U.S. National Conference on Earthquake Engineering,Seattle,Paper167.
3. ATC 40 (1996), Seismic Evaluation and Retrofit of ConcreteBuildings:Vol.1,AppliedTechnologyCouncil,USA.
4. Athanassiadou, C.J. (2008) Seismic performance of R/C plane frames irregular in elevation. Engineering structures 30,1250-1261.
5. Bracci, J.M., Kunnath, S.K. and Reinhorn, A.M. (1997). Seismic performance and retrofit evaluation of reinforced concrete structures. Journal of Structural Engineering, 123(1),3-10.
6. Chintanapakdee, C. and Chopra, A.K. (2004) Seismic response of vertically irregular frames: Response history and modal pushover analyses. ASCE Journal of Structural Engineering 130(8),1177-1185.
7. IS 456 (2000).IndianStandardforPlainandReinforced Concrete-CodeofPractice,BureauofIndianStandards,New Delhi.
8. IS: 1893-2016, CriteriaforEarthquake ResistantDesignof Structures, Part 1, Bureau of Indian Standards, New Delhi, India
9. IS: 875(2015) part -3, Indianstandardcodeofpractice fordesignloads(otherthanearthquakes)forbuildingsand structures,NewDelhi.
10. Chopra, A.K., and Goel, R.K. (2000). Evaluation of NSP to estimate seismic deformation: SDF systems. Journal of Structural Engineering, ASCE, 126(4),482–490.
11. Chopra, A.K. and Goel, R.K. (2001).Amodalpushover analysisproceduretoestimateseismicdemandsforbuildings: Theoryandpreliminaryevaluation.PEERReport2001/03, PacificEarthquakeEngineeringResearchCenter,Collegeof Engineering,UniversityofCalifornia,Berkeley.
12. Chopra, A.K. and Goel, R.K. (2002).Amodalpushover analysis procedure for estimating seismic demands for
buildings. Earthquake Engineering and Structural Dynamics, 31,561-582.
13. Chopra, A.K. and Goel, R.K. (2004)Amodalpushover analysis procedure to estimate seismic demands for unsymmetric-plan buildings. Earthquake Engineering and Structural Dynamics. 33,903-927.
14. Chopra, A. K., Goel, R. K., and Chintanapakdee, C. (2003).StatisticsofSingleDegree- of-FreedomEstimateof DisplacementforPushoverAnalysisofBuildings. Journal of StructuralEngineering ASCE, 129(4),449-469.
15. Eurocode 8 (2004), Design of Structures for EarthquakeResistance,Part-1:GeneralRules,SeismicActions and Rules for Buildings, European Committee for Standardization(CEN),Brussels.
16. FEMA 356 (2000),PrestandardandCommentaryfor the SeismicRehabilitation ofBuildings,AmericanSocietyof CivilEngineers,USA.
17. Gupta, B. and Kunnath, S.K. (2000).Adaptivespectrabased pushover procedure for seismic evaluation of structures. Earthquake Spectra, 16(2),367-391.
18. Jan, T.S.; Liu, M.W. and Kao, Y.C. (2004),Anupperbondpushoveranalysisprocedureforestimatingtheseismic demandsofhigh-risebuildings. Engineering structures 117 128.
19. Karavasilis, T.L., Bazeos, N. and Beskos, D.E. (2008) Seismic response of plane steel MRF with setbacks: Estimation of inelastic deformation demands.Journal of ConstructionalSteel Research 64, 644-654.
20. Krawinkler,H.andSeneviratna,G.D.P.K(1998).Pros and cons of a pushover analysisof seismic performance evaluation.EngineeringStructures, 20,452-464.
21. Miranda, E. (1999). Approximate seismic lateral deformation demands in multi-storey buildings. Journal of Structural Engineering, ASCE, 125(4),417–425.
22. Miranda, E.,and Ruiz-García, J. (2002).Evaluationof approximate methods to estimate maximum inelastic displacement demands. Earthquake Engineering and StructuralDynamics, 31(3),539–560.
23. Moghadam, A.S. and Tso, W.K. (2002). A pushover procedure for tall buildings. Proceedings of the 12th European Conference on Earthquake Engineering,Paper395. ElsevierScienceLtd.