International Research Journal of Engineering and Technology (IRJET) e-ISSN: 2395-0056

International Research Journal of Engineering and Technology (IRJET) e-ISSN: 2395-0056
1PG Scholar, Mechanical Department, Chebrolu Engineering College, Post & Mandal, Near Power Station, Chebrolu, Andhra Pradesh-522212.
2Associate professor, Mechanical Department, Chebrolu Engineering College, Post & Mandal, Near Power Station, Chebrolu, Andhra Pradesh-522212
3Principal, Chebrolu Engineering College, Post & Mandal, Near Power Station, Chebrolu, Andhra Pradesh-522212. ***
Abstract - Milling process plays a vital role in the machining processes. The efficiency of the milling process can beincreasedby different methodsandbydevelopingempirical relations between different parameters. Experimentally determined values can be optimized by using different techniques. The empirical models and investigate the optimal machinabilityparametersofmillingprocessduringmachining EN 31 toolsteel. Inthis consequence,millingexperimentswere conducted on vertical milling center based on central composite design with 27 experiments. The response surface methodology was adopted to develop the mathematical models for the responses and ANOVA is used to check the adequacy of the developed models and were found that the developed second order models can explain the variation in the temperature up tothe extent of98.06%and99.07%. Then these experimentally measured values were carried to the optimization. GRA was successfully implemented to the measured experimental runs. Therefore, the present work enables the industries to perform the CNC milling operations on the hardened EN 31 material within the optimal levels of tool temperatures by maximizing the metal removal rate.
Key Words: EN31tool,ANOVA,CNC,Implementationof GRA,MRRandTc.
Manyapproacheshavebeenproposedtominimizetheheat generationandenhancetoollifeandmetalremovalratein metalcutting.Asthechipformationprocessinmachiningis accompanied by heat generation, which influences the mechanicalandphysicalpropertiesofboththeworkpiece andthecuttingtool.Hightemperaturestendtoaccelerate thermal softening of the tool and subsequent tool wear, whicharenotdesirablebecausetheynegativelyimpactthe accuracy of the machined surface and tool life. In the aerospace, automotive, mould/die and general manufacturingindustries,thereisgreatpressuretoensure lower cost, greater productivity and improved quality in order to encourage economic growth. Chatter is a self-
excitedtypeofvibrationthatoccursinmetalcuttingifthe chipwidthistoolargewithrespecttothedynamicstiffness of the system, especially when machining with a high material removal rate. Among different types of milling processes,endmillingisoneofthemostvitalandcommon metalcuttingoperationsusedformachiningpartsbecauseof its capability to remove materials at faster rate with a reasonablygoodsurfacequality.Forthesereasons,CNCend millingprocesshasbeenrecentlyprovedtobeveryversatile and useful machining operation in most of the modern manufacturing industries. Only the implementation of automation in end milling process is not the last achievement.Itisalsonecessarytoimprovethemachining process and machining performances continuously for effective machining and also for the fulfillment of requirementsoftheindustries.Surfaceroughnessisakey factorinthemachiningprocesswhileconsideringmachining performanceandthatiswhyinmanycases,industriesare looking for maintaining the good surface quality of the machined parts. It is also necessary to study the material removal rate along with surface roughness in CNC end millingprocess.Inanymetalcuttingoperation,alotofheat is generated due to plastic deformation of work material, frictionatthetool–chipinterfaceandfrictionbetweenthe clearancefaceofthetoolandworkpiece.So,itisgenerally considered that the heat produced during the machining process is critical in terms of work piece quality. Thus, effective control of heat generated in the cutting zone is essential to ensure good work piece surface quality in machining.Allthesefactorspromptinvestigationsontheuse ofbiodegradablecoolantsandcoolantfreemachining.But anyattempttominimizeoravoidthecoolantcanbedealt with only by replacing the functions normally met by the coolantswithsomeothermeans.Iffrictionatthetooland work piece interaction can be minimized, by providing effectivelubrication,theheatgeneratedalsocanbereduced to some extent. Advancement in modern tribology has identified many solid lubricants, which can sustain and providelubricityoverawiderangeoftemperatures.
Volume: 09 Issue: 10 | Oct 2022 www.irjet.net p-ISSN: 2395-0072 © 2022, IRJET | Impact Factor value: 7.529 | ISO 9001:2008 Certified Journal | Page622
International Research Journal of Engineering and Technology (IRJET) e-ISSN: 2395-0056
Volume: 09 Issue: 10 | Oct 2022 www.irjet.net p-ISSN: 2395-0072
Hard milling is a machining process to cut the hardened materialsofhardnessrangeover45HRCwithsinglepoint cuttingtool.Nowaday,hardenedsteelsarebeingusedina varietyofindustrialapplicationslikeautomotivepartssuch asstuds,bearings,gears,cams,etc.However,itistobenoted that the turning of hardened steel with commonly used cuttinginsertsisinfluencedbymorenumberofmachining parametersandtheyadverselyaffectstheperformance of machining process. In order to minimize this, the conventional cutting inserts are getting replaced by specialized cutting inserts to cut the hardened materials lately. Some of these specialized inserts in existence are cubic boron nitride (CBN) inserts, polycrystalline cubic boron nitride (PCBN) and ceramic inserts. Some experimentalinvestigationshavebeenattemptedtopredict the performance of hard turning with the mentioned specialized cutting inserts. To reduce the milling related impact to the sub-surface area new process technological approachesforhigh-speedcuttinghavebeendevelopedin thelastdecades.Accordingto,thewearofthemillingtool spreadswiththehighesteffectivecuttingspeed,startingat the engagement point of the cutting edge, and can be reducedbyanadequateincreaseofthefeedpertooth.Ifthe feed per tooth and the cutting speed in the hard milling process fall below a critical value, the tool vibrations increaseandthetoolweargrowssignificantly.Inorderto provethesechippingmechanisms,thecomplexinteractions between the deformation rate, the elevated process temperature, the strength properties as well as the microscopicflowbehaviorandthestructuralintegrityofthe materialinthelocalcontactzone(sheerarea)betweenthe workpieceandthemillingtoolhavetobetakenintodetailed consideration. Increasing the cutting speed leads to increased friction in the sheer area which results in local elevatedprocesstemperatures.
Cutting Temperature and MRR are the most important machiningresponsesduringendmillingprocess.Theseout putparametersareinfluencednumerousprocessparameters duringmilling.Formtheliteraturesurveyitisfoundthatthe parameterssuchasdepthofcut,feedrateandspindlespeed arehavingconsiderableinfluenceoncuttingtemperatureand metalremovalrate.Themainobjectiveofthisinvestigation wastoinvestigatetheoptimalmachiningconditionsduring hardmillingwithconventionalcuttingtoolstoachievethe maximum metal removal rate (maximum production rate) withintheadequatemachiningcost.Thisworkalsodevelops the mathematical models for the cutting temperature and metalremovalrateintermsofdepthofcut,feedandspindle speed using response surface methodology. To study the influenceoftheseprocessparameters,theexperimentalruns
wereconductedusingResponseSurfaceMethod(RSM).RSM comprises a group of statistical techniques for empirical modelbuildingandmodelexploration.Theresponsesurface methodologyispractical,economicalandrelativelyeasyfor use. The experimental data were utilized to build mathematical model for first and second order model, by regressionmethod.Aresponseoroutputfunctionisrelated to a number of input variables that affect it. The variables studiedwilldependonthespecificfieldofapplication.The responsesurfacemethodcansubstantiallyreducethetotal numberofexperimentsoftencarriedoutrandomlyanditis anadequateandreliablemethodtomeasurethetruemean response of interest.Experiments were conducted on CNC milling machine to cut hardened tool steel with carbide cutting inserts. In order to reduce the number of experimentalruns,experimentsareplannedbasedondesign of experiments (DOE). Central composite design with 27experimentswasselected.The corresponding cutting temperatureandmaterielremovalrateforeachexperiment iscalculatedandrecorded.Analysisofvariancewasadopted tochecktheadequacyoftheexperimentallymeasuredvalues oftheresponses.Since,theoptimizationcannotbedoneto onlyoneobjective,whenanotherobjectiveisalsoimportant. Different solutions may produce conflicting scenarios between the two objectives. A solution, which is excellent withrespecttooneobjective,requiresacompromiseinthe otherobjective.Thisprohibitsonetochooseasolution,which isoptimalwithrespecttoonlyoneobjective,whichmakes the two objectives conflicting. The surface roughness and metal removal rate are inversely proportional. If metal removalrateisaimedtoincrease,thecuttingtemperatures willalsoincreasesandviceversa.Hence,thepresentproblem isconsideredasamultiobjectiveoptimizationproblem.Gray RelationalAnalysis(GRA)asaneffectiveandextensivelyused multi-objectiveoptimizationtechniqueforthemanufacturing problems.
Response surface methodology or RSM is a collection of mathematicalandstatisticaltechniquesthatareusefulfor themodelingandanalysisofproblemsinwhichresponseof interestisinfluencedbyseveralvariablesandtheobjective is to optimize this response. For example, suppose that a chemicalengineerwishestofindthelevelsoftemperature (x1) and pressure (x2) that maximizes the yield (y) of a process. The process yield is a function of the levels of temperatureandpressure,say
Y=f(x1,x2)+ε (3.1)
Where ε represents the noise or error observed in the processy.ifwedenotetheexpectedresponsebyE(y)=f(x1, x2)=η,thenthesurfaceisrepresentedby,iscalledresponse surface.
f(x1,x2) (3.2)
International Research Journal of Engineering and Technology (IRJET) e-ISSN: 2395-0056
Volume: 09 Issue: 10 | Oct 2022 www.irjet.net p-ISSN: 2395-0072
Weusuallyrepresenttheresponsesurfacegraphically,such asinfig4.1,whereηisplottedversusthelevelsofx1,x2.To helpvisualizetheshapeofaresponsesurface,weoftenplot thecontoursoftheresponsesurfaceasshowninfig4.2.in thecontourplot,linesofconstantresponsearedrawninthe x1,x2plane.Eachcontourcorrespondstoaparticularheight oftheresponsesurface.
InmostRSMproblems,theformoftherelationshipbetween the response and the independent variables is unknown. Thus,thefirststepinRSMistofindasuitableapproximation forthetruefunctionalrelationshipbetweenyandthesetof independentvariablesisemployed.Iftheresponseiswell modeledbyalinearfunctionoftheindependentvariables, thentheapproximatingfunctionisthefirstordermodel.
Y=β0+β1x1+β2x2+ +βkxk+ε (3.3)
If there is curvature in the system, then a polynomial of higherdegreemustbeused,suchasthesecondordermodel.
AlmostallRSMproblemsuseoneorbothofthesemodels,of course it is unlikely that a polynomial model will be a reasonableapproximationofthetruefunctionrelationship overtheentirespaceoftheindependentvariables,butfora relatively small reason, they usually work quite well. The methodofleastsquaresisusedtoestimatetheparameters in the approximating polynomials. The RSM is then performedusingthefittedsurface.Ifthefittedsurfaceisthe adequateapproximation,ofthetrueresponsefunction,then analysisofthefittedsurfacewillbeapproximatelyequalto analysisoftheactualsystem.Themodelparameterscanbe estimatedmosteffectivelyifproperexperimentaldesignis usedtocollectthedata.Designsforfittingresponsesurfaces arecalledresponsesurfaceresults.
Fitting and analyzing response surfaces are greatly facilitatedbytheproperchoiceofaexperimentaldesign.In this section, we discuss some aspects of selecting appropriatedesignsforfittingresponsesurfaces.
Whenselectingresponsesurfacedesign,someofthe featuresofadesirabledesignareasfollows;
1. Provides a reasonable distribution of data points (and henceinformation)throughoutregionofinterest.
2. Allows model adequacy, including lack of fit, to be investigated.
3.Allowsexperimentstobeperformedinblocks.
4.Allowsdesignsofhigherordertobebuildupsequentially.
5.Providesaninternalestimateoferror.
6.Providespreciseestimatesofthemodelcoefficients.
7.Providesagoodprofileofthepredictionvariancethrough theexperimentalregion.
8. Provides reasonable robustness against outliers or missingvalues.
9.Doesnotrequirealargenumberofruns.
10. Does not require too many levels of the independent variables.
11. Ensures simplicity of calculation of the model parameters.
Thesefeaturesaresometimesconflicting,sojudgmentmust oftenbeappliedindesignselection.
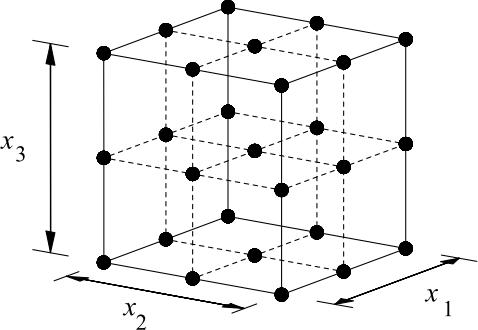
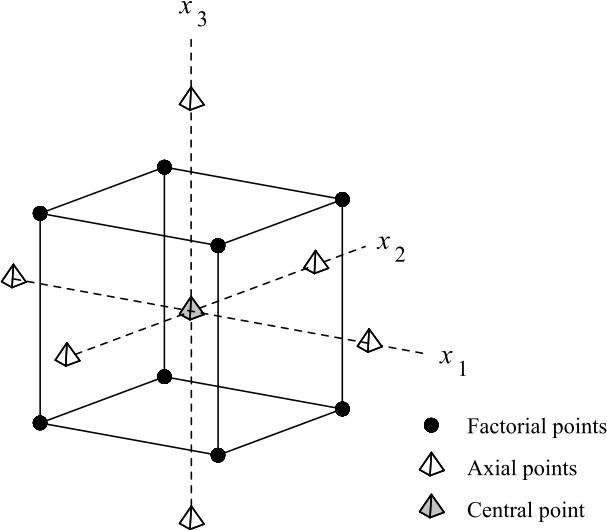
Supposewewishtofitthefirstordermodelinkvariables, thereisauniqueclassofdesignsthatminimizethevariance oftheregressioncoefficients(βi).Thesearetheorthogonal first-orderdesigns. Afirst-orderdesignisorthogonalifthe off-diagonalelementsofthe(X1X)matrixareallzero.This implies that the cross products of the columns of the X matrix sum to zero. The class of orthogonal first-order designs includes the 2k factorial and fractions of the 2k seriesinwhichmaineffectsarenotaliasedwitheachother. In using these designs, we assume that the low and high levelsofthekfactorsarecodedtousual±1levels.The2k designsdonotaffordanestimateoftheexperimentalerror unless some runs are replicated. A common method of including replication in the 2k designs is to augment the design with several observations at the center (the point xi=0,i=1,2,3, ,k).Theadditionofcenterpointstothe designsdoesnotinfluencethe(βi)fori≥1,buttheestimate of β0 becomes the grand average of all observations. Furthermore,theadditionofcenterpointsdoesnotalterthe orthogonally property of the design. Central composite design is the most popular class of designs just for fitting second order models. Generally the CCD consists of a 2k factorial(orfractionalfactorialofresolutionV)withnfruns, 2k axial or star runs and nc center runs.The practical deployment of a CCD often arises through sequential experimentation.Thatisthe 2khasbeenusedtofitafirst model,thismodelhasexhibitedlackoffitandtheaxialruns are then added to allow the quadratic terms to be incorporated in to the model. The CCD is a very efficient designforfittingthesecondordermodel.
An important aspect of RSM is the design of experiments (BoxandDraper,1987),usuallyabbreviatedasDoE.These strategieswereoriginallydevelopedforthemodelfittingof physicalexperiments,butcanalsobeappliedtonumerical experiments. The objective of DoE is the selection of the pointswheretheresponseshouldbeevaluated. Mostofthe criteria for optimal design of experiments are associated withthemathematicalmodeloftheprocess.Generally,these mathematical models are polynomials with an unknown structure,sothecorresponding experimentsare designed onlyforeveryparticularproblem.Thechoiceofthedesignof
International Research Journal of Engineering and Technology (IRJET) e-ISSN: 2395-0056
Volume: 09 Issue: 10 | Oct 2022 www.irjet.net p-ISSN: 2395-0072
experimentscanhavea largeinfluenceontheaccuracyof theapproximationandthecostofconstructingtheresponse surface.
InatraditionalDoE,screeningexperimentsareperformedin theearlystagesoftheprocess,whenitislikelythatmanyof the design variables initially considered have little or no effectontheresponse.Thepurposeistoidentifythedesign variablesthathavelargeeffectsforfurtherinvestigation.A particular combination of runs defines an experimental design.Thepossiblesettingsofeachindependentvariablein the n dimensionalspacearecalledlevels.
Figure-3 Centralcompositedesignfor3designvariablesat 2levels
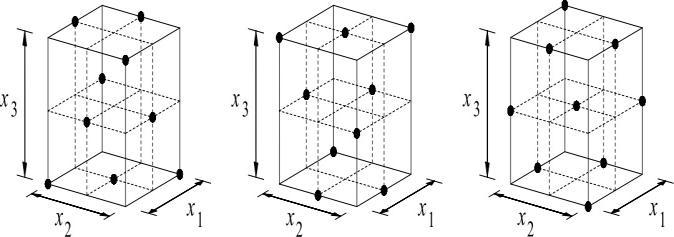
Figure-1: A33fullfactorialdesign(27points)
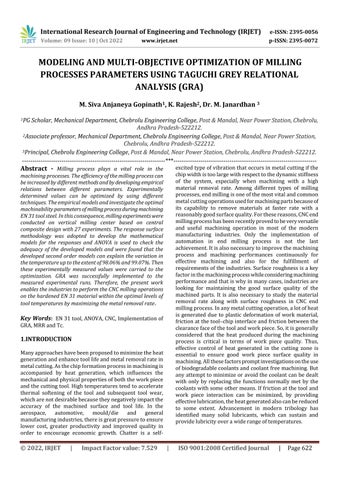
Figure -2: Threeone-thirdfractionsofthe33 design
Ifeachofthevariablesisdefinedatonlythelowerand upper bounds (two levels), the experimental design is called 2nfull factorial. Similarly, if the midpoints are included,thedesigniscalled3n fullfactorialandshown inFigure-1.
Let the original reference sequence and comparability sequencesberepresentedasDatapreprocessingnormallyis requiredsincetherangeandtheunitinonedatasequence can be different from those in another sequence. Correspondingly,datapreprocessingisnecessarywhenthe sequencescatterrangeistoolarge,orthetargetsequence directions are different. Data preprocessing involves the transferoftheoriginalsequencetoacomparablesequence. Depending on the data sequence characteristics, some methods of data preprocessing are available for the grey relational analysis. If the target value of the original sequence is infinite, then it has a “the larger the better” characteristic. It means, the overall gray relational grade convertsthemulti-response(multi-grayrelationalgrades) optimization problem into a single response (overall gray relationalgrade)optimizationproblem,withtheobjective function as maximization of overall grey relational grade. Hence, the overall grey relational grades rank the experimental runsas;the experimental runhavinghigher grey relational grade refers as that corresponding combinationofvariablesisclosertotheoptimalvalues.The optimal parametric combination is then evaluated by maximizingtheoverallgreyrelationalgrade.
In this work, depth of cut, feed and cutting speed are considered as the control variables and MRR and cutting temperatureastheoutputresponses.Inordertoreducethe number of experimental runs, experiments were planned based on design of experiments (DoE). Central composite designwith27experimentswasselected.Table-1,liststhe machiningconditionsandTable-2, liststhefeasiblevaluesof each process variable. Experiments are conducted on a precision CNC milling machine model BFW AGNI 45.
International Research Journal of Engineering and Technology (IRJET) e-ISSN: 2395-0056
Volume: 09 Issue: 10 | Oct 2022 www.irjet.net p-ISSN: 2395-0072
HardenedsteelEN31plateofsize150x100x10mmwith≈60 HRC is considered as the work piece material and TaeguTecmake M9810048402 carbide milling turning insertsandwithSCRM90TP45016R18DTGNLmillingcutter with 4 cutting inserts was used in machining. For each experimentalrun,themetalremovalrateiscalculatedbythe weightlossmethod.Eachexperimentisrunforafixedlength of75mmlength.
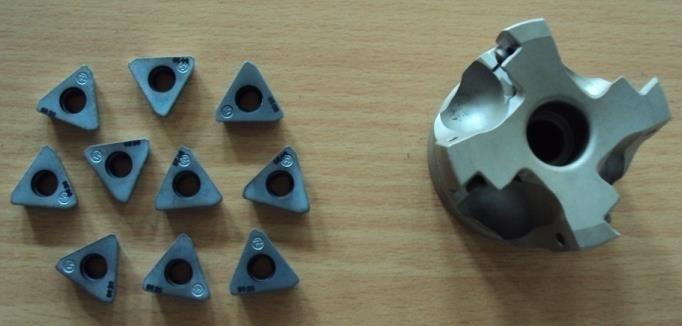
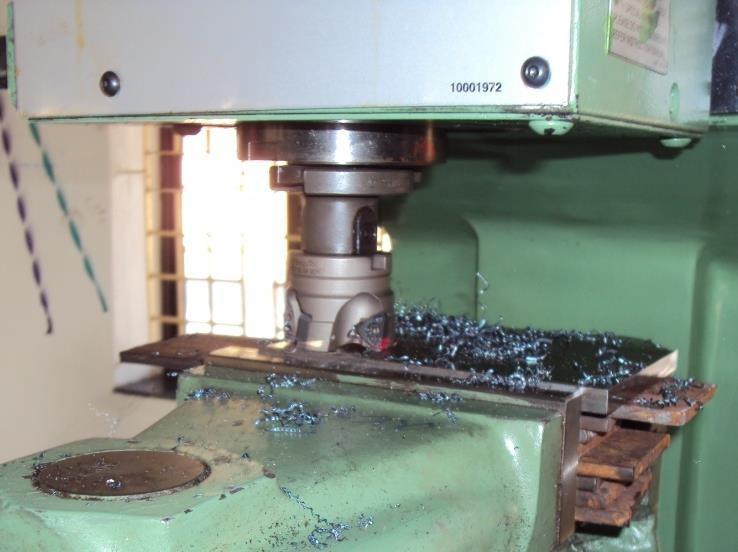
During each experiment the cutting temperature was measuredbyanIRThermometerbymaintaining1.5meter distance between the thermometer and cutting tool edge. Each experiment was repeated for three times and the averageofthemeasuresvalueswereconsideredasthefinal response values. Table-3, represents the matrix of experimentalvalues.TheFigure-4,showstheexperimental setup.TheFigure-5and6showthecuttingtools&cutter andtheIRThermometerfortemperaturemeasurementused in experimentations. The recorded temperature using IR thermometerduringthe10thexperimentisshowninThe Figure-7.
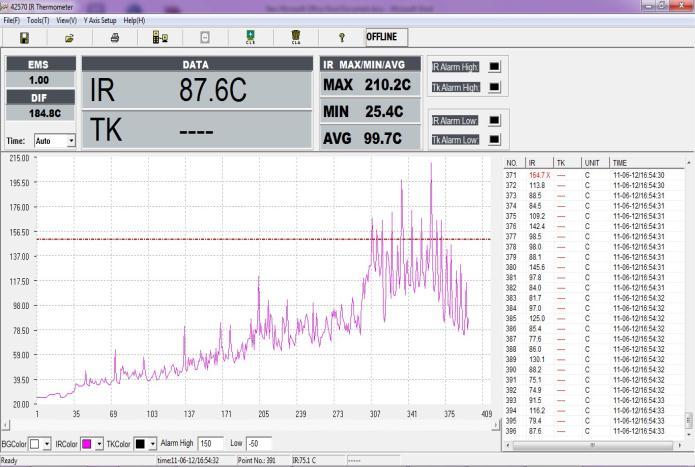
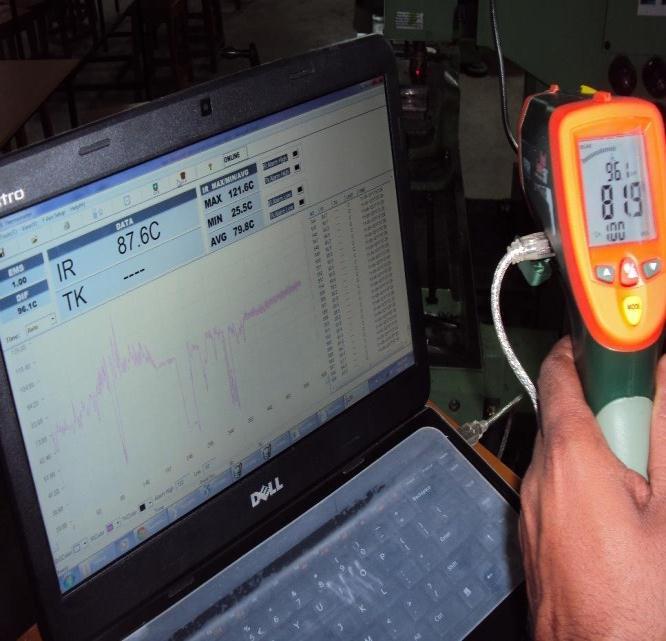
Figure-7 RecordedtemperatureusingIRThermometer duringthe10th experiment
Table -1: Machiningconditions (a) Workpiece material: EN31hardenedtoabout60HRC (b) Chemical composition:
C-0.43%,Si-0.26%,Mn-0.58%,Cr1.17%,Ni1.35%,Mo-0.25%,P-0.028%,S0.036% (c) Workpiece dimensions: 150x100x10mm (d) Locationof workpiece: Betweenchuckoverthetable (e) Temperature measurement
IRThermometer Model:42570,Make:EXTECH Instruments.Range:upto2000 deg.C (f) Milling Machine Model:AGNI45 Make:BFW (g) MillingCutter Model: SCRM90TP45016R18DTGNL
International Research Journal of Engineering and Technology (IRJET) e-ISSN: 2395-0056
Volume: 09 Issue: 10 | Oct 2022 www.irjet.net p-ISSN: 2395-0072
Make:TaeguTec
(h) Cutting Inserts Designation:M9810048402 Make:TaeguTec
(i) Machining Type DryMachining
Table -2: Controlfactorsandtheirlevels
no. Parameter Units Notation -1 0 1
1 Depthof cut mm X1 0.1 0.2 0.3
2 FeedRate mm/tooth X2 0.1 0.3 0.5
3 Cutting speed Rpm X3 120 180 240
Table -3: Centralcompositedesignwithcorresponding outputvaluesofMRRandTC
Exp. No. DOC F Vc Rpm MRR TC. mm mm/tooth grm/min OC
1 0.1 0.1 120 0.00545 169.05
2 0.1 0.1 180 0.00854 181.29
3 0.1 0.1 240 0.01055 245.94
4 0.1 0.3 120 0.00848 247.29
5 0.1 0.3 180 0.01154 278.44
6 0.1 0.3 240 0.01358 344.44
7 0.1 0.5 120 0.02645 419.28
8 0.1 0.5 180 0.02954 460.62
9 0.1 0.5 240 0.03152 539.59
10 0.2 0.1 120 0.02345 210.2
11 0.2 0.1 180 0.02654 231.36
12 0.2 0.1 240 0.02855 286.01
13 0.2 0.3 120 0.02645 276.39
14 0.2 0.3 180 0.02954 307.54
15 0.2 0.3 240 0.03156 373.54
16 0.2 0.5 120 0.04445 435.84
17 0.2 0.5 180 0.04754 477.17
18 0.2 0.5 240 0.04951 556.14
19 0.3 0.1 120 0.04845 277.42
20 0.3 0.1 180 0.05154 299.66
21 0.3 0.1 240 0.05353 354.31
22 0.3 0.3 120 0.05145 333.71
23 0.3 0.3 180 0.05454 364.86
24 0.3 0.3 240 0.05652 430.86
25 0.3 0.5 120 0.06945 480.62
26 0.3 0.5 180 0.07254 391.95
27 0.3 0.5 240 0.05454 580.92
Source Sumof Squares Mean Square F Value
pvalu e df Prob >F
Model 3.88E+05 9 4.32E+04 201.0 1 < 0.00 01
x1 9.08E+03 1 9.08E+03 42.29 1 < 0.00 01
x2 6.34E+04 1 6.34E+04 295.1 8 < 0.00 01
x3 2.17E+04 1 2.17E+04 101.0 9 < 0.00 01
x1x2 1.03E+03 1 1.03E+03 4.783 6 0.04 3
x1x3 6.51E+01 1 6.51E+01 0.303 0.58 91
x2 x3 8.96E+02 1 8.96E+02 4.175 0.05 68
x1x1 1.29E+03 1 1.29E+03 6.013 0.02 53
x2 x2 1.07E+04 1 1.07E+04 49.78 4 < 0.00 01
x3 x3 3.17E+02 1 3.17E+02 1.475 9 0.24 1 Residual 3.65E+03 17 2.15E+02
signi fican t
Lackof Fit 7.98E+03 5 1.80E+03 8.141 7 0.45 not signi fican t RSquared 0.9907 AdjRSquared 0.985763
Table -5: ANOVAforResponseSurfaceMRRReduced QuadraticModel
Source
Sumof Mean F pvalue Squares d f Square Value Prob> F
Model 9.50E-03 9 1.06E-03 95.71 8 < 0.000 1 significan t
x1 2.26E-03 1 2.26E-03 204.6 < 0.000 1
x2 5.86E-04 1 5.86E-04 53.07 < 0.000 1
x3 7.56E-06 1 7.56E-06 0.685 1 0.419 3
x1x2 3.46E-05 1 3.46E-05 3.138 7 0.094 4
x1x3 3.60E-05 1 3.60E-05 3.262 6 0.088 6
x2 x3 3.77E-05 1 3.77E-05 3.413 6 0.082 1
x1x1 3.43E-05 1 3.43E-05 3.107 7 0.095 9
International Research Journal of Engineering and Technology (IRJET) e-ISSN: 2395-0056 Volume: 09 Issue: 10 | Oct 2022 www.irjet.net p-ISSN: 2395-0072
x2 x2 1.98E-04 1 1.98E-04 17.93 1 0.000 6
x3 x3 1.99E-05 1 1.99E-05 1.805 1 0.196 7 Residua l 9.20E+0 3 6 1.53E+0 3 Lackof Fit 8.98E+0 3 5 1.80E+0 3 8.141 7 0.259 7 not significan t RSquared 0.98064 8 AdjRSquared 0.97040 3
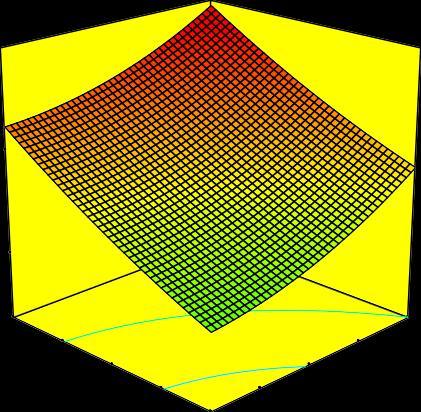
levelsofdepthofcutandfeedandhasincreasingnaturetothe increased levels of both depth of cut and feed. When the depthofcutandfeedareincreasedtogether,theincreased volumeoftheworkpiecematerialwillbefedagainstthetool tipandhencethecuttingtemperaturegetsincreased.
Theestimatedinteractiveresponsesurfacefortemperature accordingtothedesignparametersofdepthofcutandspeed atthemiddleleveloffeedisshowninFigure-9.Thisfigure displaysthat,thecuttingtemperatureisloweratthelower levelsofdepthofcutandspeedandhasincreasingnatureto theincreasedlevelsofbothdepthofcutandfeed.
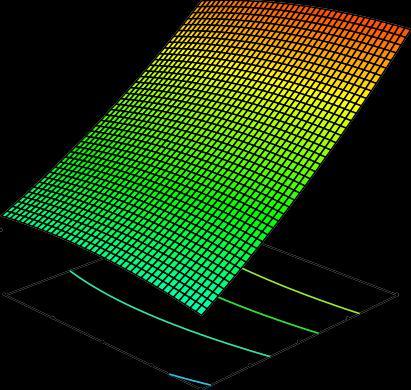
As the depth of cut and speed are increased together, the chip flow velocity gets increasedover the cutting inserts and hence the cutting temperature gets increased.
Figure-7 NormalprobabilityplotoftheresidualsforTC
Depth of Cut
Figure-9 Interactiveeffectofdepthofcutandspeedon Temperature
Figure-8 Interactiveeffectofdepthofcutandfeedon Temperature
Theestimatedinteractiveresponsesurfacefortemperature accordingtothedesignparametersofdepthofcutandfeed atthemiddlelevelofspeedisshowninFigure-8.Thisfigure displaysthat,thecuttingtemperatureisloweratthelower
Depth of Cut
Figure-9 Interactiveeffectofdepthofcutandspeedon MRR
International Research Journal of Engineering and Technology (IRJET) e-ISSN: 2395-0056
Volume: 09 Issue: 10 | Oct 2022 www.irjet.net p-ISSN: 2395-0072
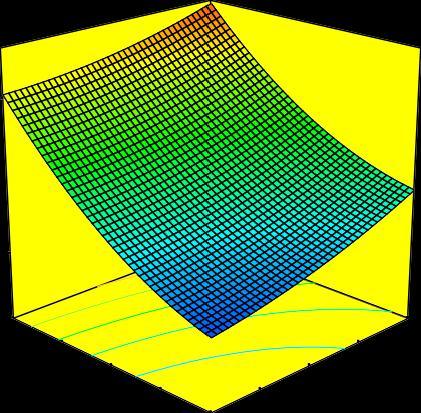
The estimated interactive response surface for MRR according to the design parameters ofdepth of cut and speed at the middle level of feed is shown in Figure-10. ThisfiguredisplaysthatthevalueofMRRincreaseswith increaseindepthofcutandcuttingspeed.
Thereason is, at higherdepth of cut and higher cutting velocitiestherateofmetalfedagainstthecuttinginsertis moreandhenceincreasedMRR.
24 0.7617 0.3809 0.2383 0.6191 25 0.9545 0.2633 0.0455 0.7367 26 1.0006 0 -0.0006 1 27 0.7321 0.0261 0.2679 0.9739
Exp. No. MRR Temp. gi Rank grm/min OC
1 0.3333 1 0.6667 2
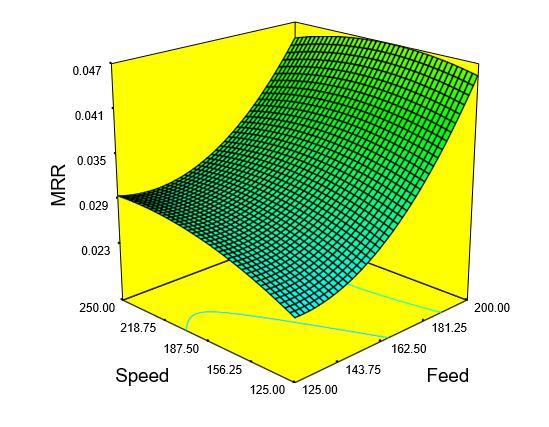
Figure-10 InteractiveeffectoffeedandspeedonMRR
Table -6: Normalizedvaluesandgreyrelational coefficients
Exp. No.
NormalizedValues Doi MRR Temp. MRR Temp. grm/min OC grm/min OC 1 0 1 1 0
2 0.0461 0.9711 0.9539 0.0289 3 0.0761 0.8182 0.9239 0.1818 4 0.0452 0.815 0.9548 0.185 5 0.0908 0.7413 0.9092 0.2587 6 0.1213 0.5853 0.8787 0.4147 7 0.3132 0.4083 0.6868 0.5917 8 0.3593 0.3105 0.6407 0.6895
9 0.3888 0.1238 0.6112 0.8762 10 0.2685 0.9052 0.7315 0.0948 11 0.3145 0.8527 0.6855 0.1473 12 0.3445 0.7234 0.6555 0.2766 13 0.3132 0.7462 0.6868 0.2538 14 0.3593 0.6725 0.6407 0.3275 15 0.3894 0.5165 0.6106 0.4835
16 0.5817 0.3691 0.4183 0.6309
17 0.6277 0.2714 0.3723 0.7286
18 0.6571 0.0847 0.3429 0.9153
19 0.6413 0.7437 0.3587 0.2563
20 0.6874 0.6912 0.3126 0.3088
21 0.7171 0.5619 0.2829 0.4381
22 0.6861 0.6106 0.3139 0.3894 23 0.7321 0.537 0.2679 0.463
2 0.3439 0.9453 0.6446 4 3 0.3511 0.7333 0.5422 14 4 0.3437 0.7299 0.5368 16 5 0.3548 0.6591 0.5069 18 6 0.3626 0.5466 0.4546 24 7 0.4213 0.458 0.4397 25 8 0.4383 0.4204 0.4293 26 9 0.45 0.3633 0.4066 27 10 0.406 0.8407 0.6233 5 11 0.4218 0.7724 0.5971 8 12 0.4327 0.6439 0.5383 15 13 0.4213 0.6633 0.5423 12 14 0.4383 0.6042 0.5213 17 15 0.4502 0.5084 0.4793 22 16 0.5445 0.4421 0.4933 20 17 0.5732 0.407 0.4901 21 18 0.5932 0.3533 0.4732 23 19 0.5823 0.6612 0.6217 6 20 0.6153 0.6182 0.6167 7 21 0.6386 0.533 0.5858 10 22 0.6143 0.5622 0.5882 9 23 0.6512 0.5192 0.5852 11 24 0.6772 0.4468 0.562 12 25 0.9166 0.4043 0.6604 3 26 1.0012 0.333 0.667 1 27 0.6512 0.3392 0.4952 19
Table -8: Optimal values of machining responses and the corresponding input parameters (26thExperiment)
Exp. No.
DOC F Vc Rpm MRR TC. mm mm/tooth grm/min OC 1 0.1 0.1 120 0.00545 169.05 2 0.1 0.1 180 0.00854 181.29 3 0.1 0.1 240 0.01055 245.94
International Research Journal of Engineering and Technology (IRJET) e-ISSN: 2395-0056
Volume: 09 Issue: 10 | Oct 2022 www.irjet.net p-ISSN: 2395-0072
4 0.1 0.3 120 0.00848 247.29
5 0.1 0.3 180 0.01154 278.44
6 0.1 0.3 240 0.01358 344.44
7 0.1 0.5 120 0.02645 419.28
8 0.1 0.5 180 0.02954 460.62
9 0.1 0.5 240 0.03152 539.59
10 0.2 0.1 120 0.02345 210.2
11 0.2 0.1 180 0.02654 231.36
12 0.2 0.1 240 0.02855 286.01
13 0.2 0.3 120 0.02645 276.39
14 0.2 0.3 180 0.02954 307.54
15 0.2 0.3 240 0.03156 373.54
16 0.2 0.5 120 0.04445 435.84
17 0.2 0.5 180 0.04754 477.17
18 0.2 0.5 240 0.04951 556.14
19 0.3 0.1 120 0.04845 277.42
20 0.3 0.1 180 0.05154 299.66
21 0.3 0.1 240 0.05353 354.31
22 0.3 0.3 120 0.05145 333.71
23 0.3 0.3 180 0.05454 364.86
24 0.3 0.3 240 0.05652 430.86
25 0.3 0.5 120 0.06945 480.62
26 0.3 0.5 180 0.07254 392
27 0.3 0.5 240 0.05454 580.92
This work aimed to develop the empirical models and investigate the optimal machinabilityparametersofmillingprocess duringmachiningEN31toolsteel.
In this consequence, milling experiments wereconductedonverticalmillingmilling Centrebasedoncentralcompositedesign with27experiments.
The response surface methodology was adopted to develop the mathematical models for the responses and ANOVA is used to check the adequacy of the developedmodelsandwerefoundthatthe developed second order models can explainthevariationinthetemperatureup totheextentof98.06%and99.07%.Then
Factor value:
these experimentally measured values werecarriedtotheoptimization.GRAwas successfullyimplementedtothemeasured experimentalruns.
The resulted optimal values of the milling processwerelisted.Hence,anoperatorcan easily find out the optimal marching conditionswithoutcompromisingateither metal removal rate or the cost oftooling withthisinvestigation.
[1] Okada,M.,Hosokowa,A.,Tanaka,R.,Ueda,T.Cutting PerformanceofPVD-coatedcarbideandCBNtoolsin hardmilling,InternationalJournalofMachineTools& Manufacture,2011,51,pp.127–132.
[2] Kochy,P.,Dewes,R.C.,Aspinwall,D.K.Highspeedend milling of hardened AISI D2 tool steel (~58 HRC), JournalofMaterialsTechnology,2002,127,pp.s266–273
[3] Salomon, C. Verfahren zur Bearbeitung vonMetallen oder bei einer Bearbeitung durch schneidende Werkzeuge sich ähnlich erhaltende Werkstoffe, GermanpatentNo.523594,1931
[4] Tönshoff, K. et al. Hochgeschwindigkeitsspanen metallischerWerkstoffe,WILWY-VCHVerlagGmbh& Co.KGaA,2005
[5] Klocke et al. Characterization of Tool Wear in HighSpeed Milling of Hardened Powder Metallurgical Steels,AdvancesinTribology,Volume2011(2011)
[6] El-Magd,E.,Treppmann, C. Mechanical behaviourof materialsathighstrainrates,ScientificFundamentals ofHSC,2001,pps.113–136
[7] Aslan E., Camuscu N., Birgoren B. Design optimization of cutting parameters when turning hardened AISI4140 steel (63 HRC) with Al2O3 + TiCN mixed ceramic tool.Mater.Des.2007;28:1618–1622.
[8] NalbantM.,GokkayaH.,SurG.ApplicationofTaguchi methodintheoptimizationofcuttingparametersfor surface roughness in turning. Mater. Des. 2007;28:1379–1385.
[9] KalpakjianS.,SchmidS.R.ManufacturingEngineering andTechnology, International. 4thed.Prentice Hall; UpperSaddleRiver,NJ,USA:2001.pp.536–681.
[10]EIBaradieM.A.Cuttingfluids:partI characterization.J.Mat.Proc.Tech.1996;56:786–797.
International Research Journal of Engineering and Technology (IRJET) e-ISSN: 2395-0056 Volume: 09 Issue: 10 | Oct 2022 www.irjet.net p-ISSN: 2395-0072
[11] Alauddin M., EL Baradie M.A., Hashmi M.S.J. Prediction of tool life in end milling by response surface methodology. J. Mater. Proc. Tech. 1997;71:456–465.
[12] Hasegawa M., Seireg A., Lindberg R.A. Surface roughnessmodelforturning.Tribol.Int.1976;6:285–289.
[13] Alauddin M., El Baradie M.A., Hashmi M.S.J. Computer-aidedanalysisofasurface-roughnessmodel forendmilling.J.Mat.Proc.Tech.1995;55:123–127.
[14] Alauddin M., El Baradie M.A., Hashmi M.S.J. Optimizationofsurfacefinishinendmilling Inconel 718.J.Mat.Proc.Tech.1996;56:54–65.
[15] EI-Baradie M.A. Surface roughness model for turning grey cast iron 1154 BHN. Proc. IMechE.1993;207:43–54.
[16] Bandyopadhyay B.P., Teo E.H. Application of factorialdesignofexperimentinhighspeedturning. Proc. Manuf. Int. Part 4, Advances in Materials & Automation,Atlanta;GA,USA,ASME,NY.1990.pp.3–8.
[17] Gorlenko O.A. Assessment of starface roughness parameters and their interdependence. Precis. Eng.1981;3:105–108.
[18]ThomasT.R.Characterisationofsurfaceroughness. Precis.Eng.1981;3:2–8.
[19] Mital M. Mehta, Surface roughness prediction models for fine turning. Int. J. Pro. Re. 1988;26:1861–1876.
[20] Sokovic,M.,Kopac,J.,Dobrzanski,L.A.,Adamiak,M. WearofPVDcoatedsolidcarbideandmillsindryhighspeed cutting, Journal of Materials Processing Technology,2004,pp.422–426
2022, IRJET | Impact Factor value: 7.529 | ISO 9001:2008 Certified Journal | Page631