International Research Journal of Engineering and Technology (IRJET) e-ISSN:2395-0056

Volume: 09 Issue: 10 | Oct 2022 www.irjet.net p-ISSN:2395-0072
International Research Journal of Engineering and Technology (IRJET) e-ISSN:2395-0056
Volume: 09 Issue: 10 | Oct 2022 www.irjet.net p-ISSN:2395-0072
Students (M Tech), Department of Civil engineering, College of Engineering Trivandrum, Kerala, India. Assistant Professor, Department of Civil Engineering, College of Engineering, Trivandrum, Kerala, India. Research Associate, International Center for Technological Innovations, Alleppey, Kerala, India. ***
Abstract: Natural disasters like floods are causing massive damage to natural and human resources, especially in coastal areas. Hence, identifying the susceptibleareastofloodisanimportanttaskforevery country to prevent such dangerous consequences. GIS and remote sensing techniques have provided many ways to control and manage floods like flood forecasting, providing spatial information etc. Concerning social, economic, and environmental perspectives, flood is one of the most devastating disasters in Chennai corporation for the past many years. Urban Flood susceptibility mapping is done using Random Forest (RF) model. Urban Flood Susceptibility map was generated using this model by considering eleven different independent variables (land use/land cover, elevation, slope, aspect, NDVI, NDBI, Topographic Wetness Index, Stream Power Index, rainfall, drainage density, distance from river) and past flood and non-flood locations. In total, 300 historic flood locations and 300 non-flood locations were collected from past flood episodes data. The independentvariablesandhistoricfloodandnon-flood locations were combined to generate the database for flood susceptibility mapping. From this, 85% of the data is taken for training the model and 15% of the datasetisusedfortestingandvalidation.TheRandom Forest model showed a prediction accuracy of 95.5%. The output obtained from the Random Forest model was used to map the urban flood susceptibility for ChennaiCorporation,producingthebestoutcomesand hasclassifiedtheregionsintolowandhighsusceptible zones. Hence, the RF model is well suitable for predicting the urban flood susceptibility zone. The findings of this analysis will assist decision-makers in carryingouteffectivefloodmanagementinthefuture.
Most individuals worldwide are exposed to several types of natural disasters. One of the most important natural disasters on the globe among them is flooding. Waterlogging and floods are caused by sudden, extensive,and persistent rainfall.Itisknown that13% ofAsia'spopulationlivesinlowelevationcoastalareas thatareseverelyexposedtoweathereventslikefloods and 140 million people are affected by a flood event.
This is especially true in the region of South India due tothedepressionoverthesouthwestBayofBengaland owing to a strong El Nino. South India's Chennai is a significant coastal low-lying metropolis. The previous floods in Chennai in 1976, 1985, 1996, 1998, 2005, 2008, 2010, 2015, and 2021 resulted in massive damages to property, infrastructures, and human health.Majorriversanddrainagemanagementsystems failing are the causes of these flood occurrences. Control and preventive measures should be taken for managingthedamages caused by floods to agriculture, infrastructure and other natural resources (Hamid et al., 2007). Therefore, the flood susceptibility study is significant for early warning systems and mitigation of upcoming flood scenarios. The application of machine learning (ML) techniques to determine a natural hazard's vulnerability has advanced quickly in recent years. The following three sections can be used to describe the general research goals of this type of study. They are the building of a spatial database, a framework for assessing hazards' susceptibility based on ML and variables connected to hazards, and the acquisition of a hazard susceptibility map. The employment of benchmark ML techniques with great computing efficiencyandverybasicstructures,suchas Decision Tree, Support Vector Machine, etc. These studies now choose to assess the susceptibility to naturalhazardsutilisingstate-of-the-artMLtechniques with more complicated structures such as adaptive neuro-fuzzy inference systems, convolutional neural networks,andrecurrentneuralnetworks.(Zaholietal., 2015).
International Research Journal of Engineering and Technology (IRJET) e-ISSN:2395-0056
Volume: 09 Issue: 10 | Oct 2022 www.irjet.net p-ISSN:2395-0072
Machine learning can successfully circumvent the data scarcity that many prediction models encounter, it has become widely used in the field of assessing the susceptibility to natural hazards. However, there are still existing technical issues that would render effects thatarenotfavourabletothesusceptibilityassessment results. The main aim of this study is to identify and mapoutfloodsusceptiblezonesintheChennai
In this study, Chennai corporation is taken as the study area. It is one of the major metro cities in India. The instantaneousheavy,widespreadandcontinuousrainfall leads to water logging and floods. In particular, in the region of South India due to the depression over the southwest Bay of Bengal and owing to a strong El Nino. Chennai is an important coastal low-lying city in south India. The past flood events of Chennai in 1976, 1985, 1996, 1998, 2005, 2008, 2010, 2015, and 2021 caused several damages to property, human health and infrastructure and many more. The reasons for these flood events are the failure of major rivers and the drainage management system. To controlling of floods andsuggestpreventivemeasuresarenecessarytoreduce the probable damages to agriculture, infrastructure, and other natural resources. Therefore, the flood susceptibility study is significant for the early warning system and mitigation of upcoming flood episodes in Chennaicorporation.
Theobjectiveofthisstudyistogenerateanurbanflood susceptibility map of Chennai corporation using the Random Forest method. Floods are the most frequent naturally occurring disasters and can cause great damage to human life and property. The factors affecting floods include factors like rainfall and cyclone frequency in that area and hazard inducing environmental factors such as elevation, land use factors etc. The disaster inducing factors are less predictable but geographic analysis can be used to predict the risk distribution of hazard inducing environmentalfactors.Thus,thesusceptibilitytoaflood event and the impact of the same are different for different regions based on these parameters. By developing a systematic procedure for flood susceptibilityassessmentandcreatingthemodelforthe same, the flood risk of any geographical area can be computed by following this methodology. The input parametersandenvironmentalconstraintsinwhichthe modeliscreatedmustbemaintained.Andbyusingthis model, the study is limited to detecting the urban flood susceptibilityzonesusingRandomForestmethod.
The satellite data, rainfall data, Digital Elevation Model, Flood inventory map, and Study area map collected for thisstudyarediscussedbelowindetail.
The satellite data of the study area dated 12/01/2022 was downloaded from USGS earth explorer. Landsat OLI/TIRS image was downloaded. It consists of 11 bands and the spatial resolution for the bands is 30m for multispectral, 15m for panchromatic and 100m for Thermal Infra Red bands and radiometric resolution is 16bits.
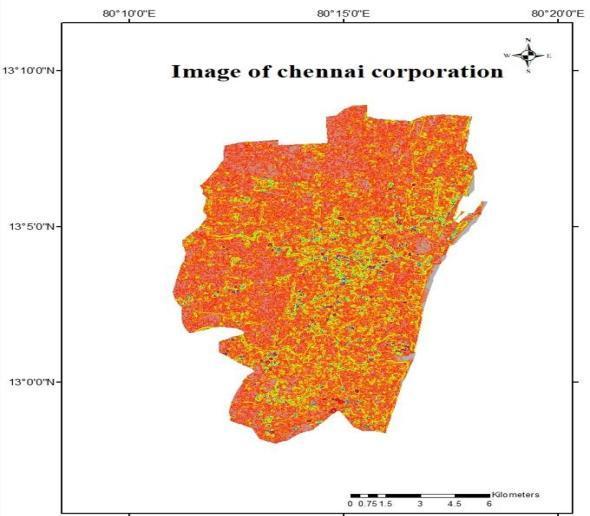
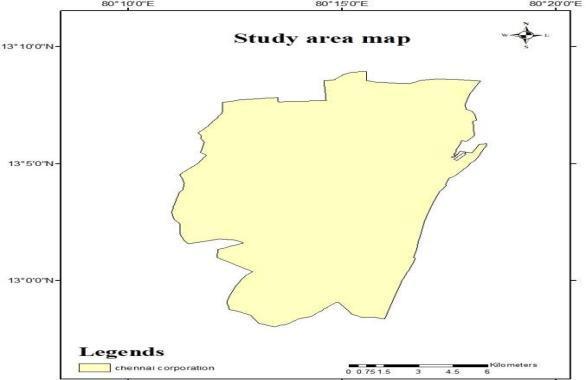
Study Area Map: Chennai Corporation is located in the north-eastern part of Tamil Nadu on the south-eastern coastofIndiaandisconfinedwithalatitudeof12⁰50'to 13⁰15'Nandlongitudeof80°50'to80°20'E.Itencloses an area of 176 sq. km and accounts for a high population densityof17,000persquarekilometer. The region was occupied by recently constructed urban infrastructure to the tune of 60%. Lithologically, the inland region is made up of river sediments and charnockite,whereasthecoastlinesectionismadeupof marine sediments. The research area gets cyclonic and depression-related severe rainfall that regularly causes floods.Themapofthestudyareaisdigitalisedfromthe onlinemapinArc-GISandthisshapefileisthenusedto clipthesatelliteimage.
Fig. 3. Boundary map of the study area
International Research Journal of Engineering and Technology (IRJET) e-ISSN:2395-0056
Volume: 09 Issue: 10 | Oct 2022 www.irjet.net p-ISSN:2395-0072
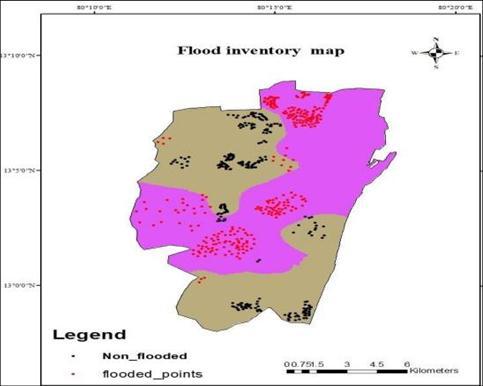
Flood Inventory Map: The flood inventory map is the historical database of flood-prone regions, compiled from previous documents. This sort of map is very helpfulinforecastingpossiblefloods.Sinceitsprecision dependsconsiderablyonthetemporalandspatialscale offloodreporting. Forthisanalysis,thefloodinventory map was constructed using 300 flood points and 300 non-flood points in the region, derived from flood statistics data of 2015 & 2021 Which is obtained from Bhuvan.Byassigninga valueof0tothe non-floodsites and a value of 1 to flood sites, it can generate binary training & testing datasets. Randomly 85% of the data collection was chosen to operate the model and the remaining 15% of the data was used for model validation.
1 Landsat8 (OLI/TIRS) Spatial resolution Band(1to7)=30m Band8=15m Band9=30m Band10,11=100m
Spectral resolution Band1–(0.43–0.45)
Band2–(0.45–0.51)
Band3–(0.53–0.59)
Band4–(0.64–0.67)
Band5–(0.85–0.88)
Band6–(1.571.65)
Band7–(2.11–2.29) Band8–(0.5–0.6) Band9–(1.36–1.38) Band10–(10.6–11.9) Band11–(11.5-12.51) Radiometric resolution 16bits
NASA (USGS)
Digital Elevation Model: Topographic factors are important for modelling flood studies, which will directly and indirectly influence the hydrological characteristics of the study area. At first, a Digital Elevation Model (DEM) was prepared from the JAXA DEM with 30m spatial resolution for the study area in the ArcGIS environment. The topographic factors are derived from DEM, such as slope, elevation, aspect, topographic wetness index (TWI), and stream power index(SPI)inArcGIS.
2 Studyarea map Chennaicorporation ArcGIS onlinemap
3 Digital Elevation Model
4 Flood inventory map
Spatialresolution=30m JAXA
Pastflooddata Bhuvan
5 Rainfall data Averageannualrainfall IMD
Rainfall is considered to be one of the most influencing factors. Heavy rainfall is responsible for increasing the underground hydrostatic level and water pressure. In addition, heavy rainfall from the upstream point in a shorter period generally has a high potential for maximum flood events. Areas having high average annual rainfall are assumed to have a high risk of flooding. For this study, Rainfall data for a period of 30 years (1992 – 2021) of the study area from five rain gauge stations have been collected from Indian Meteorological Department (IMD). A rain gauge (also known as udometer, pluviometer, barometer, and hyetometer) is an instrument used by meteorologists and hydrologists to gather and measure the amount of liquid precipitation over an area in a predefined area, over a period of time. It is used for determining the depth of precipitation (usually in mm) that occurs over aunitareaandthusmeasuringrainfallamount.
International Research Journal of Engineering and Technology (IRJET) e-ISSN:2395-0056
Volume: 09 Issue: 10 | Oct 2022 www.irjet.net p-ISSN:2395-0072
Software:MicrosoftExcel,JupyterNotebook,andArcGIS were the applications used in this investigation. A geographic information system (GIS) for using maps and geographic data is called ArcGIS. It is utilised for a variety of tasks, including the creation and usage of maps,thegatheringandanalysisofgeographicdata,the sharing and discovery of geographic information, the use of maps and geographic data in a variety of applications,andthemanagementofgeographicdatain databases. RF machine learning model is applied in Jupyter notebooks, and the output from this model is utilised to create maps showing how susceptible cities aretoflooding.
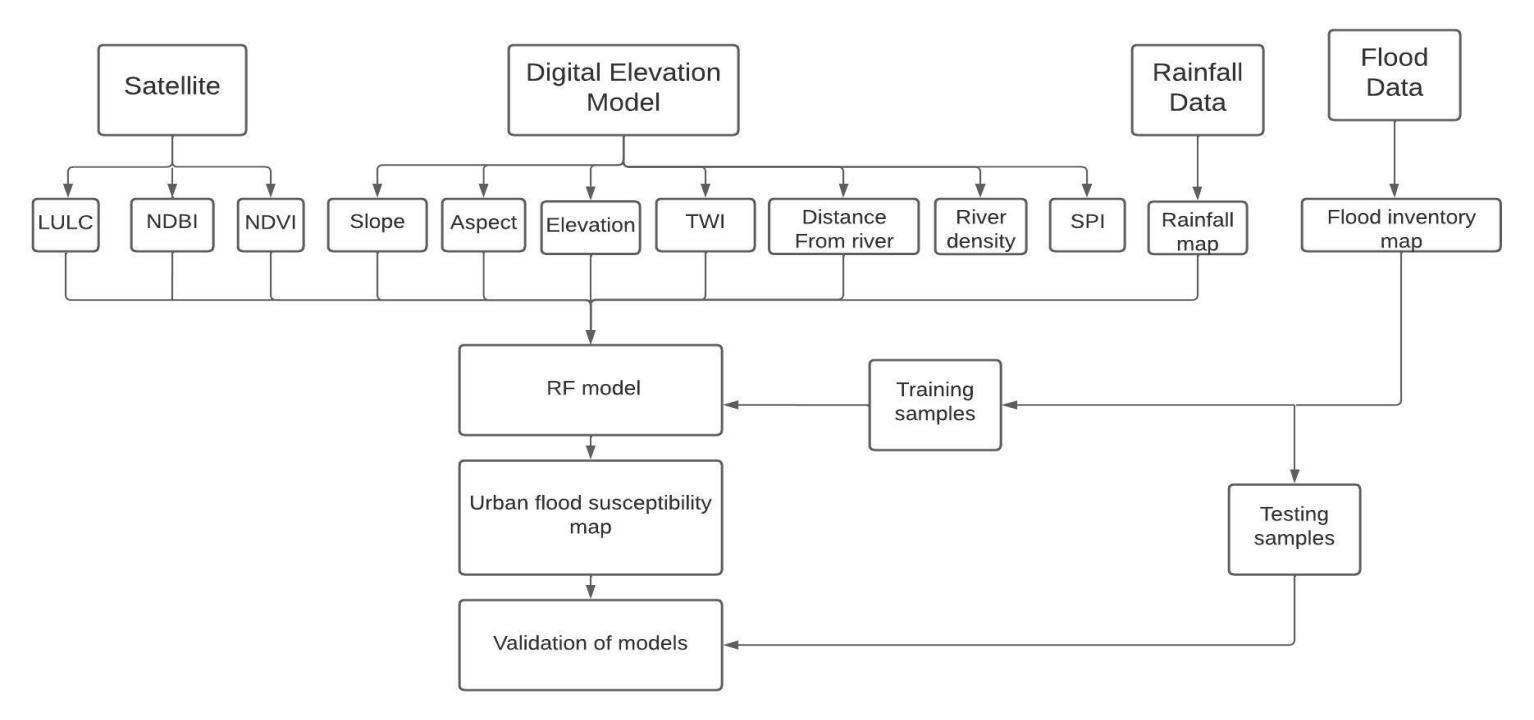
The study area experiences heavy rainfall associated withdepressionsandcycloneswhichleadtofrequently occurring floods. In the present study, flood susceptibility analysis was performed using GIS along with machine learning using Random Forest models. Flood is a dynamic natural hazard that is caused by many natural and anthropogenic impacts. Thus, it is
very important to consider the application of machine learning techniques to provide a complete overview of the flood susceptibility of a study area. The description of the theoretical background of each model and also themannerinwhichthismodelwasappliedtoevaluate flood susceptibility is presented below. The different data required for this study have been collected and several flood conditioning factors are also considered for the flood susceptibility mapping of the study area. Thedetailedmethodologyofthestudyisshownbelow.
The selection of the urban flood conditioning factors varies from one study area to another. Eleven flood susceptibility factors for the flood susceptibility modellingintheareawerechosen.Theseareelevation, slope, rainfall, aspect, NDVI, NDBI, LULC, drainage density, river proximity, Topographic Wetness Index, and Stream Power Index. These variables are essential in determining and delineating flood-prone regions. These factors were then transformed into the raster format.
Elevation: For determining flood susceptibility of a region,elevationwasidentifiedasoneofthesignificant factors. In comparison, lower altitudes are more commonly linked with areas’ susceptibility to floods. The susceptibility and severity of floods are inversely linked to the height. It is therefore suggested that the areas that are strongly linked with very low elevation can undergo more extreme flooding than areas at a higher elevation. For this analysis, an elevation map with a spatial resolution of 30 m was prepared from JAXA DEM. The elevation values of the Chennai corporationrangefrom-40mto64m.
Aspect: Aspect is significant in predicting flood susceptibilityoftheregion.Thisisthehighestdirection down the slope. For this analysis, the aspect map was built using Arc GIS tools from the Digital Elevation Model.
e-ISSN:2395-0056
Volume: 09 Issue: 10 | Oct 2022 www.irjet.net p-ISSN:2395-0072
Aspect (in degrees) Label
-1-0 Flat 0–22.5 North 22.5–67.5 NorthEast 67.5-112 East 112–157.5 SouthEast 157.5–202.5 South 202.5–247.5 SouthWest 247.5–292.5 West 292.5–337.5 NorthWest 337.5–359.9 North
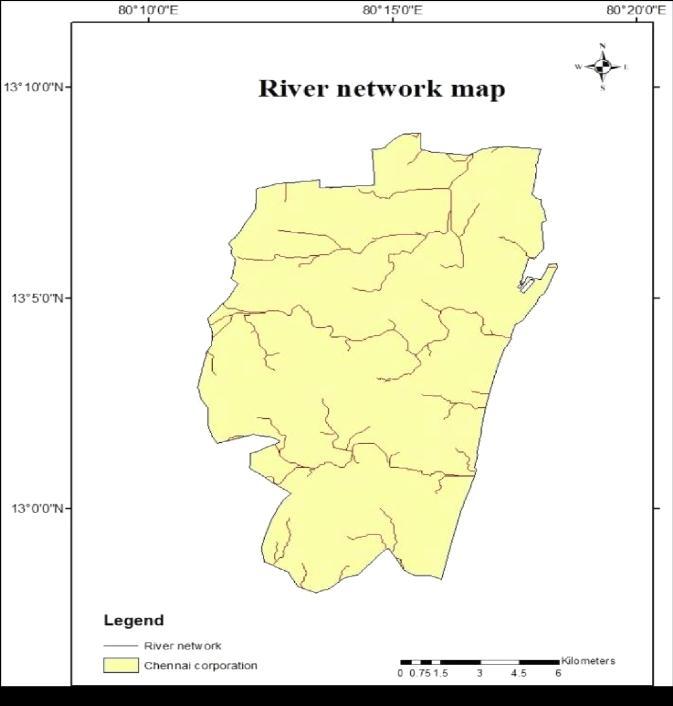
River proximity: Distance from River is a significant parameter for assessing flood susceptibility. Stream flow increases because of heavy and stormy runoff in a drainage system and as it reaches stream capacity limits,itwilltransformintoaflood.
Therefore, closer to the river, the susceptibility to floodingbecomesmoreandmoredistantfromtheriver, andthesusceptibilitytofloodingbecomesless.Distance from river or river proximity map was prepared using theEuclideandistancetoolinArcGIS.
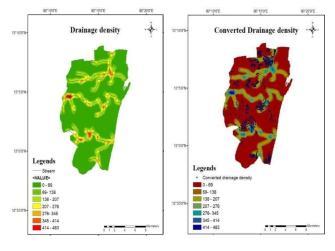
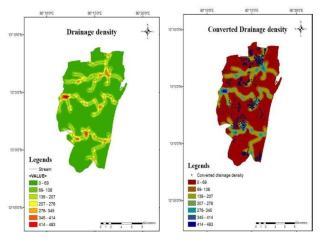
Drainage density: The drainage density is determined bythedrainagelengthper unitarea.Concentratedflow occursduringtherunoffinadrainagesystem,andthen
StreamPower Index (SPI): SPIisdefinedasthe erosive potential and surface runoff rate. The higher the SPI displays the higher surface runoff capacity and lower the SPI describes the lower surface runoff rate. Throughout this way, heavy rainfall in the lower SPI region will contribute to the flooding. Throughout this analysis,thefollowingequation(1)wascalculatedusing DEMintheArcGIS.
SPI=����∗tan�� (1)
Where ���� represents the specific catchment area in squaremetersand��representstheslopeindegrees.
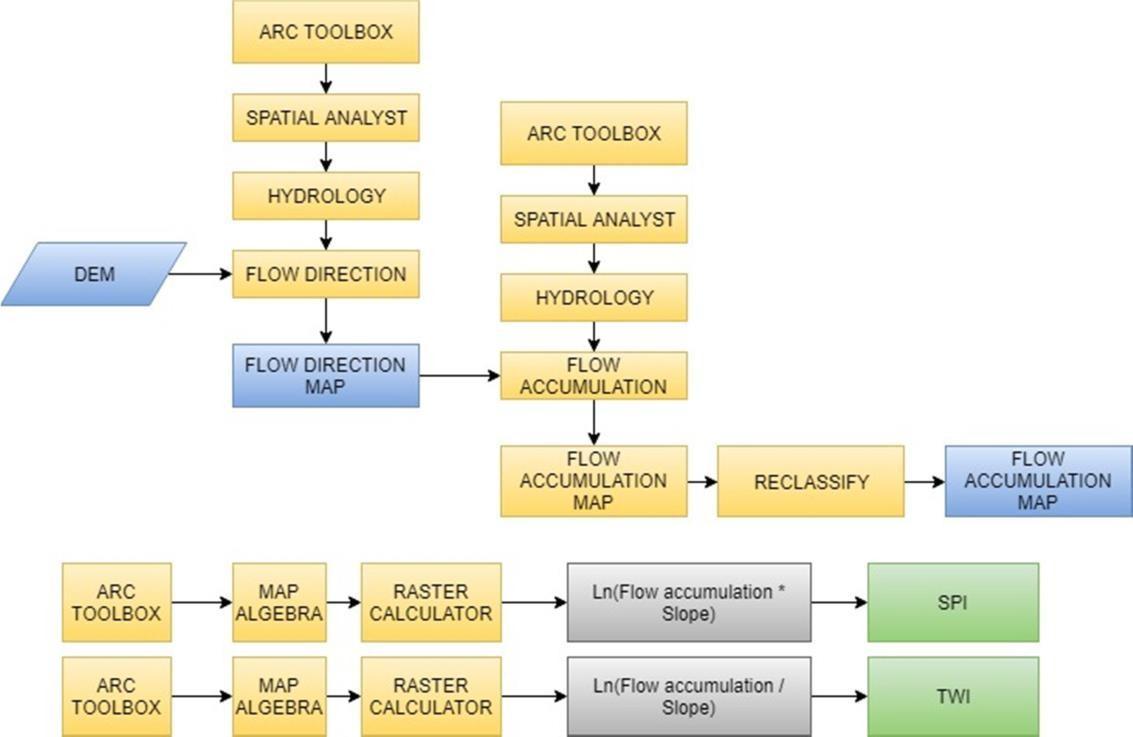
Topographic Wetness Index: Topographic Wetness Index(TWI) isa significant parameterusedto estimate a region's susceptibility to flooding. TWI closely regulates spatial spreading and depletion of surface runoff.TheFlowDirectionToolfromHydrologysection of Spatial Analyst toolbox is used to create a flow direction. This assigns a value for each pixel based on the direction in which water flows along the slope in that pixel considered. This ultimately determines the
where the channelized flow exceeds the channel potential and the surplus water discharges into the surrounding region which causes the region to flood. A drainage density map is prepared by using line density toolinArcG
destination of water flowing across the land. DEM is givenasaninputtothetoolandaflowdirectionmapis created. Similarly, in the Hydrology section, the Flow accumulationtoolisusedtocreateaflowaccumulation map. The Flow Accumulation tool calculates the flow intoeachcellbyidentifyingtheupstreamcellsthatflow into each downslope cell. In other words, each cell’s flow accumulation value is determined by the number of upstream cells flowing into it based on landscape topography. The flow accumulation map is then reclassified. This flow accumulation layer is considered as the upstream contributing area. Now TWI is calculatedusingthefollowingcomputationalformulain the Raster calculator tool in the map algebra toolbox. The TWI was determined from the DEM in the GIS environment in this research work and is represented inthefollowingequation(2).
TWI=ln(As/tan(��)) (2)
Where, As represents the specific catchment area, the slope is in degree. Many studies show that TWI and flood susceptibility are positively correlated to each other.
2022, IRJET | Impact Factor value: 7.529 | ISO 9001:2008 Certified Journal | Page549
International Research Journal of Engineering and Technology (IRJET) e-ISSN:2395-0056
Volume: 09 Issue: 10 | Oct 2022 www.irjet.net p-ISSN:2395-0072
Fig. 7. Flowchart for creation of SPI& TWI
Land Use and Land Cover (LULC): In this study, LULC classification is done by the maximum likelihood supervised classification method in Arc GIS. In supervised classification, pixel classification is done and training samples corresponding to each class are taken bycomparingwiththegooglemapimage.Consideration was given to four types of land use and land cover in which 495 training pixel samples were taken for a waterbody,672 for vegetation,586 forthebuilt-uparea and715forbarrenland,andarereclassifiedandlabelled asgivenbelow.
Rainfall: One of the main determining elements of the floodisrainfall.Thehydrostaticlevelandwaterpressure undergroundriseasaresultofheavyrainfall.Areaswith high yearly rainfall averages are thought to have a significantriskofflooding.Theaverageannualrainfallof 5 rain gauge stations is determined to prepare the rainfall distribution map for this study. The data is then imported into ArcGIS as a point feature, and the spatial interpolation is carried out using an inverse distance weightedtool.
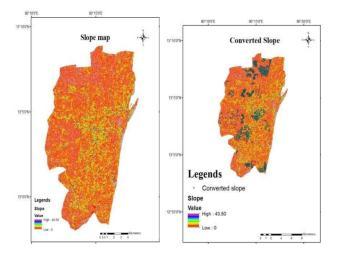
Slope: The magnitude and intensity of water accumulation and water percolation are defined by the slopeoftheregion.Itindicatessteepnessateachcellofa raster surface. This adversely affects the storm too. The lower slope indicates Flat terrain and a higher slope indicates steep terrain. The inclination of the slope is calculated in degrees. In this analysis, the slope map in
Normalized Difference Vegetation Index (NDVI): The NDVI is one of the extensively used factors for determining flood susceptibility. It indicates the vegetative cover of the region. Areas having lower or decreasing NDVI values (0.1 or below) denote nonvegetated features such as barren land, snow cover, sand, etc. Moderate values represent shrub and grassland (0.2 to 0.3) while high values indicate forests (0.6 to 0.8). NDVI was calculated by raster calculator in ArcGIS. The NDVI index for the study area is calculated using equation (3) using bands 4 and 5. The NDVI value normallyrangesfrom-1to+1.
NDVI=(NIR–RED)/(NIR+RED) (3)
Normalized Difference Built-up Index (NDBI): The NDBI is used to analyse the built-up areas. It uses the SWIR andNIRbandstoanalyzethebuiltupareas.
International Research Journal of Engineering and Technology (IRJET) e-ISSN:2395-0056
Volume: 09 Issue: 10 | Oct 2022 www.irjet.net p-ISSN:2395-0072
NDBI=(SWIR-NIR)/(SWIR+NIR) (4) Itsvaluegenerallyrangesfrom-1to+1.
The thematic maps of the eleven flood susceptibility factors such as slope, elevation, aspect, rainfall, Stream PowerIndex,TopographicWetnessIndex,LanduseLand cover, Distance to the river, Drainage density, NDBI, NDVIwaspreparedusingthetoolsinArcGIS.Thevalues of the points of each factor corresponding to points in the flood inventory map were taken using the extract values to points tool in Arc GIS. These values were collected in excel format and have been given input to RandomForestModel
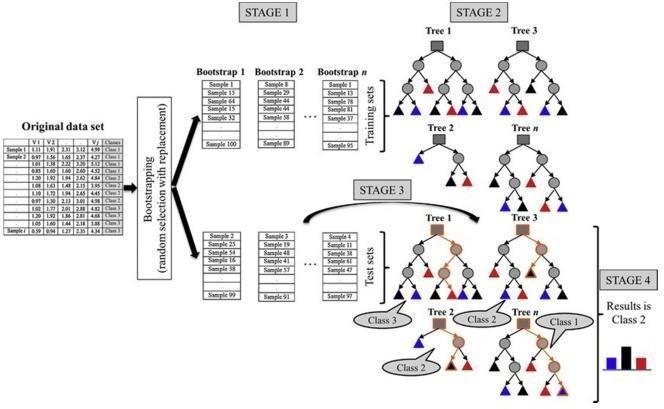
RF,ahighlyeffectivecombinationoftreepredictors,was systematically proposed by Breiman in 2001. Random Forest is a supervised learning algorithm. Random Forestsarea combinationoftreepredictorswhere each tree depends on the values of a random vector sampled independentlywiththesamedistributionforalltreesin the forest. Random Forests grows many classification trees.Eachtreeisgrownasfollows:
1. Randomly select “k” features (parameters; here hazardinducingindices)fromtotal“m”features. Wherek<m
2. Among the “k” features, calculate the node “d” using thebestsplitpoint.
3.Splitthenodeintodaughternodesusingthebestsplit.
4.Repeat1to3stepsuntil“l”numberofnodeshasbeen reached.
5.Buildaforestbyrepeatingsteps1to4for“n”number timestocreate“n”numberoftrees.
Once the trees are created the model can be used in prediction of results. To perform prediction using the trained random forest, the algorithm uses the below pseudocode.
1. Takes the test features and uses the rules of each randomly created decision tree to predict the outcome andstoresthepredictedoutcome(target)
2.Calculatethevotesforeachpredictedtarget.
3.Considerthehighlyvotedpredictedtarget asthefinal predictionfromtherandomforestalgorithm. Thisconceptofvotingisknownasmajorityvoting(Abdu et al., 2021). Thus, here if a pixel is analysed, the class (flooded and non flooded) which acquires the greater numberofvotesisassignedtothatpixel.
Fig. 8. Classification in Random Forest model
International Research Journal of Engineering and Technology (IRJET) e-ISSN:2395-0056
Volume: 09 Issue: 10 | Oct 2022 www.irjet.net p-ISSN:2395-0072
The algorithm is written in python language. The data from seven raster layers and the training data are provided to the algorithm. Additionally, the number of trees to be created and the depth up to which the pruning is to be done is also given to the programme. Thedepthoftreeswaskeptconstantand thenumberof treeswasvariedandaccuracywascheckedforeachcase to get an optimum number of trees for the model. Similarly, the optimum number of trees was taken constant and the depth was varied and accuracy was checked to get an optimum depth level (Gang et al., 2021). Once the training and testing samples are providedtheaccuracybetweentrainedandtestedvalues ischecked.Iftheaccuracyissatisfiedtheentiredata set of whole study area is given as input. The model classifies each pixel to any of the three classes and the output is stored in .csv format. This output .csv file was added to ArcGIS software and was plotted as a raster layer.Thisgivestheurbanfloodsusceptibilitymapofthe studyarea.Togetasmoothandcontinuousraster,these points are interpolated using IDW interpolation tool in Spatial Analyst toolbox. Validation of the model is done byusingconfusionmatrix.
5.1 THEMATIC MAP: Thematic Maps were prepared using ArcGIS. Thematic Maps of NDVI, NDBI, Rainfall, Slope, Elevation, Aspect, Topographic Wetness Index, Stream Power Index, Land Use Land Cover, Drainage DensityandRiverProximitywereshownbelow.
NDVI map: The NDVI map was prepared using the equation (3) and the map corresponding to the flood inventorymaphasalsoprepared.
NDBI map: The Normalised Differential Built-up Index mapwaspreparedusingtheequation(4).
Fig. 10. (a) NDBI map (b) Converted NDBI map
Rainfall map: The Rainfall map was prepared using an inversedistanceweightedtoolinArcGIS.

Fig. 9. NDVI map & Converted NDVI map
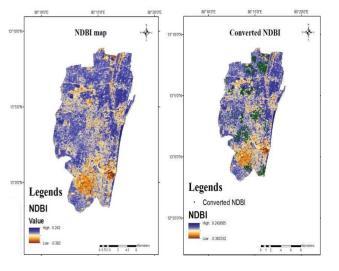
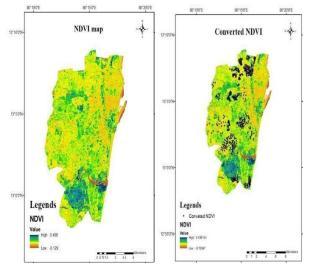
Fig. 11. (a) Rainfall map (b) Converted Rainfall map
Slope map: The Slope map was prepared using the inversedistanceweightedtoolinArcGIS.
International Research Journal of Engineering and Technology (IRJET) e-ISSN:2395-0056
Volume: 09 Issue: 10 | Oct 2022 www.irjet.net p-ISSN:2395-0072
Topographic Wetness Index map: Topographic Wetness Indexmapwaspreparedusingequation(2).
Fig. 12. (a)Slope map (b)Converted slope map
Elevation map: The elevation map is prepared from the DigitalElevationModel.
Fig. 15. (a) TWI map (b) Converted TWI map
Stream Power Index map: Stream Power Index can be calculatedusingtheequation(1).
Fig. 13. (a) Elevation map (b) Converted elevation
Aspectmap:TheAspectmapwaspreparedinArcGIS.
Fig. 16. (a) Stream Power Index map (b) Converted SPI map
LULC:
Land cover map: The LULC map was prepared using supervisedclassificationinArcGIS
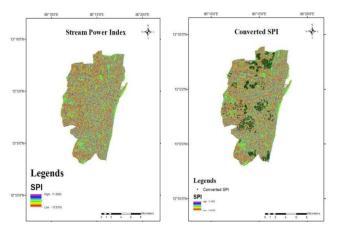
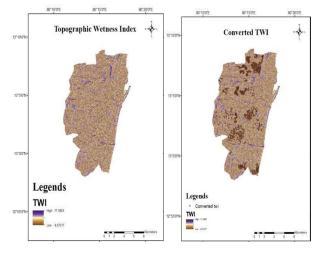
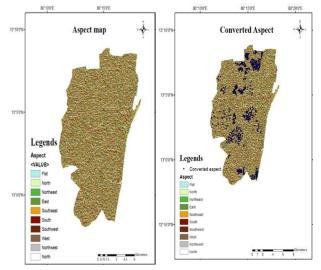
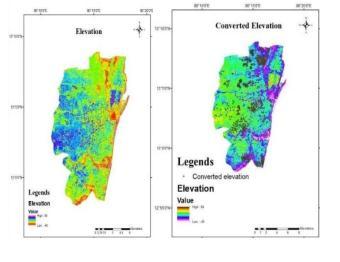
Fig.14. (a) Aspect map (b) Converted Aspect map
International Research Journal of Engineering and Technology (IRJET) e-ISSN:2395-0056
Volume: 09 Issue: 10 | Oct 2022 www.irjet.net p-ISSN:2395-0072
proximity map.
Fromthis analysis done onthe studyarea, many results were obtained and are discussed here. The maps generated in Arc GIS were used to study the geological and hydrological factors and their spatial distribution over the Chennai corporation has been discussed in detail. Also, the prediction made by the Random Forest model and the final susceptibility map obtained is discussed.
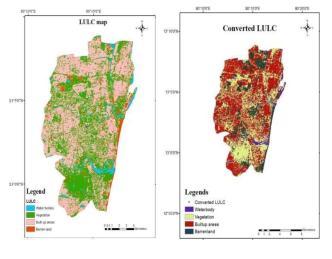
Fig.4.9 (a) LULC map (b) Converted LULC map
Drainagedensitymap:
Fig. 18. (a) Drainage density map (b) Converted Drainage density map.
Riverproximitymap:
Fig. 19. (a) River proximity map (b) Converted river
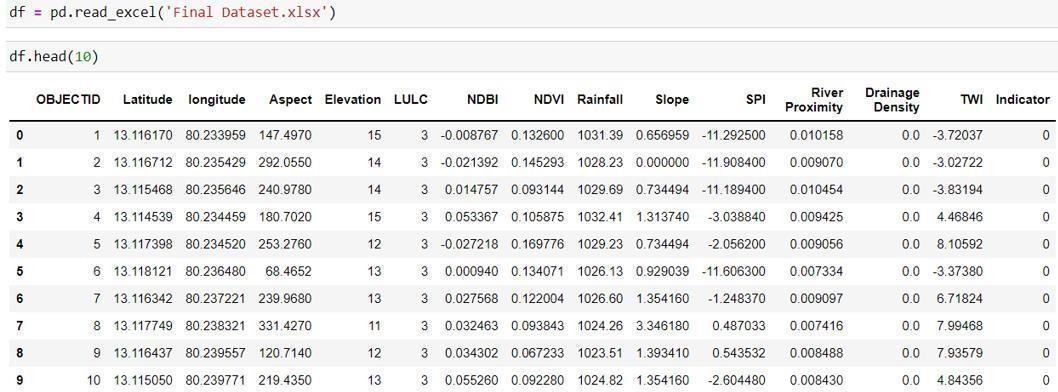
Preparation and analysis of data sets: Different raster maps were created for all indices which are considered to be flood inducing and were analysed to obtain the following output map with spatial distribution and intensityvariationacrosstheChennaicorporation.
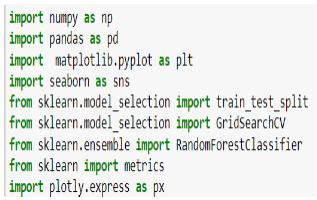
The algorithm is written in python language. The above mentioned are the necessary libraries which are imported for the data analysis. Pandas and numpy are necessary for reading the dataset and matplotlib and seaborn are used for data visualisation and plotting and others are necessary machine learning libraries. The entire data set has been converted into excel format to give input to the Random Forest model. These data comprise of 600 datasets of flood conditioning factors andtheFlooded(1)andnon-flooded(0)points
International Research Journal of Engineering and Technology (IRJET) e-ISSN:2395-0056
Volume: 09 Issue: 10 | Oct 2022 www.irjet.net p-ISSN:2395-0072
The entire data set has been labelled into X and Y in whichXindicatesthevaluesoffloodcausing factorsand Yindicatesthevaluesoffloodand nonfloodpoints. And 85% of the entire data set is classified into training and 15% into the testing phase. The data set has been fed into the model for training and testing in which x train and x test indicatethefloodcausative factorsand ytrain andytestindicatetheindicatorvalues.
Fig. 22. Splitting of the dataset in the RF model
pred. The obtained y pred variables have been comparedwiththey_testvaluestochecktheaccuracyof prediction.
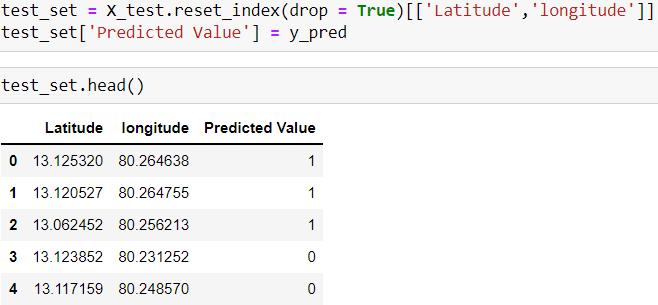
After the data set has been splitted for training and testing. The model has been trained by giving x train as input and y train as output, that is the flood causative factors and the indicator values and during the testing phasethepredictionisdonebygivingtheinputasxtest variables only and indicator values are obtained as output by the mode
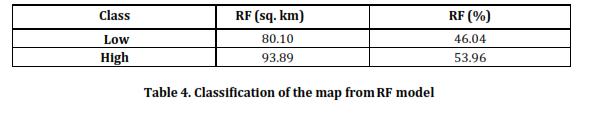
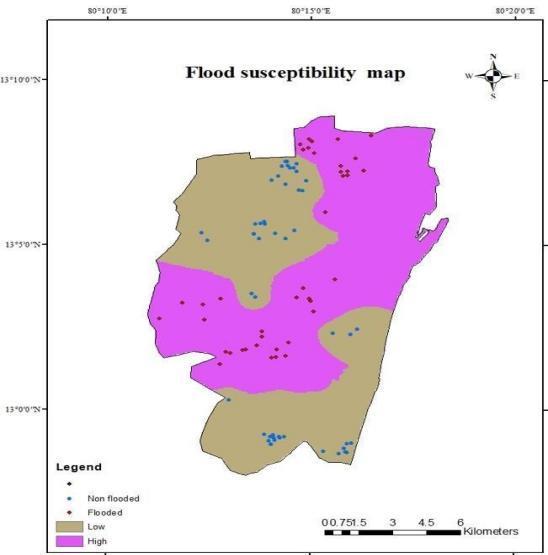
The final urban flood susceptibility map of Chennai corporation has been prepared using Random Forest machine learning model. The predicted output obtained from the Random Forest model is fed into the Arc GIS and has been interpolated using the Inverse Distance Weighted tool and is classified into two zones low (46.04%)andhighsusceptibilityzones(53.96%).
International Research Journal of Engineering and Technology (IRJET) e-ISSN:2395-0056
Volume: 09 Issue: 10 | Oct 2022 www.irjet.net p-ISSN:2395-0072
Here 51 times modelpredicted 0 (nonflooded) when actualvalues are 0. Then 4times model predicted 0 when the actual value is 1(flooded). 0 times model predicted 1 when actual values are 0. 35 times the modelpredicted1whenactualvalues are 1. Diagonal elements show the correctlyclassified points or pixels whereas non-diagonal elements show incorrectly classifiedpixelsorpoints.So,the accuracy of the model can be calculated by the sumof diagonal elements to the sum of diagonal and nondiagonalelements.
Accuracy=(TP+TN/TP+TN+FP+FN) =(51+35/51+4+0+35) =0.955
Model validation is a significant part of evaluating the model or its application accuracy. For this, confusion matrix is taken as the best method for validation or determiningaccuracyofthemodel.Aconfusionmatrixis a table which is used to define the performance of the classification algorithm. The confusion matrix is defined by its four basic characteristics. That is True Positive (TP), True Negative (TN), False Positive (FP), and False Negative(FN).TPdefinesthenumberofpixelsorpoints whichhavebeencorrectlyclassifiedasnonfloodpoints. TN defines the number of pixels or points which have beencorrectlyclassifiedasfloodedpoints.FPdefinesthe number of misclassified pixels or points with flood but are actually non flooded. FN represents the number of misclassified pixels or points with non flooded but is actuallyflooded.Theconfusionmatrixwithactualvalues onxaxisandpredictedvaluesonyaxisarepresentedin atabularformatbelow.
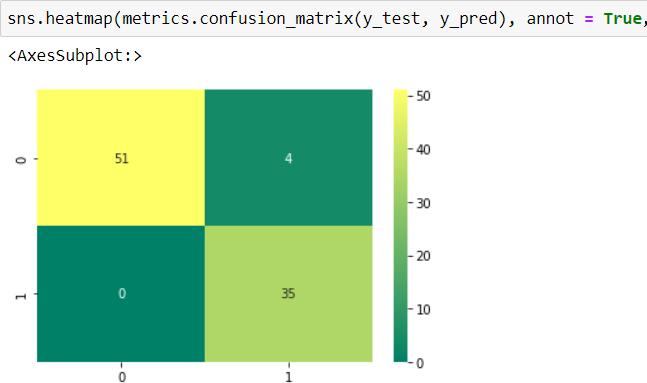
Theaccuracyobtainedasaresultofclassificationby the novelRandomForest(RF)machinelearningalgorithmis 0.955(95%).
The urban flood susceptibility map has been classified intolowandhighsusceptibleregions.Themethodusing the Random Forest model produced the best outcomes. The prediction accuracy is 0.955 (95.5%) for the Random Forest model. The findings of this analysis will assist decision- makers in carrying out effective flood management in the future. There are also many other important factors that regulate flood susceptibilities such as the influence of dams and other hydraulic structures which regulates the flood and were not consideredinthisstudy.Also,parameterssuchasspatial variation of typhoon frequency, soil texture, etc. can be incorporatedinfurtherstudies.
1. Abdu R M, Swapan T, and Sushanta M, 2021, ‘Flood susceptibility modelling using advanced ensemble machine learning models, International Journal of Geosciencefrontiers,Elsevier,12,pp.10105.
2. Chukwuma E, and Okonkwo C, 2020, ‘A GIS based flood vulnerability modelling of Anambra State using an integrated IVFRN-DEMATEL-ANP model’, Journal of HydraulicsandWaterResourcesEngineering,Heliyon,6, pp.9.
3. Gang, Z, Bo P and Zongxue X, 2021, ‘Assessment of urban flood susceptibility using semi-supervised machine learning model’, Journal of Science of environment,Elsevier,659,pp.940–949.
4.HamidD,AliTandOmidR,2021,‘Ahybridizedmodel based on neural network and swarm intelligence-grey wolf algorithm for spatial prediction of urban flood inundation’, Journal of Hydrology, Elsevier, 603, pp.126854.
International Research Journal of Engineering and Technology (IRJET) e-ISSN:2395-0056
Volume: 09 Issue: 10 | Oct 2022 www.irjet.net p-ISSN:2395-0072
5. Sadhan M., Subodh C P, and Indrajith J, 2020, ‘Prediction of highly flood prone areas by GIS based heuristic and statistical model in a monsoon dominated region of Bengal Basin’, Society and Environment, Elsevier,19,pp.100343.
6.YichenZY,HuiL,RuishanCandZhenhuanL,2020,‘A GIS-BasedApproachforFloodRiskZoningbyCombining Social Vulnerability and Flood Susceptibility: A Case Study of Nanjing, China’, Environmental Research and PublicHealth,MDPI,8,pp.134.
7. Zening W, Yanxia S, Huiliang W, and Meimei W, 2019, ‘Assessing urban flood disaster risk using Bayesian network model and GIS applications’, Journal of Geomatics,Naturalhazardsandrisk,TaylorandFrancis, 216,pp.2163-2184.
8.ZhaoliW,ChengguangL,andXiaohongC,2015,‘Flood hazard risk assessment model based on random forest’, JournalofHydrology,Elsevier,527,pp.1130–1.