International Research Journal of Engineering and Technology (IRJET) e-ISSN: 2395-0056

Volume: 09 Issue: 10 | Oct 2022 www.irjet.net p-ISSN: 2395-0072
International Research Journal of Engineering and Technology (IRJET) e-ISSN: 2395-0056
Volume: 09 Issue: 10 | Oct 2022 www.irjet.net p-ISSN: 2395-0072
1PG Scholar, Department of Civil Engineering, Bapuji Institute of Engineering and Technology, Davanager-577004, Karnataka, India
2Professor and Head, Department of Civil Engineering, Bapuji Institute of Engineering and Technology, Davanager-577004, Karnataka, India ***
Abstract - The aim of this work is to estimate the impact on soil variability’s by the use of treated liquid waste in irrigation. A study looked into the advantageous effects of treated sewage water on soil characteristics. The soil's N, P, K, OC, and pH were measured after the application of treated sewage water during the crop's 10-, 15-, and 20-day growth periods. The chemical composition and fertility condition of soil were enhanced when treated sewage water was used for irrigation. The proportion of soil organic carbon, soil electrical conductivity, and soil macronutrient content are all greatly increased when treated sewage water is applied to the ground (N, P). Growing crops in sewage results in higher agricultural yields and enhanced soil fertility. A good way to reduce the rising demand for fresh water is through sewage farming.
Key Words: Domestic sewage, soil variability’s, nutrients, irrigation liquid waste variables.
The demand for water is continuously increasing in most of the irrigated and agricultural dependent cities. Therefore, water of more quality is stored for drinking, while that of lower quality is suggested for irrigation. Domestic liquid waste is less expensive and reflected an attractive source of irrigation water current day. Therefore, the attention in reusing liquid waste for irrigation is rapidly increasing in most states. In addition liquid waste is a respected source for floral nutrients and organic substance needed for keeping fertility and production in arid soils. Domestic liquid waste contains required floral nutrients such as N, P, K and micronutrientswhicharevaluablefor floral growth. Theaim of this work was to appraise the changes in soil variability’s afterdischargingdomesticliquidwasteintothesoil
An experimental appraisal was conducted for to estimate the impact of usage of domestic liquid waste on soil. For this purpose agricultural soil was chosen from Davangere
near Avaragolla village. Then estimated the soil variability’s like N, P, K and pH before usage of liquid wasteasperstandardprocedurerecommendedbyAPHA.
The sewage waste-water was collected near Avaragolla village and kitchen liquid waste was collected from BIET BoysHostel(BIET).
DischargetheseSewageandKitchenliquidwastesample intothesoilindividually.After10days,15days,20daysof usage of liquid waste soil variability’s N, P, K, and pH, of soil sample containing sewage waste-water and kitchen liquidwastewasestimatedasperstandardmethod(APHA 20thaddition)
The sewage sample and kitchen liquid waste sample wereanalyzedasgivenintable1.Thesewageandkitchen liquid waste samples exhibited almost medium range hydrogen iron content value (6.17 and 7.62), while the hydrogen content ground water sample is alkaline in reaction (7.12). The enlargement of pH is due addition of manysolublesaltsexistinginsewagesamples.Despitethe increase of 7.62 %, the pH value of STP-A was within the permissible limits in respect of its use in irrigation purpose. The salinity content/EC of the STP and KLW (310mS/m and 380 mS/m) is 42.83 % and 45.72% less thanthatofgroundwater(940mS/m).Themaximumsalt content,thegreatertheflowofelectricalcurrent,thetotal dissolved solid in STP-A and KLW-1 (275 mg/L and 282 mg/L) was found to be 14.52 and 15.66 % less than the GWS-1 (821mg/l). The BOD of the treated sewage and kitchen liquid waste (65 mg/L and 88 mg/l)was 82.5 and 91.3 % lesser than the BOD of GWS-1 (3 mg/l), the prescribedlimitofBODforirrigationis100mg/l.TheCOD ofSTP-1andKLW-1(120mg/land132mg/L)was82.56% and 89.51 % less than the COD of GWS-1 (10 mg/l). Maximum COD represents more amount of oxidizable organicmatterpresentintheSTP-1andKLW-1,whichwill decreaseDOincollectedsewagewater.CaandMgcontent
International Research Journal of Engineering and Technology (IRJET) e-ISSN: 2395-0056
inSTP-1andKLW-1was2.8mg/L,3.1mg/Land3.1mg/L, 4.2mg/L)correspondingly.Cl- contentinSTP-1andKLW1 samples showed 24 and 36 mg/L and in GWS1 is 68 mg/l.
Table 1: Initial Quantity of Variables in Sewage treatment plant sample
Sl. No. Variables STP-1 FAO-1970
1. pH 6.14 6.0-8.5 2. EC 310mS/m 0-3dS/m 3. TDS 276mg/L 0-2000meq/L 4. Ca2+ 2.8mg/L 0-20meq/L
5. Mg2+ 3.1mg/L 0-5meq/L
6. Cl- 24mg/L 0-30meq/L 7. Na+ 22mg/L 0-40meq/L 8. K+ 2.8mg/L9. SO42- 38mg/L 0-20meq/L 10. BOD 65mg/L11. COD 120mg/L12. OrganicCarbon -13. Nitrogen -14. Phosphorous -15. SAR 8.75 0-15meq/L
Table
Sl. No. Variables KLW-1 FAO-1970 1. pH 7.62 6.0-8.5 2. EC 380mS/m 0-3dS/m 3. TDS 282mg/L 0-2000meq/L 4. Ca2+ 3.1mg/L 0-20meq/L 5. Mg2+ 4.2mg/L 0-5meq/L 6. Cl- 36mg/L 0-30meq/L 7. Na+ 31mg/L 0-40meq/L 8. K+ 3.1mg/L9. SO42- 52mg/L 0-20meq/L 10. BOD 88mg/L11. COD 132mg/L12. OrganicCarbon -13. Nitrogen -14. Phosphorous -15. SAR 8.57 0-15meq/L
Sl. No. Variables GWS-1 FAO-1970
1. pH 7.12 6.0-8.5 2. EC 940mS/m 0-3dS/m 3. TDS 821mg/L 0-2000meq/L 4. Ca2+ 164mg/L 0-20meq/L 5. Mg2+ 24mg/L 0-5meq/L 6. Cl- 68mg/L 0-30meq/L 7. Na+ 8mg/L 0-40meq/L 8. K+ 2mg/L9. SO42- 6mg/L 0-20meq/L 10. BOD 3mg/L11. COD 10mg/L12. OrganicCarbon -13. Nitrogen -14. Phosphorous -15. SAR 12.19 0-15meq/L
Table 4: Initial Quantity of Variables in soil
Sl. No. Variables Soil FAO-1970
1. pH 7.42 6.0-8.5 2. EC 280mS/m 0-3dS/m 3. TDS - 0-2000meq/L 4. Ca2+ 1.96mg/Kg 0-20meq/L 5. Mg2+ 1.52mg/Kg 0-5meq/L 6. Cl- 61mg/kg 0-30meq/L 7. Na+ 92ppm 0-40meq/L 8. K+ 80mg/Kg9. SO42- 128mg/Kg 0-20meq/L 10. BOD -11. COD -12. OrganicCarbon 2.10%13. Nitrogen 6%14. Phosphorous 0.38mg/L15. SAR - 0-15meq/L
Effect of STP-1 and KLW-1 irrigation on soil properties
Initial variabilities of the soil were given in above tables The experimental soil was classified under the silty clay texture.Fractionofthesiltandclaywerefoundtobemore that was 46% and 36% correspondingly. The pH of the pre-sowing soil was found to be 7.42. Electrical conductivity of soil was 280 mS/m. The organic carbon
Volume: 09 Issue: 10 | Oct 2022 www.irjet.net p-ISSN: 2395-0072 © 2022, IRJET | Impact Factor value: 7.529 | ISO 9001:2008 Certified Journal | Page537
International Research Journal of Engineering and Technology (IRJET) e-ISSN: 2395-0056
Volume: 09 Issue: 10 | Oct 2022 www.irjet.net p-ISSN: 2395-0072
content in the experimental soil was 2.10 %The Nitrogen and phosphorus are primary macro-nutrients of the soil. InexperimentalsoiltheNandPwerefoundtobe6%and 0.38 mg/L and SRA value shown 8.75meq/L, 8.57meq/L and12.19meq/Lcorrespondingly.Theanalyticalvaluesof the soil properties appraised for the soil irrigated with STP-1, KLW-1 and GSW-1 samples were given in next tables
Table 5: Changes in variables of soil irrigated with STP-1 ,KLW-1 and GWS-1 during growth period at 10 days
Sl No Variables 10 days
STP-A KLW-1 GWS-1
1 pH 7.45 7.52 7.21
2 EC,mS/m 424.00 420.50 388.00
3 OC% 1.20 1.05 0.88
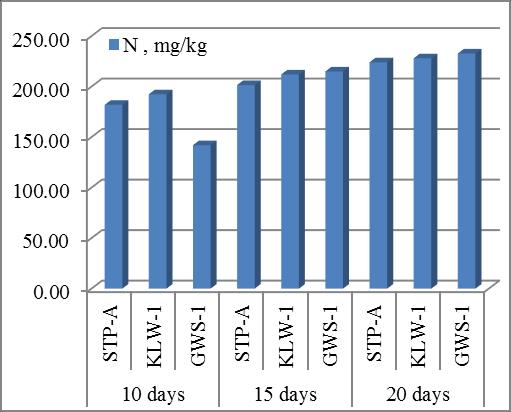
4 N,mg/kg 182.00 192.40 142.00
5 P,mg/kg 22.00 26.00 14.00
Table 6: Changes in variables of soil irrigated with STP-1 ,KLW-1 and GWS-1 during growth period at 15 days
Sl No Variables 15 days
STP-A KLW-1 GWS-1
1 pH 7.60 7.64 7.01
2 EC,mS/m 460.00 472.00 420.00
3 OC% 1.76 1.81 1.15
4 N,mg/kg 201.50 212.00 215.00
5 P,mg/kg 28.00 29.00 19.00
Table 7: Changes in variables of soil irrigated with STP-1 ,KLW-1 and GWS-1 during growth period at 20 days
Sl No Variables 15 days
STP-A KLW-1 GWS-1
1 pH 7.72 7.82 7.00
2 EC,mS/m 481.00 495.00 450.00
3 OC% 1.86 1.91 1.21
4 N,mg/kg 224.00 228.00 232.80
5 P,mg/kg 31.00 32.00 22.00
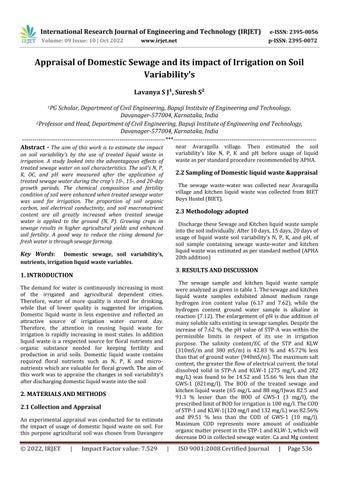
pH of soil irrigated with STP-1 and KLW1 samples was decreased from 7.45 (10 days) to 7.82 (20 days) which was greater than the pH of soil irrigated with GWS-1 during crop growth time. Irrigation with GWS-1 induces
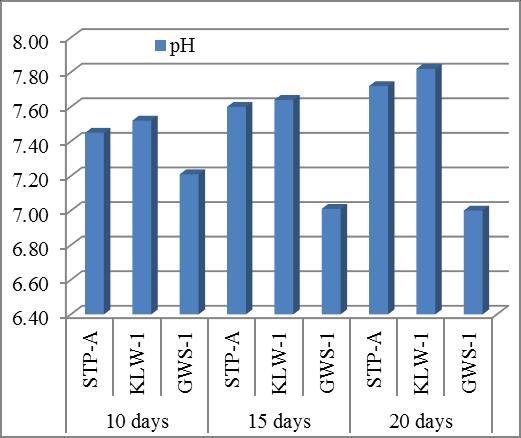
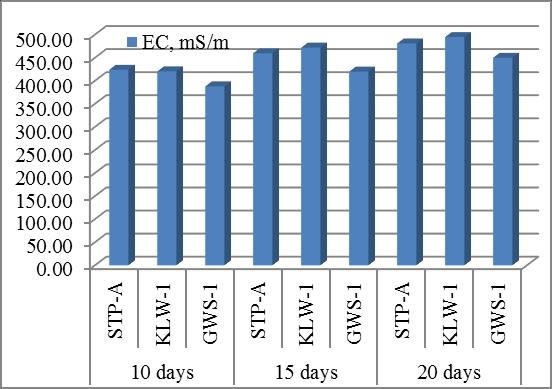
decrease of soil pH range from 7.21 (10 days) to 7.0 (20 days)(Chart1).ECofsoilirrigatedwithSTP-1and KLW1 samples was found to be 424 mS/m (10 days) to 472 mS/m (20 days) whereas in irrigation with GWS-1, it was noticed that 388 mS/m (10 days) to 450 mS/m (20 days) during crop growth time. Occurrence of salinity which is the most significant indicator respect to field irrigated withGSW-1(Chart2).Theorganiccarbonofsoilirrigated withSTP-1andKLW1sampleswasincreasedfrom1.20% (10days)to1.91%(20days)whereasOCofsoilirrigated with GWS-1 found to be 0.88 % (10 days) to 1.2 % (20 days) during crop growth time. Higher value of OC in soil irrigated with GWS-1 represents that STP-1 and KLW1 samples irrigation encourages to improve fertility condition of soil (Chart 3). Soil irrigated with STP-1 and KLW1samplescontrolledtoimproverequirednitrogenin soil which was increasingly more than the soil irrigated with STP-1 and KLW1 samples during crop growth time. Nitrogen content in soil irrigated with STP-1 and KLW1 samples was increased from 182 kg/ha (10 days) to 228 kg/ha (20 days) whereas in soil irrigated with GWS-1 it was found to be 142 kg/ha (10 days) to 232 kg/ha (20 days)duringcropgrowthtime.Thisindicatesthatthesoil irrigatedwithSTP-1andKLW1samplesprovidesessential macro-nutrient to the crop (Chart 4). Soil irrigated with STP-1 and KLW1 samples led to increase the Phosphorus content from 22 kg/ha (10 days) to 32 kg/ha (20 days) whereasinsoilirrigatedwithGWS-1itwasfoundtobe14 kg/ha(10days)to22kg/ha(20days)duringcropgrowth time. Hence, it was appraised that irrigation with STP-1 and KLW1 samples gave helpful nutrients content to the soil. Phosphorus is measured one from significant nutrientsthathasdirectoutcomeongrowthandefficiency offlora.
Chart-1: pH of soil irrigated with STP-1, KLW1 and GWS-1 samples during crop growth time at 10 days, 15 days and 20 days
2022, IRJET | Impact Factor value: 7.529 | ISO 9001:2008 Certified Journal | Page538
International Research Journal of Engineering and Technology (IRJET) e-ISSN: 2395-0056
Volume: 09 Issue: 10 | Oct 2022 www.irjet.net p-ISSN: 2395-0072
Chart- 2: Ec of soil irrigated with STP-1, KLW1 and GWS-1 samples during crop growth time at 10 days, 15 days and 20 days
The current analytical values are to compare the encouragesonsoilvariableswhensoilirrigatedwithSTP1, KLW1 and GWS-1 samples during crop growth period that is 10 days, 15 days and 20 days correspondingly. Fromthisappraisal itcanbereflectedthatirrigationwith STP-1,KLW1andGWS-1samplesarealsoprobablesource of floral nutrient. The result indicated that the soil variables are suggestively affected by the usage of STP-1 andKLW1samplesinirrigation.UsageofSTP-1andKLW1 samples increased the yield of crops as related to irrigationwithGWS-1.Thecurrentappraisalindicatesthat theSTP-1andKLW1samplescanbeusedasanalternative for irrigation, as Irrigation with STP-1 and KLW1 increased content of pH, EC, OC, P, N in soil irrigated by STP-1andKLW1watercomparedtotheGWS-1irrigation. Use of STP-1 and KLW1 has gain significance throughout theareaduetolackofavailabilityoffreshwatersources
The author is thankful to Guide, Principal, and management to give proper guidance & information related about research study and to provide the facilities requiredfortheprojectwork.
[1] Gurjar, O. P and Ramawatar Meena. 2017. Effects of sewage water irrigation compare to ground water irrigation on soil hysic-chemical properties. International journalofchemicalstudies,5(6),pp.265-267.
Chart- 3: OC of soil irrigated with STP-1, KLW1 and GWS-1 samples during crop growth time at 10 days, 15 days and 20 days
[2] Kiran D. Ladwani, Krishna D and Ladwani. 2012. Impact of domestic waste water irrigation on soil properties and crop yield. International journal of science andresearchpublications,2(10).
[3]MohammedA.AlghobarandLathamaniRamachandra. 2014. Effect of sewage water irrigation on soil properties and evaluation of accumulation of elements in grass crop in Mysore city, Karnataka, India. American journal of environmentprotection,3(5),pp.283-291.
[4] Antony raj, Sarvanan S and Manjula R. 2016. Effect of treated waste water irrigation on soil properties – A case studyatNITTrichy.Internationaljournalofearthsciences andengineeringDecember,09.
[5]Galavi,M.,Jalali,A.,Ramroodi,M.,Mousavi,S.R.,Galavi, H., 2010. Effects of treated municipal wastewater on soil chemical properties and heavy metal uptake by sorghum (SorghumbicolorL.).JAgrSci2(3):235–241.
Chart- 4: N of soil irrigated with STP-1, KLW1 and GWS-1 samples during crop growth time at 10 days, 15 days and 20 days
[6] Ghafoor, A., Rauf, A., Arif, M., Muzaffar, W., 1995. Chemicalcompositionofeffluentfromdifferentindustries oftheFaisalabadcity.Pak.J.Agric.Sci.,31:(4)367-369.
International Research Journal of Engineering and Technology (IRJET) e-ISSN: 2395-0056 Volume: 09 Issue: 10 | Oct 2022 www.irjet.net p-ISSN: 2395-0072
[7] Khaskhoussy, K., Hachicha, M., Kahlaoui, B., MessoudiNefzi, B., Rejeb, A., Jouzdan, O., Arselan, A., 2013. Effect of treated wastewateronSoil andCornCropintheTunisian Area.J.Appl.Sci.Res.,9(1):132-140.
[8] Rattan, R.K., Datta, S.P., Chhonkar, P.K., Suribabu, K., Singh, A.K., 2005. Long-term impact of irrigation with sewage effluents on heavy metal content in soils, crops andgroundwater acasestudy.Agric.Ecol.Environ.109: 310–322.
[9] Vikash Agrawal, Rajesh Bhagat, NiteshThikare. 2014. ImpactofDomesticSewageforIrrigationonPropertiesof Soil. International Journal of Research Studies in Science, EngineeringandTechnology1(5),pp.60-64
2022, IRJET | Impact Factor value: 7.529 | ISO 9001:2008 Certified