International Research Journal of Engineering and Technology (IRJET) e-ISSN:2395-0056
Volume: 09 Issue: 10 | Oct 2022 www.irjet.net p-ISSN:2395-0072
Seasonal Air Pollution Variation in Delhi (2019): A Case Study using by the Geo-spatial Technology
Swagata Das1, Priya MondaI2, Jayashree Mondal3 , Payel Das4 , Dr. Nayan Dey5
1,2,3,4 Department of Geography, Rabindra Bharati University, Kolkata 5Research Scholar, SoS in Geography, Pt R.S. University, Raipur (C.G.) ***
Abstract
Air Pollution is a mixture of solid particles in the air. The level of air Pollution is varying in every season according to weathering phenomena and human activities. This work has been on seasonal air Pollution in Delhi in 2019. The main aim of this study is to understand seasonal air Pollution variation in Delhi. Delhi is a union territory of India containing New Delhi the capital of India. The study area of this paper is Delhi and its 39 surrounding air Pollution monitoring stations. Due to the rapid growth of industries and vehicles, the air pollution rate is increasing day by day and it creates adverse effects on the environment and human health. This work is mainly based on six pollutants such as PM10, PM2.5, NO2, SO2, O3, and CO. Through the Air Quality Index (AQI) formula, the concentration maps of these six pollutants have been prepared. The level of pollution is mainly high in the winter (December) season rather than the monsoon (July) season. The main reason for this is the weathering phenomena (fog, mist, dust, etc). It plays an important role in air pollution variation in Delhi.
1. Introduction
Inthetwenty-firstcentury,oneofthebiggestchallengesis airpollution,notonlyatglobalscalebutalsoatlocalandregional levels(6)Airpollutionoccurswhengases,dustparticles,fumes(orsmoke)orodoursareintroducedintotheatmosphereina way that makes it harmful to humans, animals and plants (7).Air pollution is the presence of one or more substances at a concentrationabovetheirnaturallevels,withthepotentialtoproduceanadverseeffect(45).AirPollutionisoneoftheserious problems in the world, especially in urban areas of developing countries due to rapid growth of population, increase in the numberofvehiclesandindustrialization(19).TheWorldHealthOrganisation(WHO)hasrecognisedambientairpollutionas a class one carcinogen and the fourth highest risk factor for premature death worldwide(20)Worldwide, air pollution is a seriousproblemandithasharmfuleffectsonhumanhealth.Itisreportedthat>3milliondeathsareattributedtoairpollution everyyear.Anaggregateofgases suchascarbonmonoxide(CO),nitrogendioxide(NO2),nitrogenoxides(NOX),ozone(O3), and sulfur dioxide (SO2) particulate matter (PM), metals, and organic compounds are commonly discharged through industrial and vehicle combustions, especially in developed and rapidly developing countries(39)Patterns of human activity also change from season to season, so that a particular air pollution concentration in one season may lead to a different exposure in another season(35)According to the environmental monitoring database for the world-leading megacities encompassing 100 countries published in April 2018 by WHO for 2011 and 2016 Delhi ranks high in the list of PM10 pollution(WHO 2018)(28).Air pollution varies seasonally. In the study area, the air quality index is generally moderate level between January to September and then it drastically deteriorates to very poor, severe or hazardous levels from October to December.Duetostubble burning,roaddust,vehiclepollutionandcoldweatherin thewinterseasonairpollutionaremore dangerous than monsoon season.The winters in megacity Delhi are harsh, smoggy, foggy, and highly polluted. The pollution levels are approximately two to three times those monitored in the summer months, and the severity is felt not only in the healthdepartmentbutalso inthetransportationdepartment,withregulardelaysatairportoperationsandaseriesofminor and major accidents across the road corridors(16).Delhi is considered to be one of the most polluted cities in the world(2)Sharma,et al., (2001) have developed an AQI in the Indian context by considering three pollutants: sulphur dioxide (S02),nitrogendioxide(N02)andSuspendedParticulateMatter(SPM).Sharma,et al.,(2003)haveproposedanAQIforthecity of Kanpur by using a maximum operator concept, which takes the maximum value of sub-indices of each pollutantThe air quality index has a comparative index function and supplies the public with a better indicator of air quality. Moreover, it is
© 2022, IRJET | Impact Factor value: 7.529 | ISO 9001:2008 Certified Journal | Page481
 Key Words: Pollutants, Concentration, Air Quality Index, Weathering phenomena, Vulnerability
International Research Journal of Engineering and Technology (IRJET) e-ISSN:2395-0056
Volume: 09 Issue: 10 | Oct 2022 www.irjet.net p-ISSN:2395-0072
investigated that there exists a relationship between pollutant concentrations Introduction and meteorological parameters (e.g.Mccollisterand Wilson, 1975;AronandAron,1978;Lin,1982; RobensonandSteyn, 1990;Ziomas et al,1995). Further, CoxandChu(1993)andKassomenos(1995)haveexaminedtherelationshipbetweentheAQIandmeteorologicalconditions prevalent in the urban atmosphere. Therefore a concentrated effort is underway to develop an AQI coupled with meteorological parameters (8) TheAirQualityIndex(AQI)isanindex for reportingdailyairquality(31).Accordingto WHO, sixmajorairpollutantsarePM10,PM2.5,O3,SO2,CO,andNO2.TheAQIvaluesofthesepollutantsareusedtodeterminetheair condition.
1.2 Study Area:
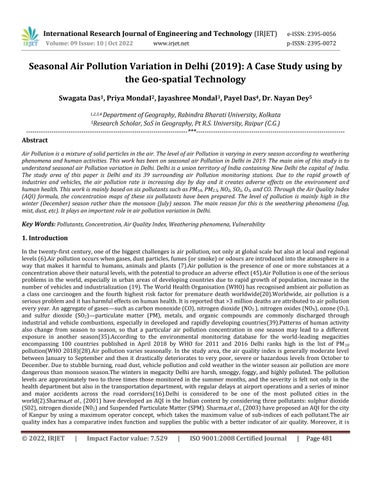
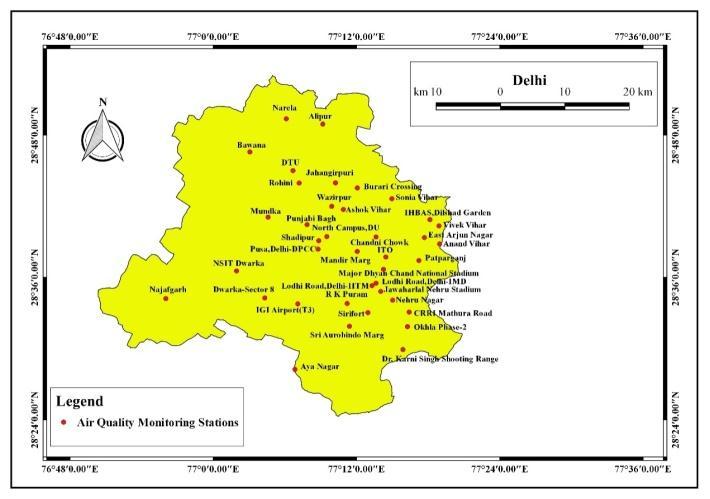
Delhi is a union territory of India containing New Delhi the capital of India. Delhi is geographically located in north India, within the latitude 28°24´17’’N to 28°53’00’’N and longitude 77°45’30’’E to 77°21’30’’E. It is bounded on three sides by the state of Haryana and Uttar Pradesh bound the east portion. The NCT covers an area of 1,484 square kilometres (573 square miles).DelhiislocatedinthewesternpartoftheYamunaRiver,213-305metresabovethemeansealevel.Itsmaximumlength is51.50kmanditswidthis48.48km.
FigureNo.1 Location Map
In Delhi, there are 39 air pollution stations under the control of the Central Pollution Control Board (CPCB), Delhi Pollution Control Committee (DPCC), Indian Meteorological Department (IMD) and Indian Institute of Tropical Meteorology (IITM). Stations are Alipur(DPCC), Anand Vihar(DPCC), Ashok Vihar(DPCC), Aya Nagar(IMD), Bawana(DPCC), Burarai Crossing(IMD), Chandni Chowk (IITM), CRRI Mathura Road (IMD), Dr Karni Singh Shooting Range (DPCC), DTU (CPCB), Dwarka-Sector8(DPCC), East Arjun Nagar (CPCB), IGI Airport(T3) (IMD), IHBAS Dilshad Garden(CPCB), ITO (CPCB), Jahangirpuri (CPCB), Jawaharlal Nehru Stadium (CPCB), Lodhi Road (IITM), Lodhi Road(IMD), Major Dhyan Chand National Stadium(DPCC),MandirMarg(DPCC),Mundka(DPCC), NSIT-Dwarka(CPCB),Najafgarh(DPCC),Narela(CPCB),NorthCampusDU (IMD), Nehru Nagar(DPCC), Okhla Phase 2(DPCC), Patparganj(DPCC), Punjabi Bagh (DPCC), Pusa (DPCC), R.K Puram(DPCC),Rohini(DPCC),Shadipur(CPCB),Sirifort(CPCB),SriAurobindoMarg(DPCC),SoniaVihar(DPCC),VivekVihar(DPCC), Wazirpur(DPCC).
1.3 Objective
To study the spatial and seasonal variations of air pollution and show the vulnerable zonation in Delhi, according to the presentsituation.
International Research Journal of Engineering and Technology (IRJET) e-ISSN:2395-0056
Volume: 09 Issue: 10 | Oct 2022 www.irjet.net p-ISSN:2395-0072
2. Methodology
Thestudyhasfocusedonseason-wiseairpollutionvariationintheDelhiNationalCapitalRegion(DelhiNCR),withthehelpof six parameters (PM2.5, PM10, NO2, SO2, CO, O3). As the study is based on secondary data, so all the work has been done by various sources on the internet. The Air Quality Index (AQI) is a quantitative tool that can be used to report air pollution, providinginformationonhowcleanorpollutedtheairis.AQIadoptedinIndiain2014,isasix-colourcodewithascale(Good, Satisfactory,Moderatelypolluted,Poor,VeryPoor,Severe)developedforeasyunderstandingtoknowthepollutioncondition andeasytoawarepeoplefortheirhealthaswellasfortheenvironment.
TableNo:-1National AQI classes, range and health impact and health breakpoints for the six pollutants Scale (0-500).
AQI Class (Range) Health Impact
PM10 24 hrs (µg/m3)
PM2.5 24 hrs (µg/m3) SO224 hrs (µg/m3) NO2 24 hrs (µg/m3) O3 24 hrs (µg/m3) CO 24 hrs (µg/m3)
Concentration Range Good (0-50) MinimalImpact 0-50 0-30 0-40 0-40 0-50 0-1 Satisfactory (51100) Minor breathing discomfort in sensitivepeople 51-100 31-60 41-80 41-80 51-100 1.1-2 Moderately Polluted (101200) Breathing discomfort to people withlung 101-250 61-90 81-380 81-180 101-168 2.1-10 Poor (201-300) Breathing discomfort to the peopleonprolongedexposure 251-350 91-120 381-800 181-280 169-208 10-17
Very Poor (301400) Respiratory illness the people withprolongedexposure 351-430 121-250 801-1600 281-400 209-748 17-34
Severe (401-500)
Respiratory illness the people withprolongedexposure >430 >250 >1600 >400 >748 >34
Source:CentralPollutionControlBoard,2019
AlldatahasbeencollectedfromCentralPollutionControlBoard(CPCB)andthencalculatetheAQIvaluewiththehelp of the AQI formula. Due to having a lot of data, all the data has been divided into three main shifts to facilitate the work of having multiple data. The shift is mainly based on the working time, like (00:00-08:00),(08:00-16:00),(16:00-00:00), as a result,itwill bepossibleto knowthelevel of pollution accurately.Withthehelpof QGISsoftware, theIDWmapofDelhihas been prepared to show the concentration zones of Delhi. Satellite images have been collected from USGS earth explorers betweentheyears1989and2019toknowthelanduseandlandcoverpattern.WiththehelpofSemi-AutomaticClassification Plugging in QGIS, supervisedclassificationhasbeen done. Climaticdata from Palamweatherstation and Safdarjung weather stationofDelhihasbeencollectedbyIndianMeteorologicalDepartment(IMD)toknowtheweatheringphenomena. Air Quality Index (afterPal, et al.,2020):
International Research Journal of Engineering and Technology (IRJET) e-ISSN:2395-0056
Volume: 09 Issue: 10 | Oct 2022 www.irjet.net p-ISSN:2395-0072
BHi = Break point Concentration i.e. greater than or equal to Cp
BLo = Break point Concentration i.e. less than or equal to Cp
IHi = The AQI value equivalent to BHi
ILo = The AQI value equivalent to Blo
3. Result: 3.1 PM10:
RespirableSuspendedParticulateMatterorPM10 consistsofparticulateshavingadiameteroflessthan10µm.Thesearevery smallparticles(18).Someparticulatesoccursnaturallyemittingfromvolcanoes,duststorms,forestandgrasslandfires,living vegetation, and sea spray and some are emitted directly from anthropogenic sources, such as construction sites, unpaved roadsfields,smokestacksoffires(1)
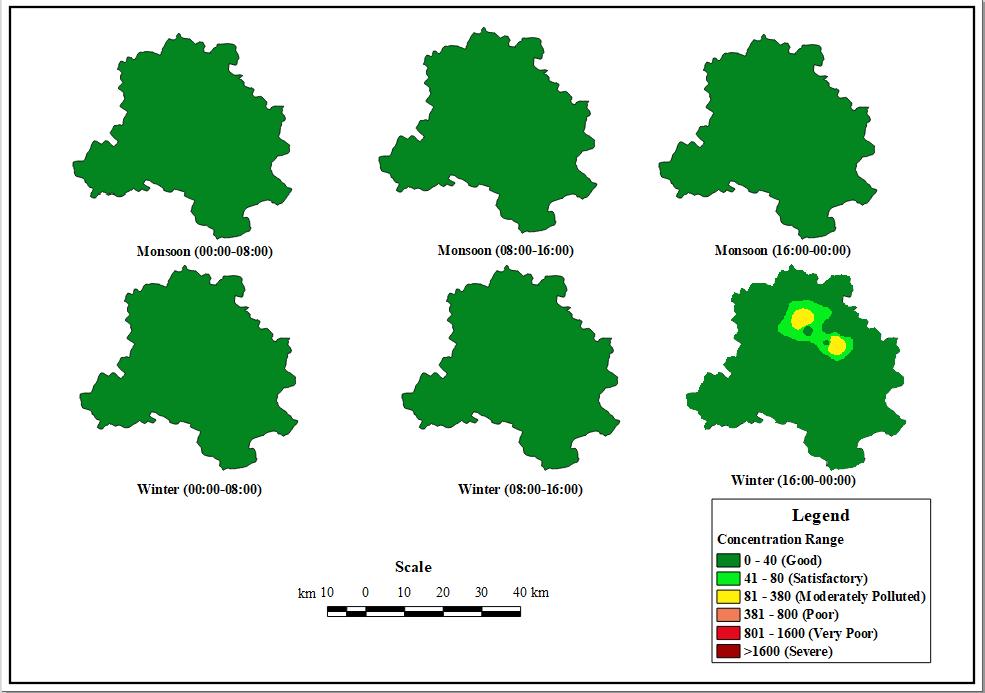
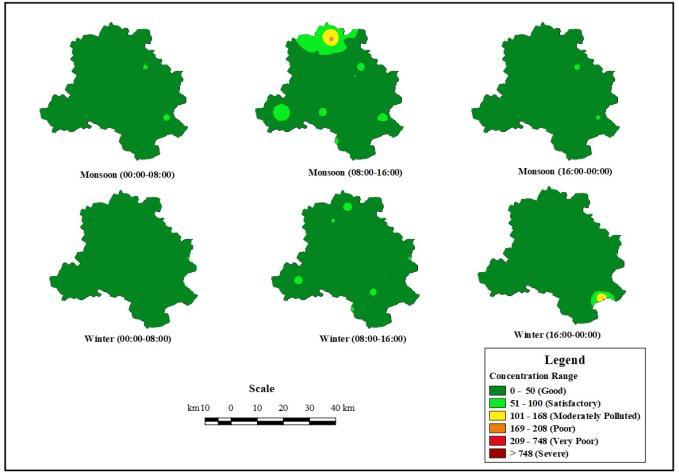
Figure 2ConcentrationofPM10 inMonsoonandWinterofDifferentTime,2019
Spatial Variation
In monsoon, the concentration range of PM10 mainly varies from good to satisfactory condition. In the morning to day shift (08:00-16:00) andafternoontomid-nightshift(16:00-00:00) moderatelyPolluted conditionsaremainlyseen.Inthose,time sections,industrialemissionsandvehicleemissionsareveryhighwhichisthemainsourceofPM10 andmostoftheplacesare belongsinsatisfactoryconditionduringthemidnighttomorningshiftbecauseinthistimevehicleemissionsarecomparatively low as well residential emission is also less. On the other hand concentration range of PM10 belongs from good to severe conditionsinthewinterseason.Wazirpurstationisanindustrialareaandmanyindustriesarefoundlikechemicalindustries, consumergoodsindustries,etc.soindustrialemissionsmainlychemicalindustriesarethemaincausetooccurpollution.For this reason, Wazirpur station falls in very poor condition in terms of pollution. During this season neighbour states such as Punjab,andHaryanaburnsagriculturalstubblecausingalayerofsmoketospreadovertheentireDelhi.Forthisreason,allthe particlesarestuckinthissmokylayerandincreasethelevelofpollutionandweatheringphenomenalikemist,fog,etc.playa bigroleinthis.TheamountoffogandmistisveryhighduringthenightandmorningshiftsandcontaminationofPM10isalso highinthemorningandnightshifts.Becausefogcreatesalayerintheatmospherethat'swhypollutantscouldnotspreadin theupperatmosphere.Butinthedayshiftamountoffogandmistiscomparativelylow(FigNo:2).
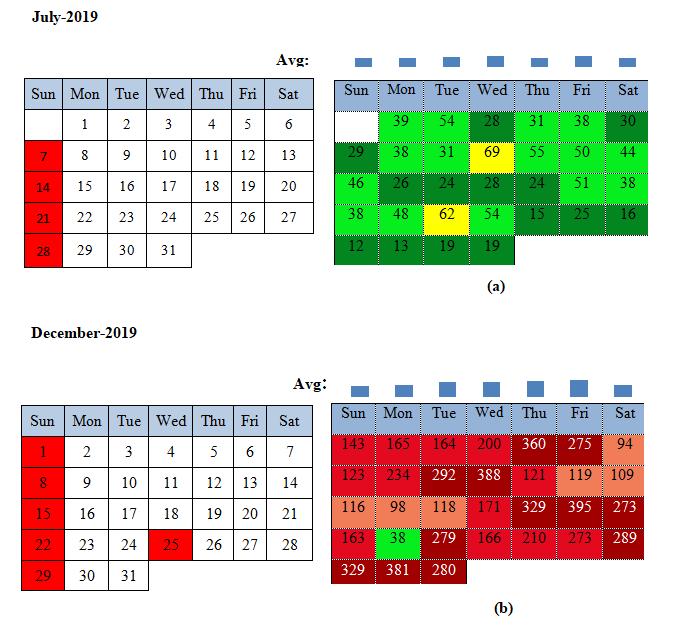
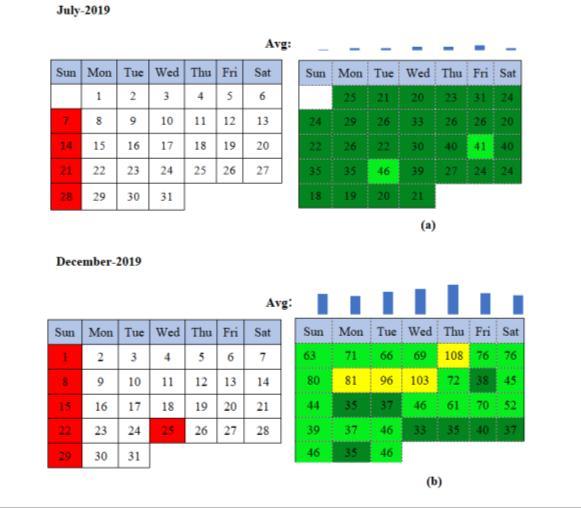
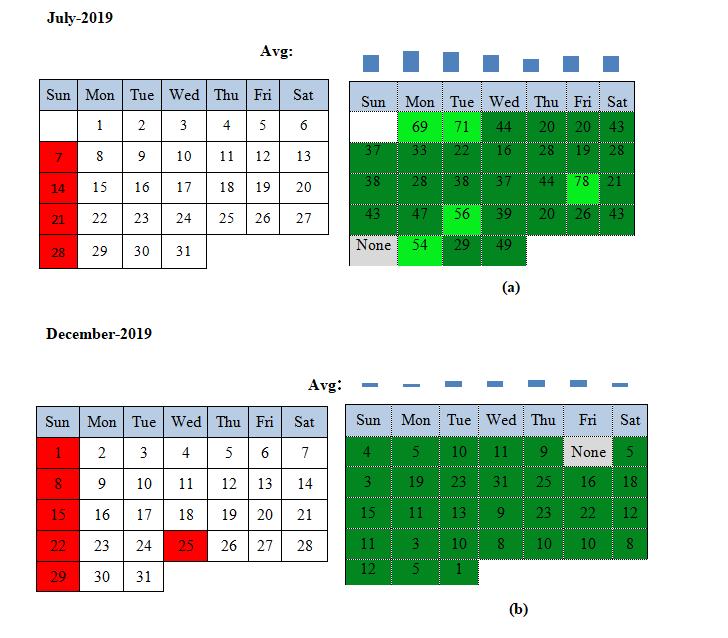
About 32% and 42% (which is calculated) days are in satisfactory and moderately polluted conditions respectively.ContaminationofPM10 hasbeenfoundonThursdayandFridaybecausethesedaysareworkingdays(FigNo:3a, 3b).About 3%, 35%, 16%, 19% and 26% (which is calculated) days are in satisfactory, moderately polluted, poor very poor andsevereconditionsrespectivelyinDecember.ContaminationofPM10 ishighonThursdayandFriday. OnMonday,Tuesday and Wednesday, the concentration of PM10 is also high, because these are working days. Therefore, vehicle and industrial emissionsarehighinthosedays(FigNo:3a,3c).
International Research Journal of Engineering and Technology (IRJET) e-ISSN:2395-0056
Volume: 09 Issue: 10 | Oct 2022 www.irjet.net p-ISSN:2395-0072
Severe Very Poor Poor Moderately Polluted Satisfactory Good
July December
(c)
Source:CentralPollutionControlBoard
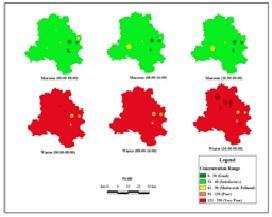
Figure No. 3 Statusofdaily(24hrs)averagePM10 concentrationduringmonsoon&winter(2019)inAshokVihar,Delhi
InDelhi, manypeoplesuffer manyhealthproblemsasif nose block,wheezingcough,attacksofshortnessofbreath,etc.that aremainlycausedbyPM10 pollutants.FewpeoplearesufferingfromlungcancerandCOPDdiseasethataremainlycausedby PM10
3.2 PM2.5:
It refers to atmospheric particulate matter (PM) that has a diameter of fewer than 2.5 micrometres that is about 3% the diameter of a human hair(18) Natural sources of PM2.5 are windblown dust, pollen, spores, photochemical, ally produced particles.AnthropogenicsourcesofPM2.5arevehicularemission,industrialcombustionprocesses,commercialandresidential combustion,andindustries(1).
Figure No. 4ConcentrationofPM2.5inmonsoonandwinterofadifferenttime,2019
In monsoon, the concentration pattern of PM2.5 varies from good to moderately polluted conditions. The amount of fog and mistisverylowatthistime.However,inthewinterseasonconcentrationofPM2.5isveryunhealthy.Evensevereconditionis
International Research Journal of Engineering and Technology (IRJET) e-ISSN:2395-0056
Volume: 09 Issue: 10 | Oct 2022 www.irjet.net p-ISSN:2395-0072
foundinsomeplaces,whichcreateabadimpactonhumanhealthaswellastheenvironment.Generally,thewinterseasonis more dangerous than the monsoon and the main cause of this condition is weathering phenomena such as fog, mist, etc. AlmostwholeDelhibelongsinverypoorconditioninwinter.(Fig No: 4)
Severe Very Poor Poor
Moderately Polluted Satisfactory Good
July December
Source:CentralPollutionControlBoard
Figure No. 5 Statusofdaily(24hrs)averagePM2.5 concentrationduringmonsoon&winter(2019)inAshokVihar,Delhi
About 45%, 48% and 6% days (which are calculated) are in good, satisfactory and moderately polluted condition respectivelyin July(Fig No: 5a.5c).About 3%,19%,39%,and 39%(whichis calculated)days areinsatisfactory,poor, very poorandsevereconditionrespectivelyinDecember.Despitebeingaholiday,25th DecemberisinverypoorconditioninPM2.5 concentration,becauseonthatdayvehicleemissionrateishigh(FigNo:5b,5c).
ThediameterofPM2.5isverysmallsotheyareeasilyabletoreachthelungsandobstructtherespiratorytract.These fineparticles(PM2.5)cancauselungnose,throat,andeyeirritation,coughing,runnynose,andsneezing.Thelong-termeffect of PM2.5 is very harmful to children, decreased lung function, and premature death of those people who have lung or heart disease.
3.3 CO:
Carbonmonoxide(CO)isoneofthemostcommonand widelycirculatedairpollutants.Itisacolourless,odourless,tasteless and non–irritant toxic gas that is very less soluble in water. Incomplete combustion of carbon results in the production of carbon monoxide(CO). The anthropogenicsourcesofCOare motorvehicles,coal combustion, fuel oilcombustion,industrial processes,solidwastedisposalandrefuseburning(18).
International Research Journal of Engineering and Technology (IRJET) e-ISSN:2395-0056
Volume: 09 Issue: 10 | Oct 2022 www.irjet.net p-ISSN:2395-0072
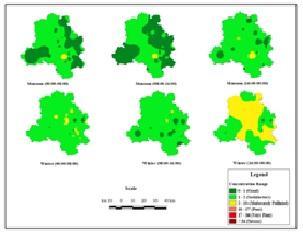
Figure No. 6ConcentrationofCOinmonsoonandwinteratdifferenttimes,2019
Carbonmonoxide(CO)isoneofthemostcommonandwidelycirculatedairpollutants.Inmonsoon(July),theconcentration range pattern mainly varies from good to moderately polluted conditions. In the night shift (16:00-00:00) mainly good condition is being observed, as the industrial emissions and residential emissions are low at this time. But some places like R.K.Puram,LodhiRoad,andSirifortstationshavefallenintothiscategory,andthemainreasonisvehicleemissionsanda high amountofindustrialemissions,whichcreateabadimpactonhumanhealthandtheenvironment.Inwinter(December),the satisfactoryconditionwasmainlyobservedalloverDelhi.Duringthenightshift(16:00-00:00)moderatelypollutedconditions are observed in most parts of Delhi. Due to the presence of many industries, and also weathering phenomena, the level of pollutionhasincreasedinalltheseareas.Theamountoffogandmistismoderatelyhighintheseareas.Inthewinterseason weatheringphenomenahaveplayedanimportantroleinPollution.(Fig No: 6)
(c)
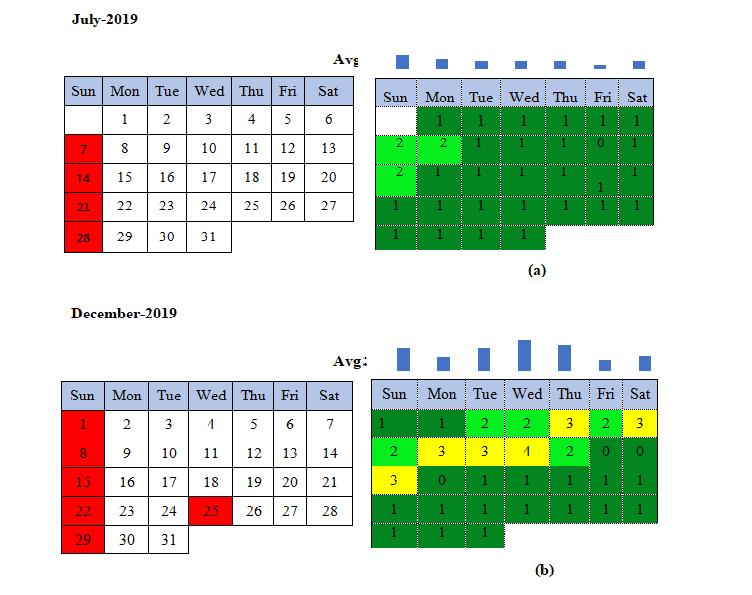
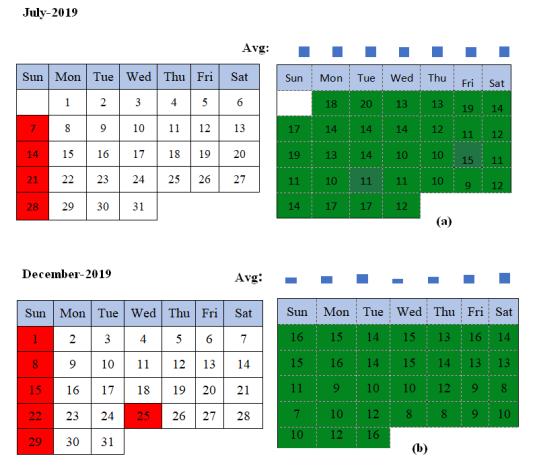
Figure No. 7 Statusofdaily(24hrs)averageCOconcentrationduringmonsoon&winter(2019)inAshokVihar,Delhi
About 90.32% of days (which are calculated) are under good condition and 9.68% days of July are in satisfactory condition (Fig No: 7a, 7c). About 64.51%, 16.13%, and 19.34% days (which are calculated) are in good, satisfactory and moderately pollutedconditionrespectivelyinDecember(FigNo:7b,7c).
International Research Journal of Engineering and Technology (IRJET) e-ISSN:2395-0056
Volume: 09 Issue: 10 | Oct 2022 www.irjet.net p-ISSN:2395-0072
Generallyrecognisedasthesumofnitricoxide(NO)andnitrogendioxide(NO2),itisareddishbrowncorrosivegas(18).Forest fire, lightning etc. are the natural sources of NO2. It also comes into the air when fuels are burned. NO2 emits from vehicles, trucks,buses,powerstationsandoff-roadequipment.(1)
Figure No. 8ConcentrationofNO2 inmonsoonandwinteratdifferenttimes,2019
In monsoon (July), the concentration pattern varies from good to satisfactory condition in terms of pollution. The whole of Delhiexceptsomeplacesofnorth, north-eastDelhiisfalleninthiscategory.Inthe midnightshift(16:00-00:00)someplaces are in satisfactory condition. So in monsoon time, the pollution level of NO2 is much lower than winter season. In winter (December), the whole of Delhi mainly falls in satisfactory condition, though some places are in moderately polluted conditions.Themainreasonforthistypeofconditionisweatheringphenomenon.Inwinteralltheparticleswhichareemitted from fuel burning, vehicles, residential uses, etc. are stacked in the upper layer. For this reason, the level of pollution is also veryhighatthistime.Forthis reason,theatmosphere isalsoveryunhealthyanddangerous forhumanhealth aswell asthe environment(FigNo:8).
Moderately Polluted Satisfactory Good
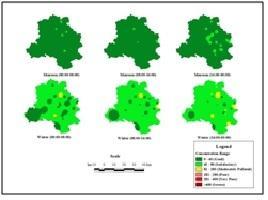
Figure No. 9 Statusofdaily(24hrs)averageCOconcentrationduringmonsoon&winter(2019)inAshokVihar,Delhi
International Research Journal of Engineering and Technology (IRJET) e-ISSN:2395-0056
Volume: 09 Issue: 10 | Oct 2022 www.irjet.net p-ISSN:2395-0072
About93.54%and6.45%ofdays(whicharecalculated)areingoodandsatisfactoryconditionrespectivelyinJuly(FigNo:9a, 9c).About 61.29% of days (which are calculated) areunder satisfactory condition, 25.80% and 12.90% days are in good, moderatelyPollutedconditionrespectivelyinDecember(FigNo:9b,9c).
3.5 SO2:
Sulphur dioxide (SO2), a colourless, foul-smelling, toxic gas, is part of a larger group of chemicals known as sulphur oxide (SOX). It is a non-flammable gas. Naturally, SO2 is emitted from volcanic eruptions, ocean and plant decaying matters and forest fires. Sulphur dioxide is formed in different ways- in the presence of oxygen when sulphur is burned. Oxidation of hydrogensulphide,whenfossilfuelsareburned,biomassandhigh-temperaturecombustionprocessisoccurring.
Figure No:10Concentrationofso2 inmonsoonandwinteratdifferenttimes,2019
Inmonsoon,theconcentrationpatternofSO2 isagoodconditionintermsofpollutionconcentrationrangeinthewholeareaof Delhi. In Delhi, the amount of fog and mist is very less in July. Besides monsoon has already entered July. So, the SO2 concentration level is relatively less. In Delhi, the main source of SO2 is the combustion of fossil fuels. In winter, the concentration pattern of SO2 varies from good to moderately polluted conditions. In mid-night to morning and morning to afternoon shifts, the SO2 concentration pattern is good. But afternoon to night shift SO2 concentration level is moderately polluted in some places because of the presents of fog, mist, etc. Some parts of North Delhi and North West Delhi districts mainlyDTUandWazirpurstationsandtheirsurroundingareasbelongtomoderatelypollutantconditions.Wazirpurstationis an industrial area, and there are so many industries found like chemical industries, consumer goods industries, etc. Badli Industrial Area is located near DTU. So, emissions of those industries mainly chemical industries caused pollution in those places.SO2mainlyaffectstherespiratorysystem,andlungfunctionandmakesbreathingdifficult.(Fig No: 10)
International Research Journal of Engineering and Technology (IRJET) e-ISSN:2395-0056
Volume: 09 Issue: 10 | Oct 2022 www.irjet.net p-ISSN:2395-0072
Source:CentralPollutionControlBoard
Figure No. 11Statusofdaily(24hrs)averageSO2 concentrationduringmonsoon&winter(2019)inAshokVihar,Delhi ThewholemonthofJulyandDecemberareinthegoodconditionintermsofSO2 concentration. (Fig No: 11a, 11b, 11c)
Excessive SO2 emissions have a detrimental effect on asthma patients and cause bronchitis. Sulpher dioxide emission has a badeffectonsoil.ItcausesacidrainwhichmakesthesoilmoreacidicandalsoaffectsonTajMahal.Becauseitiscompletely madeofmarble.MarblereactswithacidrainandacidraindamagesthebeautyoftheTajMahal.
3.6 Ozone:
Ozoneisformedthroughthedissociationofnitrogenoxides(NO2)bysunlighttoyieldtheoxygenatoms,whichthenreactwith molecularoxygentoproduceozonemolecules(18).
Figure
No. 12ConcentrationofOzoneinmonsoonandwinteratdifferenttimes,2019
Inmonsoon,(July)theconcentrationpatternofozonemainlyvariesfromgoodtopoorcondition.Mainlythelevelofpollution islesserinthemorningand thenighttime,becausethe rays ofsunlightarelessisthis timeandtheindustriesalsoclosedat nighttime.Butindaytimethelevelofpollutionishighbecauseofindustrialemissionsandaswellasthesun'srays.In winter
International Research Journal of Engineering and Technology (IRJET) e-ISSN:2395-0056
Volume: 09 Issue: 10 | Oct 2022 www.irjet.net p-ISSN:2395-0072
(December)theconcentrationpatternvariesfromgood topoorcondition.Mainlyintheafternoonto mid-nightshift(16:0000:00),thepollutionisveryhigh.Sometimesitreachedpoorcondition.DrKarniSinghShootingRangeisunderthiszone.The mainreasonisbuilt-upareasandtheweatheringphenomena.Inthisarea,theamountoffogisveryhigh(14.8mm).Fogdoes not mix pollutants in the upper atmosphere layer. For that reason ozone gas concentrates this area. For this reason, these areas and their surrounding areas are very unhealthy for human health. Breathing discomfort, asthma, and many health problemshaveoccurredintheseareas. (Fig No:12)
None Satisfactory Good
(c)
Source:CentralPollutionControlBoard
July December
Figure No. 13Statusofdaily(24hrs)averageOzoneconcentrationduringmonsoon&winter(2019)inAshokVihar,Delhi 84%and13%(whichiscalculated)ofdaysinJulyareingoodandsatisfactoryconditionrespectively.AlargeamountofOzone concentrationhasbeenfoundonworkingdaysvizMonday,Tuesday,Wednesday,ThursdayandFriday.(Fig No: 13a, 13c)
InDecember,theconcentrationofOzoneisingood(0-51)condition.97%(whichiscalculated)ofdaysareingoodcondition inDecember.Attheweekend(i.e.SaturdayandSunday)ozoneconcentrationismoderatelylessthanonworkingdays.(Fig No: 13b, 13c)
3.7 Season-wise air quality:
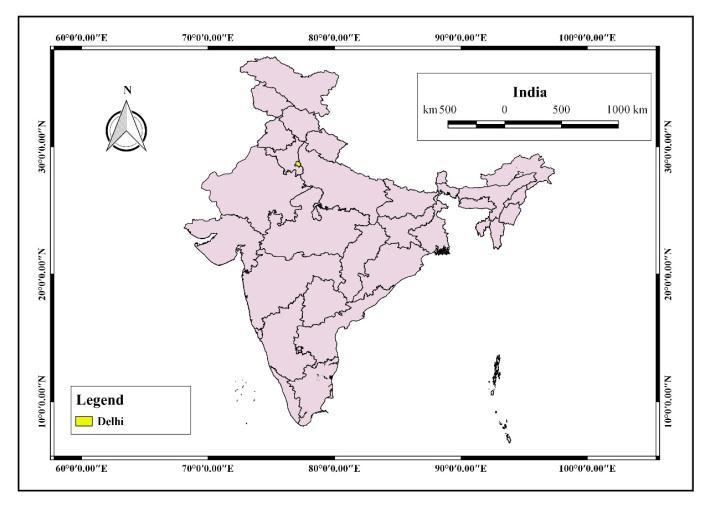
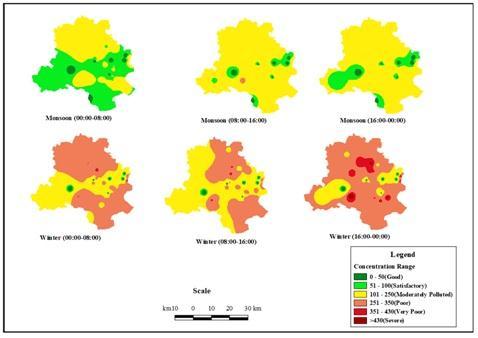
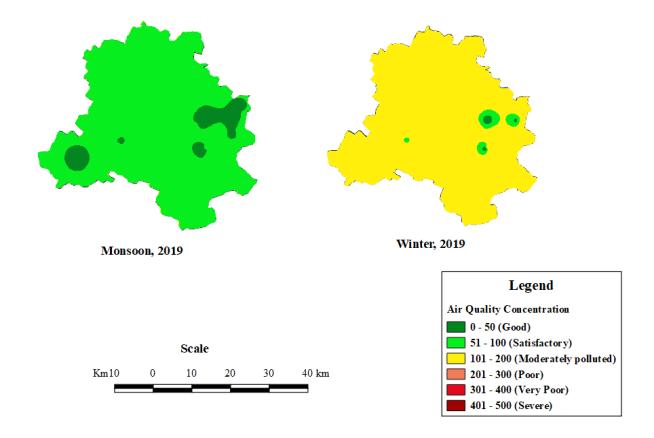
AQI is usually based on pollutant criteria where the deliberation of an individual pollutant is transformed into a sole index usingtheappropriatemethod(28).TheAQIshowshowmuchairiscleanedorpolluted.Thecontaminantschangetheirability to contaminate by reacting with natural substances like fog, mist, etc. So the air quality is also varying in every season. In monsoon, AQI has belonged between good to satisfactory condition. Najafgarhand its surrounding areas, IHBAS Dilshad Garden,a littlepartofEastDelhidistrictssuchasChandniChowk andEastArjun Nagar,LodhiRoad,Delhi-IITM,Patparganj, andNSITDwarkabelongingoodconditioninthisseason.Becausetheemissionofpollutantsislessandthere havenotmuch industry asin other areas. But, North-West Delhi district, West Delhi district, Central Delhi district, New Delhi district, and some major parts of South-West Delhi district, North-East Delhi district, East Delhi district, and South Delhi district have belonged to satisfactory conditions. On the other hand, in the winter season, AQI belongs in good to moderately pollutant conditions.Because,inwinteramountoffogisveryhighwhichiscombinedwithsmokeandotheratmosphericpollutantsand raise smog and border side of Delhi such as North-East Delhi, East Delhi, and South-East Delhi is more polluted than other places of Delhi because of smoke forms for crop burning in the agricultural land areas of the neighbouring states (Haryana, Rajasthan,andPunjab)(FigNo:14).
Figure No. 14AirQualityofMonsoonandWinterinDelhi,2019
3.8 Vulnerability Zonation:
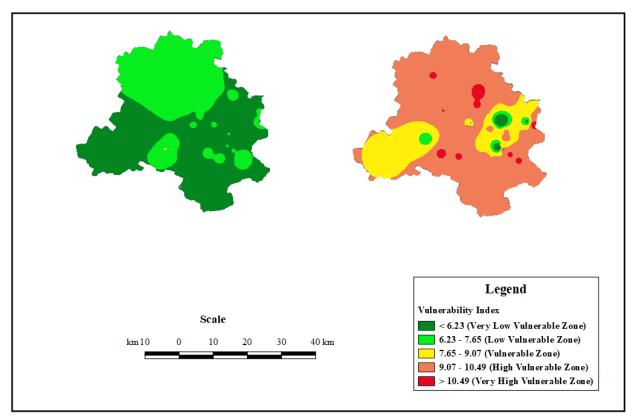
Basedontheconcentrationrateofallpollutantssomeplacesaremorevulnerableandsomeplacesaresafe.Inthemonsoon, season conditions are better than in winter. Although Najafgarh, IHBAS Dilshad Garden, Vivek Vihar, Ashok Vihar, Chandni Chowk,EastArjunNagar,AnandVihar,MejorDhyanChandNationalStadium,LodhiRoad,NehruNagar,andPusastationsare mostpollutedareathanothers.But,inthewinterseason,conditionsareverydangerous.Bawana,Jahangirpuri,
Figure No. 15Vulnerable
Zonation
ofMonsoonandWinterinDelhi,2019
Wazirpur, Dwarka Sector-8, IGI Airport, Jawaharlal Nehru Stadium, and their surrounding areas belong toa very highly vulnerablezone.Thepollutionrateisveryhighintheseareas.Narela,Alipur, Bawana,DTU,Jahangirpuri,Rohini,Mundka,Wazirpur,IGIAirport,OkhlaPhase-2,DwarkaSector-8NehruNagarstations,and theirsurroundingareasbelongtohighlyvulnerableZone.IHBASDilshadGarden, Vivek Vihar,EastArjunNagar,ITO,Mandir Marg, Chandni Chowk, Najafgarh, NSIT Dwarka stations, and their surrounding areas belong tothe vulnerable Zone and the restofthepartcomparativelybelongstothelessvulnerablezone(FigNo:15).
4. Conclusion:
Monsoon winter
ThemainaimofthisstudyistounderstandseasonalairpollutionvariationinDelhi.Airpollutionisaveryvitalissueinrecent times.InIndia,Delhihasbeenconsideredthemostpollutedcityinthecountry.Delhiisamegacityaswellasitisthecapitalof India. Delhi is internationally recognized for its extreme pollution level. Among the selected pollutants PM10 and PM2.5 have
International Research Journal of Engineering and Technology (IRJET) e-ISSN:2395-0056 Volume: 09 Issue: 10 | Oct 2022 www.irjet.net p-ISSN:2395-0072 © 2022, IRJET | Impact Factor value: 7.529 | ISO 9001:2008 Certified Journal | Page492
International Research Journal of Engineering and Technology (IRJET) e-ISSN:2395-0056
Volume: 09 Issue: 10 | Oct 2022 www.irjet.net p-ISSN:2395-0072
witnessed maximum reduction followed by NO2, CO and NH3(28). In this city, the air pollution level is very high due to the presence of major industries, and highly active transport network systems. Land use and land cover pattern determine air pollutionlevelwherethebuilt-upareaislesspollutionlevelarelessandwherebuild-upareaandtransportnetworkarehigh pollutionlevelalsohigh,apositiverelationisfoundthere.ThepollutionratevariesinvariousseasonsinDelhi.Pollutionlevel is comparatively high in the winter season because weather phenomena (fog, mist, etc.) play a great role behind it including smoke from stubble burning in the neighbouring state but in July pollution level or pollutant concentration is comparatively lowthaninDecember.InJulycontaminationofpollutionishighinthedaysectionontheotherhandthelevel ofpollution is higher inthe night section in December. Delhi has been considered the most vulnerable area in the winter season. Pollution levelisveryhighinthewinterseasonandhasamajorimpactonhumanlifeaswell asourenvironment.Manypeoplesuffer manydiseaseslikeasthma,Bronchitis,respiratorydiseasesevendeathhasoccurred.
Chief Minister Aravind Kejriwal announced a 10-point “winter action plan”that focuses on dust control to reduce air pollution.Moreover,someplanshavebeentakentocontrolthispollutionthoseare-submitplansfortheinter-statetransport sector for short-term, midterm and long-term action points to improve rail-based freight traffic to reduce dependence on trucks,prepareanactionplantocheck fuel adulteration andrandommonitoringoffuel qualitydata,alternatepowersystems shouldbepromotedincelltowersanduseofdieselgeneratorsetsdiscouraged,theSupremeCourtorderdated12.08.2016has imposed an environmental pollution charge of 1% on registration on diesel vehicles with 2000 cc and above.And BS6 bikes havestartedtobeused.
References:
1. AirPollutioninDelhi-PublishedbyENVISCENTRECPCBonControlofPollutionWater,AirandNoise.
2. Aneja, V. P., Agarwal, A., Roelle, P. A., Phillips, S. B., Tong, Q., Watkins, N., & Yablonsky, R. (2001). Measurements and analysisofcriteriapollutantsinNewDelhi,India. Environment International, 27(1),35-42.
3. Aron R. and Aron I-M., (1978). Statistical forecasting Models: !.Carbon Monoxide concentration in the Los Angels basin. Journal of Air Pollution Control Association,28,681-684.
4. Aven,T,2011.Onsomerecentdefinitionsandanalysisframeworksforrisk,vulnerability,andresilience.
5. Bishoi,B.AstudyonairqualityindexanditsrelationshipwithmeteorologicalparametersinDelhi.
6. Bodor, Z., Bodor, K., Keresztesi, Á., &Szép, R. (2020). Major air pollutants seasonal variation analysis and long-range transport of PM 10 in an urban environment with specific climate conditions Transylvania (Romania). Environmental Science and Pollution Research, 27(30),38181-38199.
7. Choudhary, M. P., & Garg, V. (2013, August). Causes, consequences and control of air pollution. In All India seminar on methodologiesforairpollutioncontrol,Jaipur,Rajasthan.
8. Cogliani E. (2001). Air pollution forecast in cities by an air pollution index is highly correlated with the meteorological variables. Atm. Env.,35,2871-2877.
9. Cox W.M., and Chu S., (1993). Meteorologically adjusted ozone trends in urban areas: a probabilistic approach. Atmospheric Environment, 27B,425-434.
10. Cropper, M. L., Simon, N. B., Alberini, A., Arora, S., & Sharma, P. K. (1997). The health benefits of air pollution control in Delhi.AmericanJournalofAgriculturalEconomics,79(5),1625-1629.
11. Cusworth, D. H., Mickley, L. J., Sulprizio, M. P., Liu, T., Marlier, M. E., DeFries, R. S., ... & Gupta, P. (2018). Quantifying the influence of agricultural fires in northwest India on urban air pollution in Delhi, India. Environmental Research Letters, 13(4),044018.
International Research Journal of Engineering and Technology (IRJET) e-ISSN:2395-0056
Volume: 09 Issue: 10 | Oct 2022 www.irjet.net p-ISSN:2395-0072
12. deSherbinin,A.(2014).Climatechangehotspotsmapping:whathavewelearned?.Climaticchange,123(1),23-37.
13. Firdaus, G., & Ahmad, A. (2007). Letter to the editor: Urbanization and changing air quality in the city of Delhi. International journal of environmental studies, 64(2),145-148.
14. Gopalaswami,P.(2016).Astudyontheeffectsofweather,vehiculartrafficandothersourcesofparticulateairpollution onthecityofDelhifortheyear2015. J Environ Pollut Hum Health, 4(2),24-41.
15. Goyal, P., Gulia, S., & Goyal, K, S., (2021)"Identification of air pollution hotspots in urbanareas - An innovative approach usingmonitoredconcentrationsdata",ScienceofTheTotalEnvironment
16. Guttikunda, S. K., &Gurjar, B. R. (2012). Role of meteorology in the seasonality of air pollution in megacity Delhi, India. Environmental monitoring and assessment, 184(5),3199-3211.
17. Kassomenos P., Skouloudis A.N., Lykoudis S. and Flocas H.A. (1999). "Air-quality indicators" for uniform indexing of atmosphericpollutionoverlargemetropolitanareas. Atmospheric Environment,33,1861-1879.
18. Khullar,DR.(2020).“India A Comprehensive Geography”9.3-9.5
19. Kishore, N., Deswal, S. (2016) Analysis of air pollution in Indian cities-A literature review. International Journal on EmergingTechnologies,8(1).
20. Kumar, A., & Goyal, P. (2011). Forecasting of daily air quality index in Delhi. Science of the Total Environment, 409(24), 5517-5523.
21. Kumar, A., & Mishra, K, R. (2018) "Humanhealth risk assessment of major air pollutants attransport corridors of Delhi, India",JournalofTransport&Health
22. Kumar,S.(2018).Airpollutionandclimatechange:casestudynationalcapitalterritoryofDelhi.
23. Kumar,T.S.,Mahendra,R.S.,Nayak,S.,Radhakrishnan,K.,&Sahu,K.C.(2010).CoastalvulnerabilityassessmentforOrissa State,eastcoastofIndia.JournalofCoastalResearch,26(3),523-534.
24. Laura,D.V.,etal.“AirpollutioninDelhi:Areviewofpastandcurrentpolicyapproaches." Air Pollution XXVI 230(2018): 441.
25. Lin G.Y. (1982). Oxidant Prediction byDiscriminant Analysis in South Coast Air Basin of California. Atmospheric Environment, 16,135-143.
26. M.,N.,Chandra,T.,Agrawal,P.,BansalH.,Singh,S.,Anand,T.,Gupta,K,M.,&Kumar,R.,(2014). "EvaluatingAwarenessand PracticesPertainingtoRadioactiveWasteManagementamongScrapDealersinDelhi,India",PLoSONE
27. Mage,D.T.,&Ott,W.R.(1978).Refinementsofthelognormalprobabilitymodelforanalysisofaerometricdata.Journalof theAirPollutionControlAssociation,28(8),796-798.
28. Mahato,S.,Pal,S.,&Ghosh,K.G.(2020).EffectoflockdownamidCOVID-19pandemiconairqualityofthemegacityDelhi, India.Scienceofthetotalenvironment,730,139086.
29. Mandal, J., Samanta, S., Chanda, A., &Halder , S,. (2021). "Effects of COVID-19 pandemic onthe air quality of three megacitiesinIndia",AtmosphericResearch
International Research Journal of Engineering and Technology (IRJET) e-ISSN:2395-0056
Volume: 09 Issue: 10 | Oct 2022 www.irjet.net p-ISSN:2395-0072
30. Mccollister G.M. and Wilson, K.R., (1975). Linear Stochastic Models for Forecasting Daily Maximal and hourly Concentrationsofairpollutants. Atmospheric Environment,9,417-423.
31. Mohan,M.,&Kandya,A.(2007).AnanalysisoftheannualandseasonaltrendsofairqualityindexofDelhi.Environmental monitoringandassessment,131(1),267-277.
32. PandeJN,BhattaN,BiswasDetal.OutdoorairpollutionandemergencyroomvisitsatahospitalinDelhi,IndiaJChestDis AlliedSci.2002
33. Patel, K., Campmier, J, M., Bhandari, S., Baig, N., Habib, G, G, S., Joshua S. Apte, S, J.,& Ruiz, H, L., (2021). "Persistence of Primaryand Secondary Pollutants in Delhi: Concentrations and composition from 2017 through the COVID Pandemic",EnvironmentalScience&TechnologyLetters.
34. Peng, R. D., Dominici, F., Pastor-Barriuso, R., Zeger, S. L., &Samet, J. M. (2005). Seasonal analyses of air pollution and mortalityin100UScities. American journal of epidemiology, 161(6),585-594.
35. Puri, P., Nandar, S., Kathuria, S., & Ramesh, V. (2017). Effects of air pollution on the skin: A review. Indian journal of dermatology,venereologyandleprology,83(4).50
36. Rizwan, S. A., Nongkynrih, B., & Gupta, S. K. (2013). Air pollution in Delhi: its magnitude and effects on health. Indian journalofcommunitymedicine:officialpublicationofIndianAssociationofPreventive&SocialMedicine,38(1),4.
37. Rizwan, S. A., Nongkynrih, B., & Gupta, S. K. (2013). Air pollution in Delhi: its magnitude and effects on health. Indian journal of community medicine: official publication of Indian Association of Preventive & Social Medicine, 38(1),4.
38. RobensonS.M.andSteynD.G.,(1990).EvaluationandcomparisonofstatisticalforecastmodelsfordailymaximumOzone concentrations. Atmospheric Environment, 24B,303-312.
39. Rocha, I. I., Narasimhalu, K., & De Silva, D. A. (2020). Impact of Air Pollution and Seasonal Haze on Neurological Conditions. Ann. Acad. Med. Singap, 49,26-36.
40. Sahoo, B., &Bhaskaran, P. K. (2018). Multi-hazard risk assessment of coastal vulnerability from tropical cyclones–A GISbasedapproachfortheOdishacoast.Journalofenvironmentalmanagement,206,1166-1178.
41. Sarkar, S., Chauhan, A., Kumar, R., & Singh, R. P. (2019). Impact of deadly dust storms (May 2018) on air quality, meteorological,andatmosphericparametersoverthenorthernpartsofIndia. GeoHealth, 3(3),67-80.
42. SharmaM.,PandeyR.,MaheshwariM.,SenguptaB.,ShuklaB.P.GuptaN.K.andJohriS.(2003).Interpretationofairquality datausinganairqualityindexforthecityofKanpur,India. Journal of Environmental Engineering and Science,2(6),453462.
43. Sharma M., Sengupta B., Shukla B.P. and Maheshwari M. (2000). Air Quality Index for Data Interpretation and Public Information.PresentedinInternationalConference,CentreforScienceandEnvironment,NewDelhi,June6-8.
44. Sharma,A.R.,Kharol,S.K.,Badarinath,K.V.S.,&Singh,D.(2010,February).Impactofagriculturecropresidueburningon atmospheric aerosol loading–a study over Punjab State, India. In Annales Geophysicae (Vol. 28, No. 2, pp. 367-379). CopernicusGmbH.
45. Sharma, N., Taneja, S., Sagar, V., & Bhatt, A. (2018). Forecasting air pollution load in Delhi using data analysis tools. Procedia computer science, 132,1077-1085.
International Research Journal of Engineering and Technology (IRJET) e-ISSN:2395-0056
Volume: 09 Issue: 10 | Oct 2022 www.irjet.net p-ISSN:2395-0072
46. Siddique,S.,Banerjee,M.,Ray,M.R.,&Lahiri,T.(2010).AirpollutionanditsimpactonlungfunctionofchildreninDelhi, thecapitalcityofIndia.Water,Air,&SoilPollution,212(1),89-100.
47. Sindhwani, R., & Goyal, P. (2014). Assessment of traffic-generated gaseous and particulate matter emissions and trends overDelhi(2000–2010). Atmospheric pollution research, 5(3),438-446.
48. Singhe, A. L., & Jamal, S. (2012). Assessing the vulnerability of women to indoor air pollution. Research Journal Fo EnvironmentalandEarthSciences,4(11),982-89.
49. Suliankatchi,R.,Kankaria,A.,Roy,R.,Chellaiyan,V.G.,Kharya,P.,Upadhyay,R.P.,&Chinnakali,P.(2013).Knowledgeand practices regarding child rearing and its association with literacy among married women in a rural area of Tamil Nadu, India.InternationalJournalofMedicineandPublicHealth,3(4).
50. TechnicalAssistanceDocumentfortheReportingofDailyAirQuality-theAirQualityIndex(AQI).
51. Vyas,S.,Srivastav,N.,& Spears,D.(2016).An experimentwithair purifiersinDelhi during Winter2015-2016. PloSone, 11(12),e0167999
52. ZiomasI.C.,Me1asD.,ZerefosC.S.,PaliatsosA.andBaisA.F.(1995).Forecastingpeakpollutantlevelsusingmeteorological variables. Atm. Env.,29,3703-3711.
Web sources:
1. http://des.delhigovt.nic.in
2. https://en.m.wikipedia.org/wiki/Particulates
3. https://www.epa.gov/pm-pollution/particulate-matter-pm-basics
4. https://learn-kaiterra-com.cdn.ampproject.org/v/s/learn.kaiterra.com/en/air-academy/three-types-of-particulate-
5. matter?amp_js_v=a6&_gsa=1&hs_amp=true&usqp=mq331AQKKAFQArABIIACAw%3D%3D#aoh=16269454886705& referrer=https%3A%2F%2Fwww.google.com&_tf=From%20%251%24s&share=https%3A%2F%2Flearn.kaiterr a.com%2Fen%2Fair-academy%2Fthree-types-of-particulate-matter
6. https://www.epa.gov/pm-pollution/particulate-matter-pm-basics
7. https://www.airveda.com/blog/what-is-pm2-5-and-why-is-it-important
8. https://www.epa.gov/pm-pollution/particulate-matter-pm-basics#PM
9. https://www.epa.gov/ground-level-ozone-pollution/ground-level-ozonebasics#:~:text=Ozone%20is%20a%20gas%20composed,atmosphere%20and%20at%20ground%20level.&text=Ozone% 20at%20ground%20level%20is,more%20about%20air%20emission%20sources 10. http://www.theozonehole.org/badozone.htm 11. https://www.lung.org/clean-air/outdoors/what-makes-air-unhealthy/nitrogendioxide#:~:text=Nitrogen%20dioxide%2C%20or%20NO2,are%20burned%20at%20high%20temperatures
12. https://www.slideshare.net/brittgow/pollution4-air-pollution-and-so2 13. https://www.slideshare.net/brittgow/pollution4-air-pollution-and-so2 14. https://www.health.state.mn.us/communities/environment/air/toxins/index.html 15. https://www.pca.state.mn.us/air/sulfur-dioxideso2#:~:text=Sulfur%20dioxide%20(SO2)%2C%20a,other%20materials%20that%20contain%20sulfur
16. https://www.slideshare.net/brittgow/pollution4-air-pollution-and-so2 17. https://wap.business-standard.com/article/current-affairs/delhi-cm-announces-action-plan-to-combat-air-pollution-inwinters-121100400472_1.html