International Research Journal of Engineering and Technology (IRJET) e-ISSN:2395-0056
Volume: 09 Issue: 10 | Oct 2022 www.irjet.net p-ISSN:2395-0072
International Research Journal of Engineering and Technology (IRJET) e-ISSN:2395-0056
Volume: 09 Issue: 10 | Oct 2022 www.irjet.net p-ISSN:2395-0072
1Dept of Comp Engg and Information Tech, Veermata Jijabai Technological Institute Mumbai, India
2Dept of Comp Engg and Information, TechVeermata Jijabai Technological Institute Mumbai, India ***
Abstract Currently, there are many literature reviews on the application of predictive analytics in Supply Chain Management (SCM). However, most of them focus only on some specific functions in supply chain management, including Procurement, Demand Management, Logistics and Transportation, or purely technical aspects. The purpose of this paper is, it aims to provide an overview of the outstanding supply chain managementfunctions (SCMF) that apply predictive analytics. Spend analysisis one of the major areas of SCM, in which predictive analyticsis applied. LSTM model is created which provides a better accuracy for time series data. The results obtained are compared stating why the above mentioned LSTM approach is better. Along with Spend Analysis training of Printed and Handwritten documents for extraction of required fields is also worked upon. Extracting fields from different document templates (Printed andHandwritten Invoices and Proof of Delivery) was a challenge for which we were able to produce better results and accuracy.
Index Terms—Predictive Analytics, Machine learning, Supply chain management (SCM), Long Short-Term Memory (LSTM), Data Augmentation, Image Pre processing, Form Recognizer
Logistics is that part of the supply chain process that plans, implements, and controls the efficient, effective flow and storage of goods, services, and related information from the point-of-origin to the point-of-consumption in order tomeet customers’ requirements. By sharing data, knowledge, and information with supply chain partners, e-Logistics is a dynamiccombinationofcommunication,computing,and collaborationtechnologiesthataltercorelogisticaloperations tobe customer centric. Delivering the right items to the right customer in the appropriate amounts, at the right time and place, is theultimategoalofe-logistics.Tohelpdecision-makersandforeseecertainfutureevents,predictivemodelsemployhistorical andtransactionaldatatofind trends forrisksandopportunitieswithinagivensetofcircumstances. Predictivesolutionscan be used for a variety of purposes, but they are most valuable when they are customised for a specifickind of operation and builtarounda set of rulesandguidelinesdesignedjustforthatbusiness.Byusingpredictivesolutionstogeneratesupplyand demandforecasts,companieswillbeabletomaketherightoperationaldecisionsinaproactivemanner. This approach can also allow for the re-balancing of assetsacross any logistic network at a minimal cost.
DemandmanagementisthemostSCMfunctionusingpredictiveanalytics[1].Infact,thereviewedliteraturedemonstrated a number of contributions addressing the analysis of historical datasets and the capture of real-time demandchangesfor sensing and anticipating need. Demand forecastingis the precise assessment of a product’s demand using the relationship betweentheproductandagroupofunrelatedinput variables.
Data collection: The process of comprehending and com- piling data on elements connected to SCM operations, such as sourcing risk, demand forecasts, etc., is known as data collection. However, excessive data will take time to normalise, and inaccurate data will skew the system’s overall findings. As a result, choosing the right data source is crucial to the system’s performance.Itisobviousthatthephaseofdatacollectingisthe most crucial in the entire system.
Feature extraction: The process of extracting some crucial characteristics from a dataset using several techniques, like cross-validation and REF, is known as feature extraction. Asa result, a subset that is derived from the original data will producearesultthatismoreaccuratethantheoriginaldata.Asa result, this feature extraction technique needs to be applied to the acquired data.
© 2022, IRJET | Impact Factor value: 7.529 | ISO 9001:2008 Certified Journal | Page443

e-ISSN:2395-0056
Volume: 09 Issue: 10 | Oct 2022 www.irjet.net p-ISSN:2395-0072
Feature selection: The data must be chosen using the featureselection procedure after being divided into subsets with features in order to choose the data with the most crucialcharacteristic.DT,XG-boost,ACF,andotherpopularmethods could be employed at this stage.
Optimized model generation: After completing the pre- processing steps, the data must now be divided into two sets: the trainingdatasetandthetestingdataset.Asaresult,the trainingdatasetisusedtodeveloptheoptimisedmodelbyidentifying thebestparameters,andthetestingdatasetisusedtoconfirmtheaccuracyofthesystemoutput.However,withtheexception of partner selection in procurement functions, this dataset decomposition applies to all SCMF research issues.In terms of partner selection, the results will be obtained bydirectly applying the normalised dataset to a certain methodor model.
Prediction/ Classification implement and Evaluation: To detect and anticipate outcomes, such as a risk prediction for SCRM(sourceriskmanagement),customerengagement (demandsensing),future demand(demandforecasting),etc., testing dataset will be applied to the optimised model. Additionally, the normalised dataset will be directly put to the method or modelforpartnerselectioninordertoassessthepossible risk of the provider.
Thedatasetsincludedinthispaperdisplayawiderangeof propertiesandformats.Thevarietyofdatasetsoriginatesfrom various supply chain functions, ranging from text databasesto time-series historical datasets and numerical, historical statistics datasets. The time-series dataset is utilised duringthe data gathering phase as the main data attribute for anticipating demand. Original or raw datasets frequently include unstructured information, redundant attributes, and confusing, incorrect attributes. In order to normalise raw data or pickthe data with the most significant characteristics, numerous strategies and algorithms have been utilised during the pre- processing stage, particularly during the Feature selection phrase. The transmission method and differences between the original dataset and the optimised featured/normalized dataset are, however, only fully demonstrated in three studies. The forecasting process can be divided into processing stages.[2] Typically, it may consist the following: •An initial examinationof the original time series is conducted with the intentionofobtaininghigh-quality,reliabledataafteridentifyinganygapsinthedataortheneedfortime seriesinterpolation;thechoiceofinterpolationtechniqueinfluencestheoutcomesof subsequentcalculations(i.e.correlation orsimilarityanalysis).
•the use of preprocessing algorithms (for example, to retrieve valuable information, to noise reduction, to extract specific componentsfromprocessedtimeseries).•animplementationofchosenforecastingalgorithm(s)acrossapredeterminedtime horizon. • Dedicated error measurements are used to analyse the quality of the prediction findings (for example, root mean square errors, RMSEs). The latest value of the processed series serves as the best predictor in the Wiener process (random walk), which treats daily increments as stationary sequences of independent random numbers, particularly for short-term prediction horizons. The zero order-hold (ZOH)andfirstorder-hold(FOH)approachescanbeappliedforthispurpose. Zero Order denotes a constant function; to fill upthe gaps, we interpolate the same value. First order indicates that we can interpolate using a linear function (Line with a slope). Hold refers to keeping the parameters constant untilthe following sample.TimeserieswithatrendandarandomcomponentaresmoothedandpredictedusingtheHolt’smodel.Thelineartrend intheseries”yn”isexpressedbythefirst-orderpolynomial.Exponentiallysmoothingisusedtocontrolthevariableleveland itsincrements.TheadaptiveHolt’smodel can be applied by the parameters (weights) adaptationinamovingwindow.p-step prediction of time series y at the time n is calculated as: In order to produce a Newton series that matches the data, polynomial extrapolationisoftendone usingLagrangeinterpolationorNewton’smethodoffinite differences.Thegenerated polynomialcanbeappliedtothedatatoextrapolateit.Usehigh-orderpolynomialextrapolationwithcaution.Withadditional k-foldcross validation,the erroris reduced andtheoutcomeis obtainedconsiderablymore quickly. [3] A class called K-Fold enables you to divide your data into K folds. The advantage of LSTM is that each cell tries to retain the most important information in thedata.Byusingamemoryunitknownasacellunitorcell memoryforanetwork,LSTMwasdevelopedto correct the exploding and vanishing gradient during training RNN. The model can learn from every output of the sequence data since cells are allowed to remember the results. The most essential three gates of LSTM model: update, forget and output gates.
e-ISSN:2395-0056
Volume: 09 Issue: 10 | Oct 2022 www.irjet.net p-ISSN:2395-0072
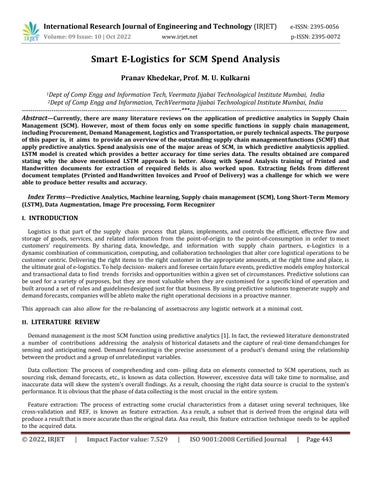
A candidateis calculated using equation 1. The weightwcandbiasbc arethecandidatet’sownparameters.The weight wu and the biasbu are the parameters of the updategate ut, which is calculated in Equation 2. By utilising asigmoid function, they assist the model in determining whentoupdatethememorycell;iftheoutputofthesigmoidfunction is close to one, it is updated, and if it is close tozero, it is disregarded. The parameters of the memory cellwillbe updated by multiplying the output of update gate ut and candidate t. The forget gate operates in a manner similar to that of the update gate. Equation 3 demonstrateshow the model can decide when to erase the data stored in a memory cell by using the forget gate. The weight w0andthebiasb0arethespecificationsfortheforgetgateft. Equation 4 calculates the output gate ot by adding the biasb0andweightw0tothecurrentinput.Bymultiplyingtheupdate gate by the candidate t and adding it to the forgetgate, which is multiplied by the previous cell state ct-1, anew cell state c t is computed and passed to the followinglayer using Equation 5 to update the parameters to cell state.
A common metric for determining how accurately a model predicts quantitative data is the root mean square error (RMSE).
Comparing ARIMA and LSTM-based algorithms, the pre- diction was improved by an average of 85Comparison of the effectivenessofARIMAandLSTMmodelsintermsof lowering error rates is added, and it is a generalisation ofthemore straightforward Auto Regressive Moving Average. Because the data that was gathered and analysed are non- stationary, ARIMA is chosen to serve as a proxy of conventional forecast modelling. The LSTM approach is employed similarly and as a representation of deep learning-based algorithms duetoits useinmaintaining and trainingthefeatures ofgiven data over a longer duration. A type of recurrent neural network called long short-term memory (LSTM) is able to retain values from earlier stages for use in the future.
LSTM-based algorithm improved the prediction by 85%on average compared to ARIMA. There are five major stages in OCR. They are as follows: [5]
International Research Journal of Engineering and Technology (IRJET)
e-ISSN:2395-0056
Volume: 09 Issue: 10 | Oct 2022 www.irjet.net p-ISSN:2395-0072
Post-processing
• Converting handwriting or text documents into electronic format is what is meant by digitization. The pre-processing stage is the next step for the image. • Location segmentation and noise reduction involve smoothing, thinning, fixing breakages,de-skewing, etc.ofthe imageaspartofpre-processing.•Segmentationistheprocessofremovingindividual characters froman image.•Following characterseparation,eachcharac- ter’suniquefeatures including diagonal,intersection,transition,direction,curvefitting,etc. areretrievedandtransmittedforpost-processing. •Charactergroupinganderrordetection are included in the post-processing
OCRrecognitionratecanbegreatlyimprovedusingBeizerCurve. [6]
Lessthan30%oftheactualnumberofcharactersinthetextimagecanberecognisedbeforerepair,andtherearenumerous mistakes.Allcharactersmayberecognisedinthetextimage aftercorrection,andtherearefewermistakes.Traditionalpaper text,especiallybooks,willgenerateapparentbendingdistortionduringthepicturecollectingprocess,affectingtherecognition accuracyofOCR.Thispapersuggestsatextrepairtechniquebasedona beziercurve.Aspartofa deeplearning strategy,text regionsaredetectedbyutilisingROItoconstruct borderboxes,andtextisthenretrievedusingconvolutionneural networks. [7]
The following phases make up the suggested strategy:
Image acquisition: In image acquisition, images that willbe processed are stored in a local file and read one at a timeas theyareprocessed.TheRGBchannelisusedtostoretheimages.
Pre-processing:Auniquedatasetwith467photosismade foranexperiment.Phasesfortestingandtrainingareseparated fromthedataset.258photosfromthecollectionaretested,and209 images are trained for text extraction and identification. Results from the data set are assessed in light of these.
Imagesaregrayscaledatthepre-processingstage.TheimageischangedtograyscalebymultiplyingtheRGBvaluesby0.29, 0.587, and 0.114, respectively. The Otsu methodisusedfordimensionality(shape,width,and height) andlayerreduction toidentify eachpixel.Thealgorithmoutputsa singleintensitythresholdthatdividespixelsintotwo groups, foreground and background.
Binarization is the process of taking a grayscale image and turning it into one that is incredibly differentiating, thereby reducingtheamountofinformationitcontainsfrom256shadesofgreytoonethatisextremelycontrastinganddisguised as a binary image.
Bymeasuringbackgroundbrightnessandthedepthoftheblackareaalongtheline,adaptivebinarizationcandeterminethe bestbinarizationparametersforeachindividuallinesegment. Higher acknowledgement precision will be attained asa result of the lines and words being precisely separated.
Thetextregionwillberecognisedanddetectedduringthe segmentationphaseutilisingtheregionofinterest.Byassembling related pixels with comparable attributes, text and non- text regions are separated. The text is detected from the regionof interest(ROI)byconstructingaborderboxoncethetextregionhasbeenidentifiedbytakingintoaccountthex,yplaneof the text region.
International
(IRJET)
e-ISSN:2395-0056
Edges in the text section of the image are found usingwidth and height, which are expressed as pixel coordinates, and returnedtoROI.Boundingboxesaredrawnusingpixelcoordinates.
Feature Extraction:
ConvolutionandpoolingproceduresofCNNareusedinfeatureextractiontoidentifytheoptimumfeatures.Beforeextracting the text from the blurred and unblurred photos, the system is trained on the images. With the aid of a convolution neural network, the text will be retrieved (CNN). Each char- acter in the text created by the bounding box is recognisedand displayed over an image using trained characters.
The two operations that make up a traditional CNN are convolution and pooling, and the input picture can instantlybe convolved with different convolution kernels. The output ofthis operational series is typically linked to a fully linked layer, whichisfundamentallycomparabletoamultilayerperceptionneural network (MCP)
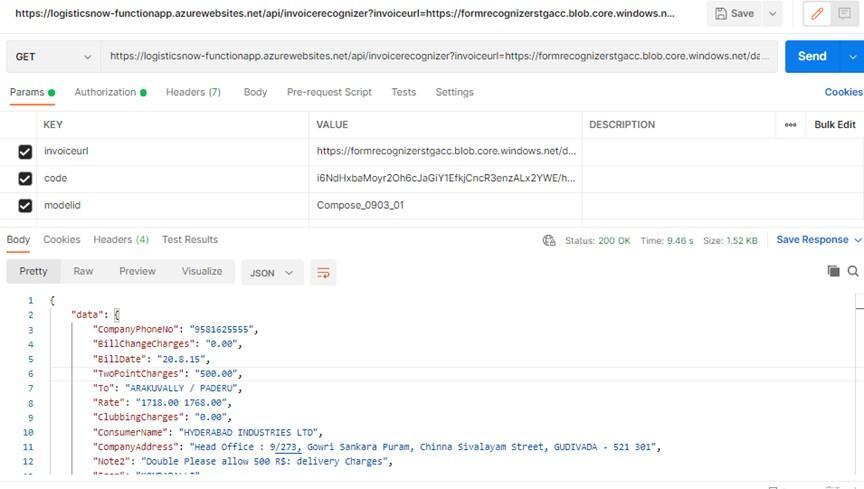
UploadthescannedcopyofPOD(ProofofDelivery)andInvoice.
Image Uploaded to Blob Storage. (Blob storage is a feature in Microsoft Azure that lets developers store data in Microsoft’s cloud platform).
ImageaccessedfromtheBlobstorageandOCR(OpticalCharacterRecognition)isappliedontheuploadedPODandInvoice.
TextfromtheuploadPODorInvoiceisextractedandisprinted in form of output.
Oncethedatafromboththeuploadeddocumentsiscollected,they are compared and based on which the match confidenceis calculatedandalongwiththattheaccuracyonwhichthefield is extracted by the OCR.
1. ModelTrainingandTesting:
LabellingandtrainingmodelsusingFormRecognizerandtesting for the same
FormRecognizer: Creation of a project
Uploading the images to be trained to the blob storage.Labelling the data
Label.jsonandOcr.jsonfileswouldbecreatedafterthemodelis trained.
2. Data Cleaning:
Cleaning the extracted data from new trained models
3. Combine TestAndRestructure:
Combine the model with existing model, test for thesame.Restructure the data sent to UI
4. ComparisonofValues:
ComparetheInvoiceand POD,get accurate results.Compare extracted values with Freight Master
Volume: 09 Issue: 10 | Oct 2022 www.irjet.net p-ISSN:2395-0072 © 2022, IRJET | Impact Factor value: 7.529 | ISO 9001:2008 Certified Journal | Page447
International Research Journal of Engineering and Technology (IRJET)
e-ISSN:2395-0056
Volume: 09 Issue: 10 | Oct 2022 www.irjet.net p-ISSN:2395-0072
ForPrintedDocument:Output:Extraction ofFields
Accuracy Obtained:
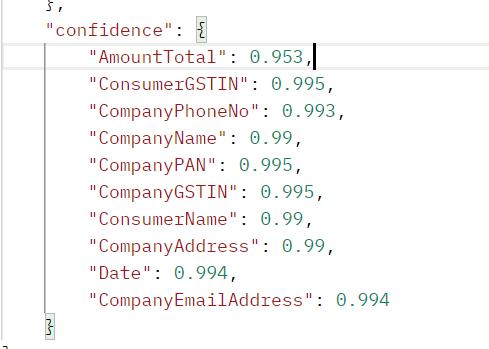
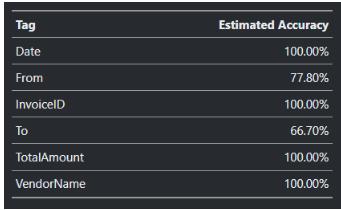
The above image states that the fields extracted from the handwritten documents do not obtain desired accuracy. Hence,todealwiththisissuetwoapproacheswereconsidered.
TheInvoicesandProofofDeliveryavailableinrealworlddonotfollowasingletemplate.Thereandmultipletemplatesand multipledifferentfieldswhicharerequiredtobeextractedand placed at different positions.
Creationofasinglemodeldecreasestheaccuracyofthemodel.
International Research Journal of Engineering and Technology (IRJET) e-ISSN:2395-0056
Volume: 09 Issue: 10 | Oct 2022 www.irjet.net p-ISSN:2395-0072
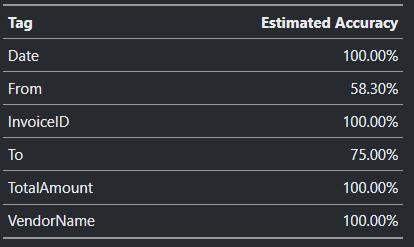
Theaboveimageshowstheaccuracyofeachfieldextractedwhen two differenttypes ofdocuments are trained together.
Theaboveimageshowstheaccuracyofeachfieldextractedwhen three differenttypes ofdocuments are trained together.
Toovercomethis issuewecameupwith a solution ofcreation of different model for different types of documentsand thencombinethemtogethertoformasinglemastermodel.
Thisapproach providedus betteraccuracy.
D. METHODS
Method 1:
1. Application of Data Augmentation to increase the datasetfor training and testing purpose, to get more accurate results. 2. ApplicationofImagePre-processing Techniques.
3. ThentraintheobtainedimageswiththehelpofFormRecognizer. 4. Analyse the Results.
5. This approach did not provide much better accuracy.
International Research Journal of Engineering and Technology (IRJET)
e-ISSN:2395-0056
Method 2:
1. Train theModel using the FormRecognizer.
2. Analyse the output.
3. If the output is not as accurate as required.
4. Prepareasetofkeywords,createanexcelfile for thesame.
5. Oncethevalueisextracted,itwillpassthroughallthekeywords present in the list for that particular key.
6. Algorithm will compare the entire extracted string withthe keywords and the output which is more similar will be considered.
7. This approach is not mentioned in any of the papers, no paper talks about extracting the proper output if not recognised properly.
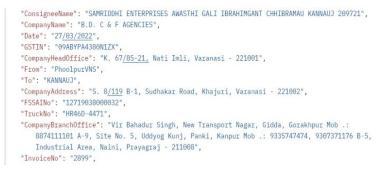
Output: Extraction of Fields For Handwritten Documents:
The above image states that the fields extracted from thehandwritten documents obtain the desired accuracy.
E. IMPLEMENTATION OF STACKED LSTM:
The dataset contains fields such as symbol, date, spend, high rate, low rate., open rate, volume, average close, average high, averageopenandaveragevolume.Itcontains“1257”rowsofdata.
Volume: 09 Issue: 10 | Oct 2022 www.irjet.net p-ISSN:2395-0072 © 2022, IRJET | Impact Factor value: 7.529 | ISO 9001:2008 Certified Journal | Page450
International
e-ISSN:2395-0056
Volume: 09 Issue: 10 | Oct 2022 www.irjet.net p-ISSN:2395-0072
STEP 2: Plot the obtained dataset and application of Min
– Max scaler. Plot the graph for the gathered dataset usingthe matplotlib library and get an overview of the data.
Using the Min – Max scaler function convert all the outputspresent in the dataset in a range of 0 to 1. 0 represents the smallest value and 1 represents the maximum value and restof the values present and adjusted between the given range.
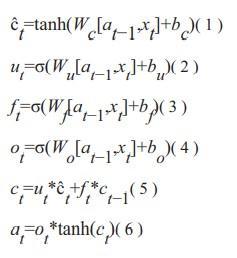
STEP 3: Splitting the dataset into test and train dataset. Splitting the dataset into test and train data is an important task. The data being time- series data cannot be distributedacross testing and training data randomly.Data used for training and testing Is distributed sequentially.
STEP4:Convertingthearrayintoadatasetmatrix.Convert the array into dataset matrixand reshape the same.
STEP5:ReshapingtheinputwhichisrequiredasperLSTM.
Youalwayshavetogiveathree-dimensionalarray as aninputtoyourLSTM network.Wherethefirstdimensionrepresents thebatchsize,theseconddimensionrepresentsthenumberoftime-stepsyouarefeedingasequence.Andthethirddimension representsthenumberofunitsinoneinputsequence.
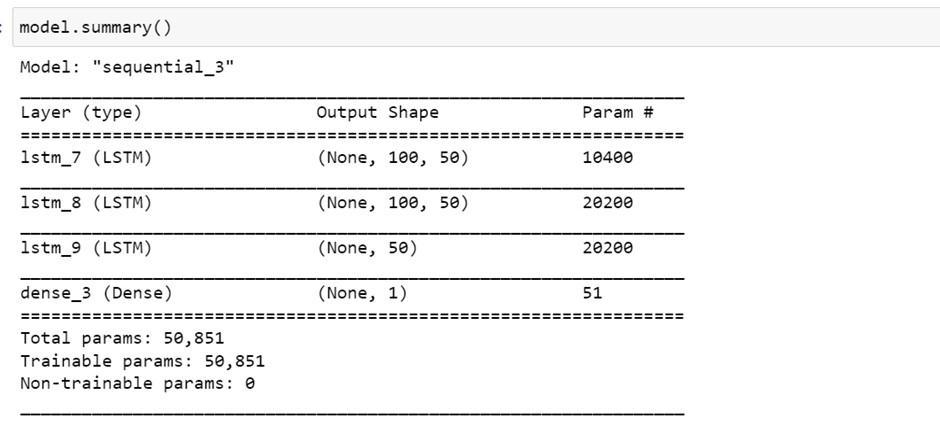
STEP 6: Creating a stacked LSTM Model
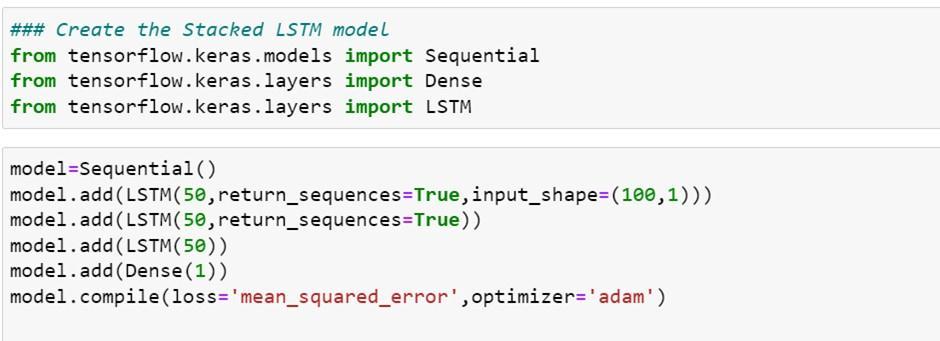
An LSTM model comprised of multiple LSTM layers.
STEP 7: Checking the model summary after training
STEP8:PredictingandcheckingtheperformancemetricsSTEP9:Calculating theRMSE (RootMean Square Error) Itisrequiredtojudgeamodel’sperformance,whetheritbeduringtraining,cross-validation,ormonitoringafterdeploy-ment
STEP 10: Plotting the predicted output
International Research Journal of Engineering and Technology (IRJET) e-ISSN:2395-0056
Volume: 09 Issue: 10 | Oct 2022 www.irjet.net p-ISSN:2395-0072
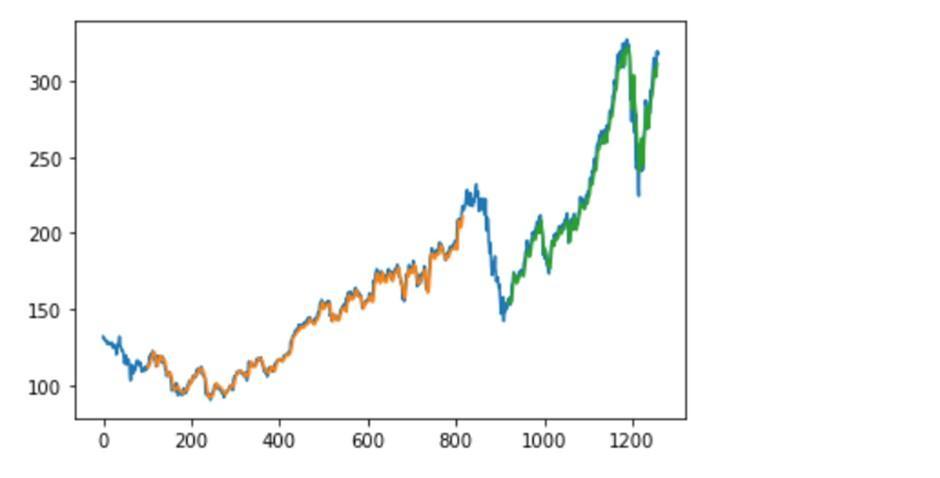
The result obtained after training a model using stackedLSTM is stated below:
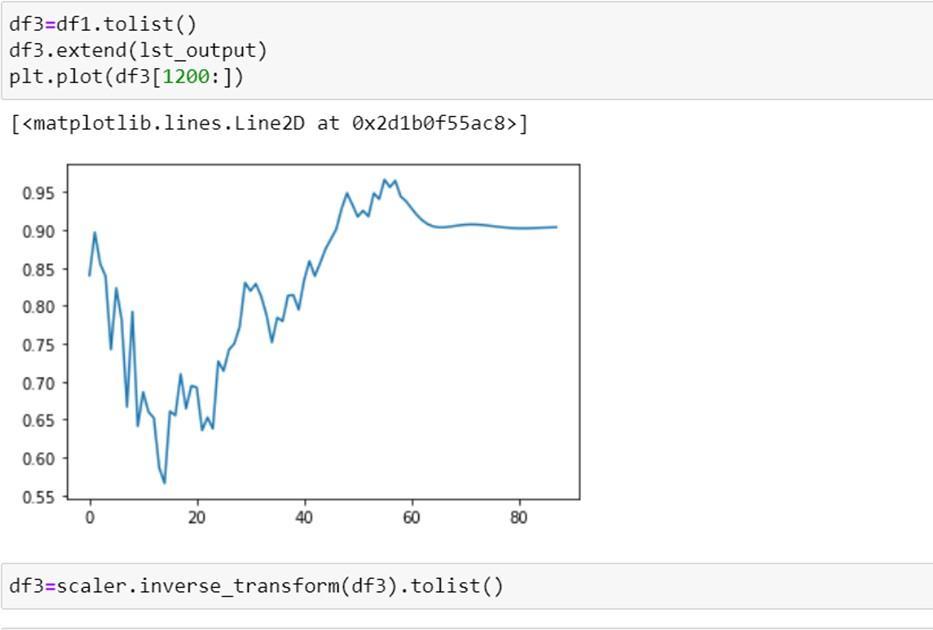
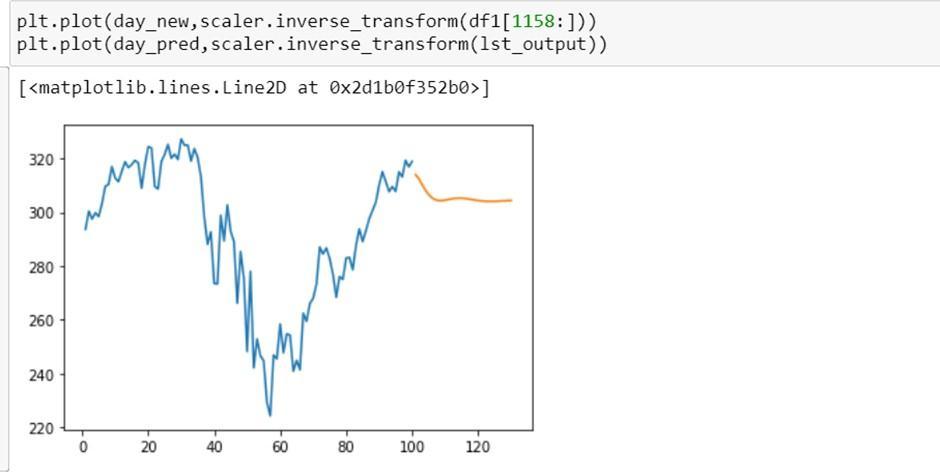
Comparisonofresultwiththeoriginaldataplottingtocheck the accuracy of the trained model in graphical format:
International
(IRJET)
e-ISSN:2395-0056
Volume: 09 Issue: 10 | Oct 2022 www.irjet.net p-ISSN:2395-0072
The LSTM model provides a better accuracy comparedto other models as stated by different authors, LSTM model was never used in the Supply Chain Management for model creation and prediction. We have created a Stacked LSTM model. It comprises of sequential layer, LSTM and DenseLayer. The total accuracy obtained after using LSTM model is84%. The datasetfetchedwasamediumsizeddataset,canusebigdatasettogetmoreaccurateresults.Theresultsobtained fromabove paperareforspendanalysis,alongwiththatwecanevenusepredictiveanalysisforDemandForecasting.
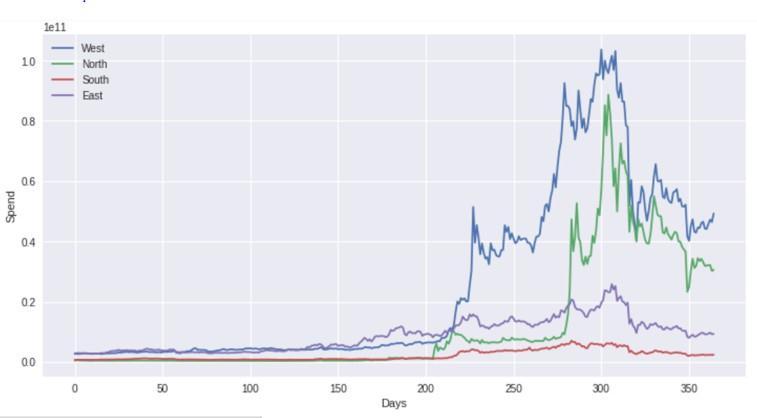
Theabovegraphshowsananalysisofspendineveryzone before and after the Covid Pandemic.Days after 200 showsthe peroid when the Covid Pandemic was in better control and the days starting from 0 shows the period when the pandemic was at its peak.
InvoiceTypes Accuracy Obtained Printed 92 Handwritten 84
The above table gives a proper representation of the typesof invoices trained and accuracy obtained after extraction of all the possible fields from the document.
The results obtained can also be used for:
• Calculation of percentage of mode which is used the most.
• The truck which is most in demand.
• Which industry uses the system most.
• In which areas the demand of truck is the most.
• Calculation of the amount saved by the company on everyorder
• Topredicthowmuchthecompanycansaveforotherordersbased on prediction model.
• Which area has the greatest number of transporters.
• Help transporters to gain more business.
International Research Journal of Engineering and Technology (IRJET)
e-ISSN:2395-0056
Volume: 09 Issue: 10 | Oct 2022 www.irjet.net p-ISSN:2395-0072
[1] Pham,XuanVy,etal.”Predictiveanalysisofthesupplychainmanage- mentusingMachinelearningapproaches:Review and Taxonomy.” 20205th International Conference on Innovative Technologies in Intelligent Systems and Industrial Applications (CITISIA). IEEE, 2020.
[2] Pełech-Pilichowski, T. ”On adaptive prediction of nonstationary and inconsistent large time series data.” 2018 41st International Conven-tion on Information and Communication Technology, Electronics and Microelectronics (MIPRO). IEEE, 2018.
[3] Sarah, Alkharif, Kyungyong Lee, and Hyeokman Kim. ”Lstm modelto forecast time series for EC2 cloud price.” 2018 IEEE 16th Intl Conf on Dependable, Autonomic and Secure Computing, 16th Intl Conf on Pervasive Intelligence and Computing, 4th Intl Conf on Big Data Intelligence and Computing and Cyber Science and Technology Congress (DASC/PiCom/DataCom/CyberSciTech).IEEE,2018.
[4] Siami-Namini, Sima, Neda Tavakoli, and Akbar Siami Namin. ”A comparison of ARIMA and LSTM in forecasting time series.”201817thIEEEInternationalConferenceonMachineLearningandApplications(ICMLA). IEEE, 2018.
[5] Marne,MrunalG.,etal.”Identificationofoptimalopticalcharacter recognition(OCR)engineforproposedsystem.”2018 FourthInterna-tionalConferenceonComputingCommunicationControlandAutomation(ICCUBEA). IEEE, 2018.
[6] Li, Yu, et al. ”Research on Improving OCR Recognition Based onBending Correction.” 2020 IEEE 9th Joint International InformationTechnologyandArtificialIntelligenceConference(ITAIC).Vol.9.IEEE,2020.
[7] Duth, Sudharshan P., and H. L. Rahul. ”Identification and Extraction of Text in Non-Blurred and Blurred Image Sequences.”20204thInternationalConferenceonIntelligentComputingandControlSystems(ICICCS). IEEE, 2020.
[8] Tseng, Ming-Lang, Kuo-Jui Wu, and Thi Thoa Nguyen. ”Information technology in supply chain management: a case study.”Procedia-Socialand Behavioral Sciences 25 (2011): 257-272.
[9] Wankhede, Poonam A., and Sudhir W. Mohod. ”A different imagecontent-based retrievals using OCR techniques.” 2017 internationalconferenceofelectronics,communicationandaerospacetechnology(ICECA). Vol. 2.IEEE, 2017.
[10] Munir, U., and M. O ztu rk. ”Automatic character extraction fromhandwrittenscanneddocumentstobuildlarge scaledatabase.”2019ScientificMeetingonElectrical-Electronics BiomedicalEngineeringand Computer Science (EBBT). IEEE, 2019.
[11] Khiari, Jihed, and Cristina Olaverri-Monreal. ”Boosting Algorithms for Delivery Time Prediction in Transportation Logistics.”2020Interna-tionalConferenceonDataMining Workshops(ICDMW).IEEE,2020.
[12] Mainkar,VaibhavV.,etal.”HandwrittenCharacterRecognitiontoObtainEditableText.”2020InternationalConferenceon ElectronicsandSustainable Communication Systems (ICESC). IEEE, 2020.
[13] Yuan, Wen-Jing, et al. ”Forecast of logistics demand based on greydeep neural network model.” 2018 International ConferenceonMachineLearning andCybernetics(ICMLC). Vol.1.IEEE, 2018.
[14] Gupta, Nitin, and Neha Goyal. ”Machine Learning Tensor Flow Based Platform for Recognition of Hand Written Text.” 2021InternationalConferenceonComputerCommunicationandInformatics(ICCCI).IEEE, 2021.
[15] Darapaneni, Narayana, et al. ”Handwritten Form Recognition Using Artificial Neural Network.” 2020 IEEE 15th International Conferenceon Industrial and Information Systems (ICIIS). IEEE, 2020.