International Research Journal of Engineering and Technology (IRJET) e-ISSN: 2395-0056

Volume: 09 Issue: 10 | Oct 2022 www.irjet.net p-ISSN: 2395-0072
International Research Journal of Engineering and Technology (IRJET) e-ISSN: 2395-0056
Volume: 09 Issue: 10 | Oct 2022 www.irjet.net p-ISSN: 2395-0072
M.Tech student, Dept. of Civil engineering, Mewar University, Rajasthan, India ***
Abstract - This study was carried out to analyze the quality of tap water available in public utility areas and determine its contaminants and compared with the Indian drinking water quality specifications IS-10500-2012. The samples were collected from Ajmer, Chittorgarh, Gangrar, Bhilwara, Kota, Bundi and Udaipur. The physico chemical parameters of the samples collected were found to be beyond permissible limits except for pH, sulphate and sodium in all of the stations. . After considering the physico- chemical analyses of the water parameters collected, it is determined that the water available for drinking is not safe and it needs immediate attention.
Key Words: Physico- chemical, Chittorgarh, Tap water, Nitrate, Public utilities
The majority of Indian consumes groundwater which is pumped via hand pumps from bore wells, dug wells and surface water sources such as rivers, streams, ponds and lake.Although86percenthasaccesstosafedrinkingwater accordingtocensusbutitseemsexaggeratedthatthecensus considertubewellsandhandpumpssafe.Whereas,studies have evidence that they are mostly the medium of waterbornediseases.
Due to the release of highly untreated industrialandpharmaceuticalwasteintothesurfacewater sources it becomes polluted with contaminants, making it unfittoconsume.MostpeopleinIndiaconsumewaterafter it boils as it tends to kill bacteria but in urban areas with highlydensepopulationitmakesevenaharderapproachto dothatandmoreoverpeopleprefertodrinkdirectlyfrom tapwhichareverylesslikelytreatedorfiltered.Accordingto 2011censusofsafedrinkingwateritstatesthatonly32%of India’shouseholdshaveaccesstotreattapwatersupplied through pipelines and around 11.5% gets untreated tap water. Out of the 32% getting treated tap water, there’s evidence that the water gets contaminated due to pipe leakage.
This thesis, explores the quality of tap water availabletopublicinpublicutilityareas,withrespecttoits presenceofminerals,contaminationsandotherproperties fromdifferentareasinRajasthandistrict.Thus,onthebasis ofevidencefromtheanalyses,thisthesisdemonstratesthe qualityoftapwateravailableforconsumption.
Peoplethroughoutthecountrysufferfromwaterborne diseasesandeitherthroughwatercontaminationorthrough unhygienicusageofwater.Indiaasacountrysuffersgreat lossesineconomyaswellasworkforceduetotheabsenceof people which gets caught up in the cycle of suffering from waterbornediseases.Thesupplyofpureandsafedrinking water is inadequate in the town areas and almost nonexistent in the rural areas. Again, due to chemical and bacteriological contamination of tap water either due pipe leakage or pollution near water catchment areas affects a largenumberofpeoplethusleadingpeopletotakedifferent alternatives such as buying and consuming bottled water. People take different routes such as buying filters and purifiers.
Ithasbeensaidthatpresenceofcontaminationofwater tendstoaffecttheodour,colour,appearanceortastecanbe evaluatedbyanyone,whichisnotentirelytrue.Inorderto findthequalityofthewateritneedstogoseveraltestsand watercannotbesaidsafeifitisnotbeenthroughteststhat determinesthesafetyofthewater.Therefore,consideringthe abovefactsit'sreallyimportanttomonitorthequalityand testoftapwaterthatpeopleconsume.
Anumberofworkshasbeencarriedoutonthesubject surroundingontapwateraroundtheworldandIndia.Ithas beenamajorconcernonthesafetyofdrinkingwaterandits causes to human health. Therefore, thisstudy ofliterature providestheinformationandprovideshelpsinsimilarstudy in future. Few studies related to the present study have studiedandtheirabstracthasbeenprovidedthoughithas notbeenfullyillustrated.
AccordingtoBureauofIndianStandard,(2019),asample testwascarriedoutfrom21majorcitiesofIndia,inwhich15 cities failed to meet the safety parameters of tap drinking waterbyoneormore.Amongthecities,Mumbaiwasfound to be the safest and Delhi the worst among the 21 cities. When the test was carried out, total dissolve solids (TDS), turbidity,totalhardness,totalalkalinity,minerals,metalsand presence of E Coli and coliform were found. These parameters can cause severe illness to human health and proper measures should be taken. One of the researchers
International Research Journal of Engineering and Technology (IRJET) e-ISSN: 2395-0056
Volume: 09 Issue: 10 | Oct 2022 www.irjet.net p-ISSN: 2395-0072
statedthatthewatersupplyofthoseareascannotbestopped asitwillcreatehugeproblemstotheresidentsoftheareas, sohesuggestedthatpropereffortshouldbedonetokeepthe tapwaterassafeaspossible.
Prajapati Dipak et al., (2018) studied the quality of tap water of selected cities in Ahmedabad city, assessing its chemicalandphysicalparametersanditwasallwithinthe permissiblelimit and it was found potable for drinking.In thisstudy,thephysicalandchemicalanalysisof10station samples were done in which parameters such as pH, Turbidity, TDS, TO, Total Hardness, TS, Chlorine, Fluoride concentrationandmicrobiologicalanalysiswereincluded.All of the parameters were within the maximum permissible limitofWHObutthereweresomedifferencesinTS,Chloride, Hardness and Fluoride. There was no form of coliform contaminationpresentinthewaterandfoundtobepotable.
Sanjay R Singh et al., (2015) studied the quality of tap drinking water in Visakhapatnam which was available in public utilities and it was found to be of poor quality and highlycontaminated.Inthisstudy,theparametersofpH,TDS, chlorides and E. coli count were analysed using standard methods from six sample stations which were highly populated utility areas. The physical chemical and microbiological analyse was carried out in this study. The parameterssuchasTDS,Chloride,pHwerefoundwithinthe permissiblelimitasspecifiedbyBIS105000.Butoutofthe sixsamples,fourofthemwithhighEColicountdfoundtobe contaminated.Thetwosampleswerealsofoundtobevery poorqualityandunfitfordrinking.
Water samples were collected in pre-cleaned polythene containers. Thecontainerswere pre-washed withchromic acid,rinsedindistilledwaterseveraltimesanddriedbefore use. When Physico-chemical analysis was carried out, polythenebottleswereusedforsamplingorstorage.After collectionofwatersample,itwas processedwithinonehour, incaseofdelay,thesampleshouldbestoredbelow10°Cand must be analyzed and processed within. Storage and preservationofthesamplesweredonefollowingstandard procedures (APHA, 1998). Parameters like pH and temperatureweredoneimmediatelyafterthecollectionof thesamples.Thecontainerswerefilledandtightlystoppered to avoid contact with air or prevent agitation during transportation.
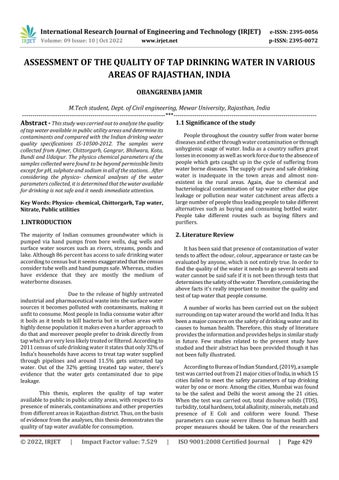
Sampleswerecollectedfromtapdrinkingwateravailableto publicfordrinkingandtheareawhichwerecloselylocated
nearmyuniversity.Thesampleswerecollectedfromsome selected areas of Rajasthan state such as Chittorgarh, Bhilwara,Kota,Gangrar,Udaipur,BundiandAjmer.
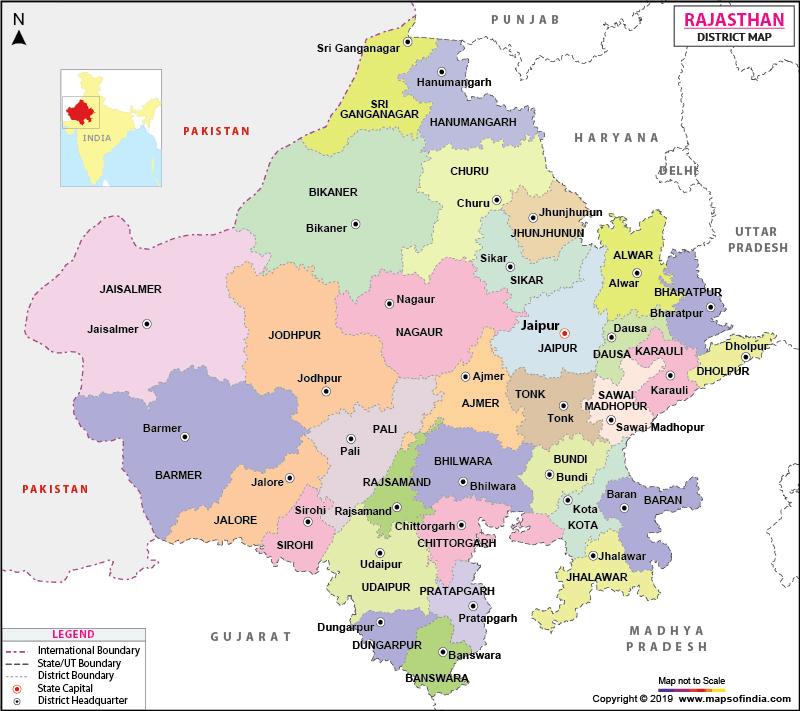
Fig3.1.aLocationsofthesamplestationsinRajasthanstate
Qualitywaterisvitaltothesocial,healthandeconomicwellbeingoftheprairiesanditspeople.Althoughweashumans recognizethisfact,wedisregarditbypollutingourrivers, lakes and oceans. Every effort should be made to achieve drinkingwaterqualityassafeaspracticable.Thelackofa source of clean drinking water is arising public health concernworldwide.Waterbornediseasesareaconsequence. Rapid increases in population over the past century have aggravated the pressure on existing water resources. A critical step in assuring the quality of drinking water resources is to identify the cause of current or potential contamination problems. The quality of potable drinking waterhasbeenamajorissueinthedevelopingnationsfor thelastfewdecades.Indiaiscurrentlyfacingcriticalwater supplyanddrinkingwaterqualityproblems.Watersupplies in India are no longer unlimited. In many parts of the country, water supplies are threatened by contamination and future water supplies are uncertain. The maximum minimum and average values of parameters for drinking wateraregivenbelowintableinwhichsomeexceedsthe permissiblelimits.
International Research Journal of Engineering and Technology (IRJET) e-ISSN: 2395-0056
Volume: 09 Issue: 10 | Oct 2022 www.irjet.net p-ISSN: 2395-0072
TableNo4.1.1:Themaximumminimumandaveragevalues ofparametersofthedrinkingwatersamples.
Parameters Maximum Minimum Average
Temperature - -pH 8.52 3.05 6.87 TDS(ppm) 2000 186 1286 Hardness(mg/l) 600 70 400 Calcium(mg/l) 440 28 160 Magnesium(mg/l) 993 63 360 Chromium(mg/l) 0.15 0.132 0.13 Iron(ppm) 0.34 0.22 0.24 Nitrate(ppm) 255 7.86 82.3 Fluoride(ppm) 5.12 0 0.61 Sulphate(ppm) 1.147 0.38 0.58 Sodium(ppm) 9.3 0.58 4.13 Potassium(ppm) 19.2 0.67 4.18
The Physico-chemical characteristics of water from 7 sampling stations from some of the main district of Rajasthanstate,Indiawasanalyzedinordertoassesstheir potability.
TableNo4.1.2:Dataofdifferentparameterscollectedfrom thewatersamples.
Parameters CH GA BH UD BU KO AJ Temperature ℃ 31 30 31 28 28 31 30 pH 7.9 8 7.31 6.05 7.25 7.36 7.30 TDS(ppm) 156 0 820 542 343 112 2 480 540
Hardness(mg/ l) 781 610 534 150 593 272 535
Calcium(mg/l) 442 344 215 61 234 107 215 Magnesium(m g/l) 995 550 482 136 530 245 480 Chromium(mg /l) 0.13 9 0.12 0 0.12 9 0.13 6 0.14 3 0.14 3 0.13 0 Iron(ppm) 0.23 3 0.23 2 0.21 3 0.26 0 0.26 0 0.23 2 0.23 5
Nitrate(ppm) 92.3 103 30 11.7 148 20.6 27 Fluoride(ppm) 0 0 0 0 0 0 0 Sulphate(ppm ) 0.23 3 0.24 8 0.51 0 0.5 0.5 0.5 0.50 7
Sodium(ppm) 3.1 2 2.3 0.97 2.7 0.97 2.2 Potassium(pp m) 3.7 3.5 13.3 3.1 6.6 3.1 18.6
CH=CHITTORGARH
GA=GANGRAR
BH=BHILWARA
UD=UDAIPUR
BU=BUNDI
KO=KOTA
AJMER
Temperature ℃ TDS(ppm) Calcium(mg/l) Chromium(mg/l) Nitrate(ppm) Sulphate(ppm) Potassium(ppm)
CHITTOR GANGRAR BHILWARA UDAIPUR BUNDI KOTA AJMER
Fig.4.1.aGraphicaldatarepresentationofeachsample stationanditsparameters.
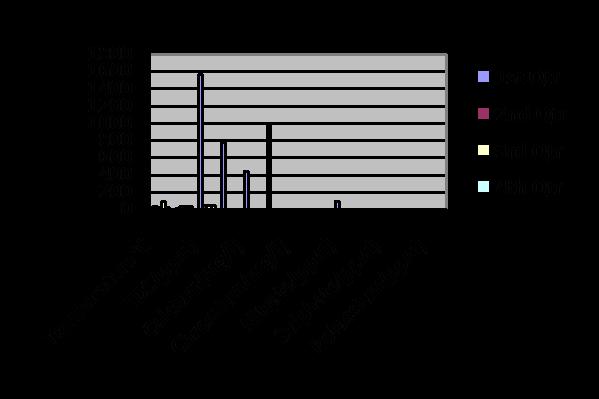
Fig.4.2.bVariationofparameterscollectedfrom Chittorgarh
4.2. Discussion
Resultsmentionedaboveinthetableandchartsshowsthe collectiveparametersobtainedafterexaminingthesamples oftapwatercollectedfromeachsites.
Temperature influences physical, chemical and biological qualities of water. In the present investigation water temperatureliesbetween28-31℃
International Research Journal of Engineering and Technology (IRJET) e-ISSN: 2395-0056
Volume: 09 Issue: 10 | Oct 2022 www.irjet.net p-ISSN: 2395-0072
It is important to monitor the pH of drinking water for several reasons. When a water source has a low pH, it is likely that there are other harmful contaminants in the water.AsthepHdecreasesandtheacidityincreases,fewer andfewerorganismscansurvive.Acidicwaterissynergistic, which means that a combination of a low pH and an increased concentration of certain substances is far more harmful than the sum of the parts. Acidic water can also cause problems for human consumption. While slightly acidic water is not dangerous, on its own, it can be quite dangerous when combined with other compounds. In the presentstudythepHvaluesinallsevensamplesrangefrom 6.05to8,whichareallwithinthepermissiblelimit.
TDSstandsfortotaldissolvedsolids,andrepresentsthetotal concentrationofdissolvedsubstancesinwater.TDSismade upofinorganicsalts,aswell asa small amountoforganic matter. According to the Bureau of Indian Standards on drinking water desirable limit of TDS is 500 mg/l, but in stations like Bhilwara, Udaipur, Kota and Ajmer the TDS levelisverylowwhichindicatesthatcertainmineralsmight belacking.
The hardness of water is determined primarily by the amountofcalciumandmagnesiumitcontains.Higherlevels of these and other minerals make water hard. Water softeningsystemswork byreducingtheconcentrations of mineralsfromthewater.Insteadofhavinghigherlevelsof calcium and magnesium, soft water tends to have higher concentrations of sodium, or salt. In the present study, hardness of water in Chittorgarh, Gangrar were found to exceed the permissible limits. Bhilwara, Bundi and Ajmer werealsofoundtobequitehigh.Althoughhardnessinlarger scalemightcauseproblemsbuthardwaterisnotahealth hazardandaccordingtoTheNationalAcademyofSciences states that drinking hard water contributes to the dietary needforcalciumandmagnesium.
Calciumisanimportantdeterminantofwaterharness,andit also functions as a pH stabilizer, because of its buffering qualitiesandCalciumalsogiveswaterabettertaste.Calcium is largely responsible for water hardness, and may negativelyinfluencetoxicityofothercompoundsandother elementssuchascopper,leadandzincaremuchmoretoxic insoftwater.InstationslikeKotaandUdaipurthecalcium levelsarelowandstationslikeGangrar,thecalciumlevelis high but in Chittorgarh, the calcium presence is very high whichexceedsthepermissiblelimitsandcancausevarious healthproblems.
Itisadietarymineralforhumans,oneofthemicroelements thatareresponsibleformembranefunction,nervestimulant transmission,musclecontraction,proteinconstructionand DNA replication and is an ingredient of many enzymes. Magnesiumandcalciumoftenperformthesamefunctions withinthehumanbodyandaregenerallyantagonistic.The presentstudyshowsthatthepresenceofmagnesiumisvery highinChittorgarhandquitehighinstationslikeGangrar andBundi.
Chromium is an odourless and tasteless metallic element. Chromium is found naturally in rocks, plants, soil and volcanic dust, and animals. EPA has a drinking water standardof0.1milligramsperliter(mg/l)or100partsper billion(ppb)fortotalchromium.Thisincludesallformsof chromium, including chromium-6. Water systems are requiredtotestfortotalchromium.Thechromiumlevelis highinallthestationsanditexceedsthepermissiblelimits soitshouldbetreatedcarefullybeforeconsumingtoavoid healthproblems.
Ironisfoundatconcentrationsgreaterthan10milligrams perliter(mg/L)or10partspermillion. Aslittleas0.3mg/l of iron in water can cause water to turn a reddish brown color.Ironismainlypresentinwaterintwoforms:either thesolubleferrousironortheinsolubleferriciron.Water containing ferrous iron is clear and colorless because the iron is completely dissolved. When exposed to air in the pressuretankoratmosphere,thewaterturnscloudyanda reddishbrownsubstancebeginstoform.Thissedimentis theoxidizedorferricformofironthatwillnotdissolvein water.Thisstudyshowsthattheironpresentinthewateris belowdesirablelevelsinallthestationsanditneedstobe monitored as it is not hazardous to health but it is considered a secondary or aesthetic contaminant and essentialforgoodhealthasithelpstransportoxygeninthe blood.
Nitrate(NO3)isacompoundofnitrogenandoxygenfound in nature and in many food items in our diet and the concentration of nitrates in the ground water is low. The mainadulthumanintakeofnitratesisfromfoodratherthan from water. Vegetables contain significant amounts of nitrateanddrinkingwaternormallycontributesonlyasmall percentageofourtotalnitrateintake.Lowlevelsofnitrates may occur naturally in water, sometimes higher levels, which are potentially dangerous to infants High nitrate levelsindrinkingwaterposeahealthrisktoinfantsbecause theymaycausemethemologlobinemia,aconditionknownas
International Research Journal of Engineering and Technology (IRJET) e-ISSN: 2395-0056
Volume: 09 Issue: 10 | Oct 2022 www.irjet.net p-ISSN: 2395-0072
the blue baby syndrome. Nitrate becomes toxic when it is reducedtonitrite,aprocessthatcanoccurinthestomachas wellasinthesaliva.Bundi,Gangrar,Chittorgarhhavehigh levels of nitrate and it should be monitored in order to preventhealthproblemsandrisks.
Drinkingfluoridatedwaterkeepsteethstrongandreduces cavities(alsocalledtoothdecay)byabout25%inchildren andadults.Mostwatercontainssomefluoridebutusually notenoughtopreventcavities.Communitywatersystems canaddjusttherightamountof fluoride tolocal drinking water to prevent cavities. The Environmental Protection Agency (EPA) has set a maximum amount of fluoride allowableindrinkingwaterof4.0mg/Lbecauselong-term exposure to levels higher than this can cause a condition calledskeletal fluorosis,inwhichfluoridebuildsupinthe bones. None of the stations showed any levels of fluoride whilestudyingthesamples.
Sulfate(SO4)canbefoundinalmostallnaturalwater.The originofmostsulfatecompoundsistheoxidationofsulfite ores,thepresenceofshales,ortheindustrialwastes.Itisone of the major dissolved components of rain. When a high concentrationofsulphateispresentinthewaterwedrink,it canhavealaxativeeffectwhencombinedwithcalciumand magnesium,thetwomostcommonconstituentsofhardness. Bacteria,whichattackandreducesulfates,formhydrogen sulfidegas(H2S).Afteranalysingthesamples,itwasfound tobewithinthepermissiblelimitsinallthestations.
Sodium is essential for normal functioning of the human body.Itcanbefoundinallbodytissuesandfluids,anditis notgenerallyconsideredharmfulatnormallevelsofintake from combined food and drinking water sources. It is essentialtomonitorthesodiumlevelbecauseifthelevelis high,onemightexperiencethingslikeconfusion,drowsiness, and headachesand can also result in hypertension (High Blood Pressure) and bradycardia (Low Heart Rate) if the pressureincreasesanditisalsotheelectrolytemostaffected by over hydration, leading to a condition called hyponatremia.Inthestudiedcarriedout,itwasfoundtobe withinthepermissiblelimits.
Potassium shortages are relatively rare, but may lead to depression, muscle weakness, heart rhythm disorder and confusion.Potassiumlossmaybeaconsequenceofchronic diarrhoeaorkidneydisease,becausethephysicalpotassium balanceisregulatedbythekidneys.Whenkidneysoperate insufficiently,potassiumintakemustbelimitedtoprevent
greaterlosses.ThepotassiumlevelsinAjmerandBhilwara washighbuttherestofthestationswerewithinpermissible limits.
Duetotheincreaseinindustriesandgrowthinpopulation, thewateravailablehavebeenbadlyaffectedanditleadsto criticalaspectsofhealthconcernsaswellasenvironmental impacts.Itshouldbestudiedandpropermeasuresshouldbe takeninordertoavoidfurtherproblemsinournearfuture. Inthispresentstudythetapwateravailablefordrinkingon publicfacilitiessuchasshops,restaurants,busstationsand railwaystationswhichwerelocatedonthevariousareasof Rajasthanstate,thewateravailabletopublicwasfoundtobe abovethepermissiblelimitsandsomebelowthedesirable limits.AccordingtothestandardsspecificationsofWHOand ISI,parameterssuchashardness,calcium,nitrate,potassium and chromium of the water samples were found to be exceedingthepermissiblelimitandparameterssuchasiron, TDSandfluoridewerebelowthedesirablelimitandshould bemonitoredtopreventhealthproblems. Sincethewater hasbeenprocessedandavailablefordrinking,theBODand DO quality of the water samples were neglected. The physico- chemical parameters of the tap drinking water available to the public in these areas were found to be contaminated and unsafe for drinking. Proper measures shouldbetakenandthewatershouldbetreatedproperly fromthesourceasthousandspeopledrinksthewaterona daily basis and it can lead to various health problems. Contaminants on the pipeline or leakage can also lead to contamination of the water so it should be monitored accordingly.
IwouldliketoexpressmysincerethankstotheChairmanof Mewar University, Rajasthan, HOD of civil department Dr. EsarAhmad,AssistantProfessor ShashivendraDulawatand all the civil department faculties for their support, encouragementandconstantcooperation onhelping with mystudy.
[1] APHA (American Public Health Association), (1998), Standard Methods for Examination of Water and Waste Water (1998), APHA, Public Health Association, American WaterWorksAssociationandWaterPollutionandControl Fed.,20thEdition.
[2]BrigitteWeymiller,RD,CD,CDE,2022,Waterthekeyto survival,GundersenHealthsystem.
[3]DavidL.OzsvathFluorideandenvironmentalhealth:a reviewRevEnvironSciBiotechnol2009.
International Research Journal of Engineering and Technology (IRJET) e-ISSN: 2395-0056 Volume: 09 Issue: 10 | Oct 2022 www.irjet.net p-ISSN: 2395-0072
[4]DIPAKKDASH,2019,Delhi'stapwaterismostunsafe, Mumbai'sbest:BIS.
[5]DrdipakkumarNatvarbhaiPrajapati,NirmalDesai,Nayan Jain,ModiHasmukh,2018,TapWaterAnalysisofSelected AreasofAhmedabadCity.
[6] DWAF (1998) quality of domestic water supply. AssessmentGuide1(2ndEd.). Departmentofwateraffair and forestry, Department of health and water research commission.
[7]Forman,D.,Al-Dabbagh,S.,andDoll,R.,(1985),Nitrates, nitritesandgastriccancerinGreatBritain.Nature.
[8] Goetz, C.A and R.C. smith 1959 evaluation of various methods and reagents for total hardness and calcium hardnessinwater.Lowastatej.sci.34:81[9]IndiaWater Portal,2021,Watercontaminationandpollution-Agrowing challengeforhealthandbiodiversity.
[10] Kushagra Dixit, 2022, Harmful chemical in tap water posesthreat:Study.
[11]MedicalNewsToday,2022,Benefitsofdrinkingwater.
[12] P Kumar, 2022, Prevalence and predictors of waterbornediseasesamongelderlypeopleinIndia:evidencefrom LongitudinalAgeingStudyinIndia,2017–18.
[13] Sanjay R Singh, S Sireesha, Prema M Latha, Gouru K Naidu, 2015, A study on drinking water quality at public utilitiesinVisakhapatnam,India.
[14] SHIKHAR FIRMAL, 2009, A study of water quality of NIT,Rourkela.
[15]ShivarajuH.P,2012,Assessmentof Physico-Chemical andBacteriologicalParametersAnalysisofDrinkingWater intheMysoreCity,India.
[16] Trivedi, M.H., Verna, R.J., Chinoy, N.J., Patel., R.S., Sathawara. N.G., 2007, Effect of high fluoride water on intelligenceofschoolchildreninIndia.
[17]UdayaMishraandVachaspatiShukla,2015,Provisions ofBasicHouseholdAmenitiesinIndia:AProgressReport.
[18]UNICEF,2017,Cleandrinkingwater-Ensuringsurvival andimprovedoutcomesacrossalloutcomesforeverychild.
[19]VladyslavV.Goncharuk,2014,DrinkingWater:Physics, ChemistryandBiology.
[20] WHO/UNEP GEMS, Global fresh water quality; published on behalf of the World Health Organization/United Nations Environment Programme, Oxford,BlackwellReference,1989.
[21] Yirdaw Meride & Bamlaku Ayenew, 2016, Drinking waterqualityassessmentanditseffectsonresidentshealth inWondogenetcampus,Ethiopia.