International Research Journal of Engineering and Technology (IRJET) e-ISSN: 2395-0056

Volume: 09 Issue: 10 | Oct 2022 www.irjet.net p-ISSN: 2395-0072
International Research Journal of Engineering and Technology (IRJET) e-ISSN: 2395-0056
Volume: 09 Issue: 10 | Oct 2022 www.irjet.net p-ISSN: 2395-0072
1 Professor, Department of Studies in Civil Engineering, University B.D.T College of Engineering,Davangere, Karnataka, India
2PG student, Department of Studies in Civil Engineering, University B.D.T College of Engineering,Davangere, Karnataka, India.
3Professor, Department of Studies in Civil Engineering, Proudadevaraya institute of technology Hospet, Karnataka. ***
Abstract - In this study, the ambient air quality is monitored near the Harihar taluk, Davangere district, and solid waste disposal site using a High Volume Air Sampler to measure parameters like Suspended Particulate Matter (SPM), Sulphur Dioxide (SO2), and Nitrogen Dioxide (NOX). From the observations made, the air quality index (AQI) is calculated at North, South, East, West, and some selected locations near the Harihar taluk, Davanger It has been noted that the suspended particulate matter concentration was considerably closer to the NAAQS requirements set for the industrial zone. Sulfur dioxide (SO2) and nitrogen dioxide (NO2) concentrations were within the guidelines set out by the NAAQS. Thus, the air quality indexfallswithintherangeof 0 to 50 AQI values, indicating that it is safe for employees to breathe there and that the air quality at the solid waste disposal site is good.
Key Words: Air Quality, Suspended Particulate Matter, SO2, NO2, NAAQS, AQI
Due to the presence of hazardous compounds in the atmosphere, which will influence human health and the healthofotherlivingthingsaswellaspossiblycontributing to climate change, air pollution is also known as air contamination.Pollutantscomeinavarietyofforms,suchas biomolecules, nitrous oxide, nitrous dioxide, methane, carbondioxide,chlorofluorocarbons,andcarbonmonoxide.
Variousillnesses,allergies,andevenhumanmortalitymay becausedbyairpollution.Thesearealsoharmfultoliving thingslikeanimals,crops,andtheenvironmentasawhole by producing ozone depletion, climate change, or adverse effectsonthebuiltenvironmentlikeacidrain.Airpollution mayresultfrombothnaturalprocessesandhumanactivity.
Developing a plan for reducing pollution thatiscreatively focused on protecting public health requires more informationthansimplyknowingwheretheunusualhealth effectsin terms oftypeand expected numberof casesare due to pollution. This information may be necessary to
satisfyandencouragedecisionsthatmaybemoreexpensive andinvolvealargeramountofthecommunity.
The effectsofairpollution onhealtharetheoutcome ofa complicated series of physical, chemical, behavioral, and physiological processes. Pollutants are released into the atmosphereastheinitiallinkinthechain,wheretheymix and disperse, resulting in a diverse geographical and temporaldistributionofconcentrations.Whenpollutantsare transported through the air, they go through a number of chemicalandphotochemicaltransformations.
At the same time, people conduct their daily activities. People in Europe spend 80 to 90 percent of their time indoors. The bulk of these buildings are homes, places of employment, and industrial settings, all of which may be causesofairpollutionintheirownright.Evenhomeshave their own internal sources of air pollution, including the materialsusedinconstructionandeverydayactivitieslike heating,cooking,andindulginginhobbies.
Monitoringofambientairqualityprimarilyfocusesonthe levelsofoutsidepollutants.Multipletime-activitypatterns andmicroenvironmentsinfluencepersonalexposure.Asa resultofexposuretoexternalpollution,thedosedeliveredto a person's lungs affects the dose delivered to the various targetinternalorgans.Theamountofthepollutantabsorbed by the various biological systems, the intensity of the pollutant or its derivatives, as well as immunological condition,thereforedefinetheindividualhealtheffects.Asa result, the monitoring statistics at best only allude to the potentialforharmfulhealtheffects.Evenwhileexposureisa solidpredictorofhealthrisks,differentpeoplewhohavehad the same level of exposure may get different doses of the same pollutant and may have distinct health effects. To understandwhysensitivepeoplerespondmorestrongly,it isimportanttoinvestigatehowmuchvariousdemographic groups especiallyfragileoneslikeyoungsters,theelderly, andpeoplewithdisabilities areexposedto.Thisinvolves analyzing human time-activity patterns and micro environmental concentrations for distinct demographic groupings.
International Research Journal of Engineering and Technology (IRJET) e-ISSN: 2395-0056
Volume: 09 Issue: 10 | Oct 2022 www.irjet.net p-ISSN: 2395-0072
Tocomparetheconcentrationlevelssuspended particulate matterof air pollutants with the nationalambientairqualitystandardsatthesolid wastedisposalsiteinHariharTaluk,Davangere District.
Tocomparetheconcentrationlevelsofgaseous pollutantsincludingSulphurdioxideandnitrogen dioxide with the national ambient air quality standardsatthesolidwastedisposalsiteinthe HariharTaluk,DavangereDistrict.
Calculating the Air Quality Index based on the measurements of Sulphur Dioxide, Nitrogen Dioxide, and Suspended Particulate Matter and comparingtheAQIvaluestoNAAQS
Theatmospherestoresanddistributesthecontaminant whichhavebeenreleasedintoit,anditisthisfunction whichisofinterestinairpollution.Thebehaviorof atmospheredetermineswhetherthepollutionreleased intoitwillremainaroundusorshallbeblownaway.The atmosphereisamixtureofgasessurroundingtheearthin severallayersofvaryingthicknessanddensity.
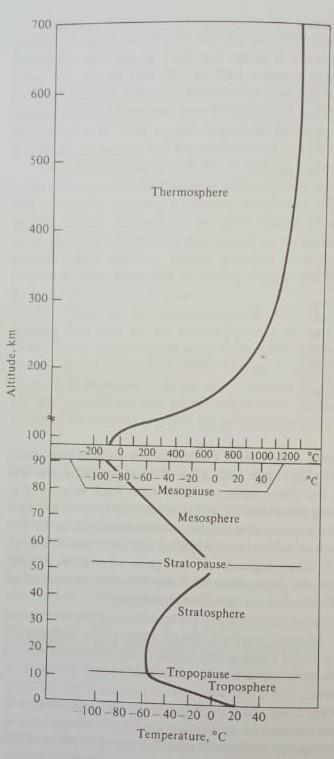
The layer nearest to the earth is called as troposphere, whichextendsformtheearthsurfacetoabout10-12km.in general, the atmosphere is not heated by the sun’s rays, rather is heated from below by the warm earth. Temperature,therefore,decreasewithaltitudeinthislayer alongwithdecreaseinthedensityandpressureofgases.The lower troposphere up to 2km is of most interest in an air pollutionmeteorologyshowninthefigure.About80%ofthe massofatmosphereiscontainedintroposphere.
itiscrucialtodoresearchonIndia'sairqualityanddevelop regulationstolessenairpollution.
2.2
Fig1:TemperatureProfileofEarth’satmosphere
Valuesforambientairqualities,whichoftenrefertooutside air, represent air pollution concentrations. The guidelines areestablishedforavarietyofgoals,includingplanningand other purposes, as well as uses related to human health, building,agriculture,plants,andecosystems.TheWHO,the EU,andtheUSEPAarejustafewoftheorganizationsthat haveprovidedstandards.Thesecriteriaaretypicallybutnot alwaysidentical,despitethefactthattheyareofferedforthe samegoal.Anynumericalstandardsmusttakeintoaccount theaveragetime,unit,andstatisticalmetrics.Withoutthis, there is no common basis for a given criteria, making it ambiguousorevenuseless
Thefollowingarethemainaccessoriesfordeterminingthe concentrationofparticulatematterPM10 inanambientair.
• Weighingbalance
International Research Journal of Engineering and Technology (IRJET) e-ISSN: 2395-0056
Volume: 09 Issue: 10 | Oct 2022 www.irjet.net p-ISSN: 2395-0072
• High volume air sampler with the size selective inlet for the particulate matter( PM10) and volumetricflowcontrol
• Caliberatedflowmeasuringdevicetocontrolthe airflow
Reagents/chemicalsfiltermedia-Whatman filterpaperofsize(8*10in)size

A potassium tetracholoromercurate solution absorbs Sulphurdioxidefromtheair(TCM).
A dicholorosulphitomurcurate compound is synthesized, which is prone to oxidation by atmospheric oxygen. The absorber solution may be stored for a while until testing because, once generated, this complex is unreactive to strong oxidants such as ozone and nitrogen oxides. To producethebrightlycoloredpararosaliniemethlysulphonic acid,theproductisallowedtomixwithpara-rosanilineand formaldehyde. A calibrated spectrophotometer is used to quantifythesolution'sabsorbance.
The monitoring and quantification of Sulphur dioxide in ambientairhavetohavethefollowing:
Weighingbalance
Vacuum pump: Capable of maintaining an air pressuredifferentialgreaterthan0.7atmosphere atthedesiredflowrate
Calibratedflow-measuringdevicetocontrolthe airflow
Absorber:allglassmidgetimpinge
Spectrophotometer: Able to measure the absorbanceofasampleat560nm
Initiallythefilterpaperisnoticedforanydamagesandthe identificationcodeoffilteriswrittenoverthefilterpaper. Dry the filter in a conditioning environment or in a desiccatorforabout24hours.Notedowntheinitialweightof the filter paper using a weighing balance. Detach the faceplate,takeoutthefaceplateandthewingnuts.Loosen thefilterfromitsjacketandpositionitsothatitsroughside isfacinguponthesupportscreen.Thenstarttheinstrument for 8hours. Note down the flowrate on hourly basis. Note downthetimeforsamplingandmedianflowrate.Laterdry the filter paper in a conditioning environment or in a desiccator for 24hours. Weigh the filter in a weighing balanceandnotedowntheweightofthefilterpaper.Now using the formulae determine the concentration of the particulatematter.
ModifiedWestandGeakemethod(IS5182part2methodof measurementofairpollution:SO2
Glasswares:lowactinicglasswaremustbeused foranalysis
Reagents/chemicals
Distilledwater
Mercuricchloride
Sodiumchloride
EthyleneDiaminetetraaceticAcidDiSodiumsalt
Sulphamicacid
Formaldehyde
Pararosaniline
SamplingandanalysisofSulphurdioxideinanambientair
Sampling
Absorbing reagent: 0.04Molarity Potassium tetrachloromercurate (TCM) - Take 10.86g of Mercuricchloride(HgCl2)inwateradd0.0066gof Ethylene diamine tetra acetic acid and 6.0g of
International Research Journal of Engineering and Technology (IRJET) e-ISSN: 2395-0056
Volume: 09 Issue: 10 | Oct 2022 www.irjet.net p-ISSN: 2395-0072
SodiumChlorideinawaterandmakeupto1litre inavolumetricflask.ThepotentialofHydrogen ofthissolutionshouldbenearlyequalto4.0,.
30ml of absorbing solution must be poured in an impinge,andsamplesmustberetrievedeachhourata flowrateof1L/min.Aftersampling,checkthesample's volumeandmoveittoabottleforstorage.
After sampling measure 10ml of aliquot sample in a 25ml volumetric flask. Mix 1ml of Sulphamic acid allow it for about 10minutes. Mix 2ml of Formaldehyde and 2ml of Pararosalinine. Diluteitupto25mlusingdistilledwater.Itallowed to go through the reaction for about 30minutes. Make use of distilled water to adjust the Spectrophotometertothezeroreading.Adjusting thewavelengthto560nmquantifytheabsorbance ofasolution.Laterusingtheformulaecalculatethe concentrationofSO2.
(Modified Jacob and Hochheiser method)
ThemonitoringandquantificationofNitrogendioxidein ambientairhavetohavethefollowing
• Weighingbalance
• Vacuumpump:Capableofmaintainingavacuum ofatleast0.6atmacrosstheflowcontroldevice.
• Calibratedflowmeasuringdevice:Tocontrolthe airflowfrom0.2to1L/min
• Spectrophotometer which is having capacity of quantifyingabsorbanceat540nminstalledwith 1cmpathlengthcells.
Reagents
• Distilledwater
• Sodiumhydroxide
• Sodiumarsenite
• Hydrogenperoxide
• Sulphanilamide
• NEDA (N-(1-naphthyl) Ethylene diamine Dihydrochloride)
30 mL of absorbent solution must be introduced in an impinge.For4hours,gathersamplesatflow rateof 0.2-1 L/min.Assessthesamplevolumeaftersampling,and now putitinabottleforpreservation.
To recover the water which is evaporated during the sampling,mixdistilledwateruptothecalibrationmark,and carefullystir.
Latertake10mlofaliquotsampleina50mlvolumetricflask. Introduce 1ml of Hydrogen peroxide and 10ml of Sulphanilamideand1.4mlofNEDAallowittoreactforabout 10minutes now adjust Spectrophotometer to zero using distilled water and quantify the absorbance at 540nm wavelength and now using the formulae calculate the concentrationofNitrogendioxide.
Table2:-ValuesoftheAQIinrespectedareasduringthe monthofApril,MayandJune
Sl no Locationsof solidwaste disposalsite
AQIvalue duringthe monthof March
AQI value during the monthof April
AQIvalue during the monthof June
1 NORTHZONE 36.06 29.89 35.7 2 EASTZONE 32.2 29.49 31.8 3 SOUTHZONE 32.9 31.7 32.07 4 WESTZONE 29.7 31.3 29.4
5 500maway fromtheSWD site
6 1.5kmaway fromtheSWD site
27.42 26.4 27.14
30.65 24.36 30.35
To finish this investigation, it was determined the concentrationsofSPM,SO2,NO2,andAQIatthe6selected locations at the Harihar taluk's clean solid waste disposal facility.Theconclusionsderivedfromthedataandoutcomes arediscussedinthischapter.
International Research Journal of Engineering and Technology (IRJET) e-ISSN: 2395-0056
Volume: 09 Issue: 10 | Oct 2022 www.irjet.net p-ISSN: 2395-0072
Based on the locations, it can be assumed that duringthemonthsofApril,May,andJunetheSPM agglomeration is closer to the limits of SPM prescribedbytheNAAQSinanindustrialzoneand isthereforequiteharmfultotheworkerswhoare workingclosetothelandfillsiteofHarihartaluk.In all locations during the months of April, May and JunetheSO2andNO2valueswerewithintheNAAQS permissiblelevels.
8) Tanushree Ganguly, KurinjiL.Selvaraj., “Review andOutlookofCleanAirandActionPlans”.
The NAAQS allowed limits for SO2 and NO2 were metinallsitesthroughoutthemonthsofApril,May, andJune.
The solid waste disposal site is severely contaminatedbySPM,makingitunpleasantforthe employees and leading to a range of health concerns.
1) Archontoula Anitha K.G, Cynthia Carolin. (2015), “Assessment ofAir QualityofDavangere City-A Case Study, ISSN; 2321-0869(O) 24544698(P),Volume-3,Issue-8.
2) Chalouakou, Georgios Gravis. (2012), “Neural NetworkandMultipleRegressionModelsforPM10 PredictioninAthens;AComparativeAssessment”, Journal of the Air and Waste Management Association.
3) Gowtham Sarella.,(2015), “AmbientAirQuality AnalysisusingAirQualityIndex“ACaseStudyof Vapi”, International Journal for Innovative ResearchinScienceandTechnology,Vol(1),pp:01.
4) Mohammad Shakir, N. Rakesh., “Investigationon AirQualityPollutantDataSetsusingDataMining Tool”,IEEEXplorePartNumber:CFP180ZV-ART; ISBN;978-1-5386-1442-6
5) Nidhi Sharma and Shwetha Taneja.,(2018), “ ForecastingAirPollutionLoadinDelhiusingData AnalysisTools”,ScienceDirect,1321077-1085
6) Radhika M Patil and H. T Dinide (2020), “A Literature Review on Prediction of Air Quality IndexandForecastingAmbientAirPollutantsusing MachineLearningAlgorithm’s”.
7) R Gunasekaran, K. Kumarswamy., (2012) “MonitoringofAmbientAirQualityinSalemCity, Tamil Nadu”, International Journal of Current Research,ISSN:0975-833X,Vol.4,Issue03,andpp: 275-280.