International Research Journal of Engineering and Technology (IRJET) e-ISSN: 2395-0056

Volume: 09 Issue: 10 | Oct 2022 www.irjet.net p-ISSN: 2395-0072
International Research Journal of Engineering and Technology (IRJET) e-ISSN: 2395-0056
Volume: 09 Issue: 10 | Oct 2022 www.irjet.net p-ISSN: 2395-0072
1 Kerala Forest Research Institute. Peechi, Thrissur, Kerala, India
2 Department of Geology and Env Science, Christ college Irinjalakuda, Kerala, India ***
Abstract - In recent years mankind has faced the most disastrous climatic events such as high (and low) temperatures, very heavy rainfall, and very high wind speeds. The major reason behind all these events is the changes we made on the earth’s surface. Increased anthropogenic activities and unscientific land use methods are collapsingthe natural land cover system. These Land cover and land use (LCLU) changes induced by human and natural processes play a major role in global as well as regional scale patterns of the climate and biogeochemistry of the Earth system.
The present study involves the assessment of extreme climatic events in Chalakudy. The study area, Chalakudy is a municipal town situated on the banks of the Chalakudy river in Thrissur District of the Kerala State in India. In recent years different regions of the study area have experienced extreme climatic events such as high temperatures, very heavy rainfall, and very high wind speeds. On October 2nd, 2018 there was a destructive wind in Chalakudy town that ends with nonstop rain nearly for two hours. On August 15 and 16, 2018 there was heavy flooding in Chalakudy. Along with these extreme climatic events, studies have shown that the study area is vulnerable to earthquakes. On 18 September 2007, there was an earthquake of magnitude 1.6.
Key Words: Geographicinformationsystem(GIS),LandUse LandCover,NDVI,LST,LSE,ABT,etc.
These studies have shown that there remain only a few landscapesonEarththatarestillintheirnaturalstate.Due tochieflyenvironmentalpollutionandpollutantsactivities, theEarth'ssurfaceischangingdramaticallyinsomewayand humanpresenceonearthanditsuseoflandhaveaprofound effect on the natural environment, thereby resulting in an observable pattern of land use/land cover over time. The study of land use/land cover (LULC) changes is very important for proper planning and utilization of natural resourcesandtheir management.Traditional methodsfor gathering demographic data, censuses, and analysis of environmentalsamplesarenotadequateformulticomplex environmental studies, since many problems are often presentedinenvironmentalissuesandthegreatcomplexity ofhandlingthemultidisciplinarydataset;werequirenew technologieslikesatelliteremotesensingandGeographical InformationSystems(GIS).Thesetechnologiesprovidedata
tostudyandmonitorthedynamicsofnaturalresourcesfor environmentalmanagement.
Remotesensinghasbecomeanimportanttoolapplicableto developingandunderstandingtheglobal,physicalprocesses affectingtheearth.GISisanintegratedsystemofcomputer hardware and software capable of capturing, storing, retrieving, manipulating, analyzing, and displaying geographically referenced (spatial) information to aid development-oriented management and decision-making processes. Remote sensing and GIS have covered a wide range of applications in the fields of agriculture, environments,andintegratedeco-environmentassessment. SeveralresearchershavefocusedonLU/LCstudiesbecause of their adverse effects on the ecology of the area and vegetation.
Everyyear,disastersrelatedtoweather,climate,andwater hazardscausesignificantlossoflifeandsetbackeconomic and social development over years. The term extreme weathereventreferstoanoccurrenceofavalueofaweather orclimatevariablebeyondathresholdthatliesneartheend oftherangeofobservationsforthevariable.Itisaweather eventthatisunusuallyintenseorlong,occasionallybeyond whathasbeenexperienced before.Examplesincludevery high (and low) temperatures, very heavy rainfall (and snowfallincoldclimates),andveryhighwindspeeds.The study involves the assessment of probable impacts of extremeclimaticeventsinChalakudy.
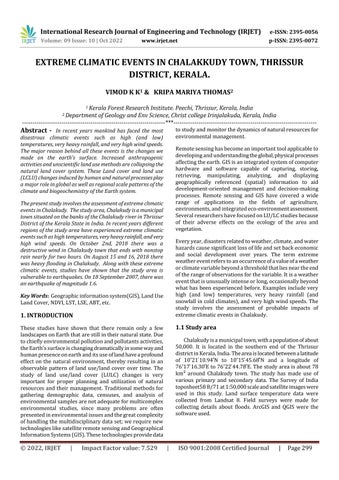
Chalakudyisamunicipaltown,withapopulationofabout 50,000. It is located in the southern end of the Thrissur districtinKerala,India.Theareaislocatedbetweena titude f t d a gitude f t Thestudyareaisabout78 km² around Chalakudy town The study has made use of various primary and secondary data. The Survey of India toposheet58B/71at1:50,000scaleandsatelliteimageswere used in this study. Land surface temperature data were collected from Landsat 8. Field surveys were made for collecting details about floods. ArcGIS and QGIS were the softwareused.
International Research Journal of Engineering and Technology (IRJET) e-ISSN: 2395-0056
Volume: 09 Issue: 10 | Oct 2022 www.irjet.net p-ISSN: 2395-0072
The study of earthquakes in Kerala provided information about historical incidents. The studies have shownthattherewasanearthquakeon18September2007 and there are two epicenters within the boundary of the studyarea.Thegeoreferencedlocationswerebroughtinto themaplayerinArcGIS.
Theareaconsumedbyhuman-madeinfrastructures such as buildings, roads, railways, etc. were added to the maplayertocreateabuilt-updensitymap.Itwasmadeto analyzetheearthquakevulnerabilityofthestudyarea.
Pagination anywhere in the paper. Do not number text heads-thetemplatewilldothatforyou.
Finally, complete content and organizational editing before formatting. Please take note of the following items whenproofreadingspellingandgrammar.
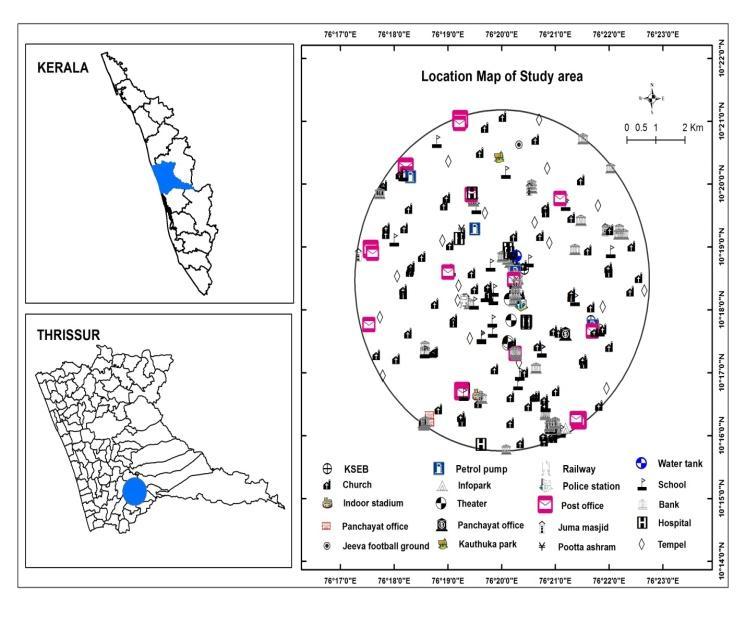
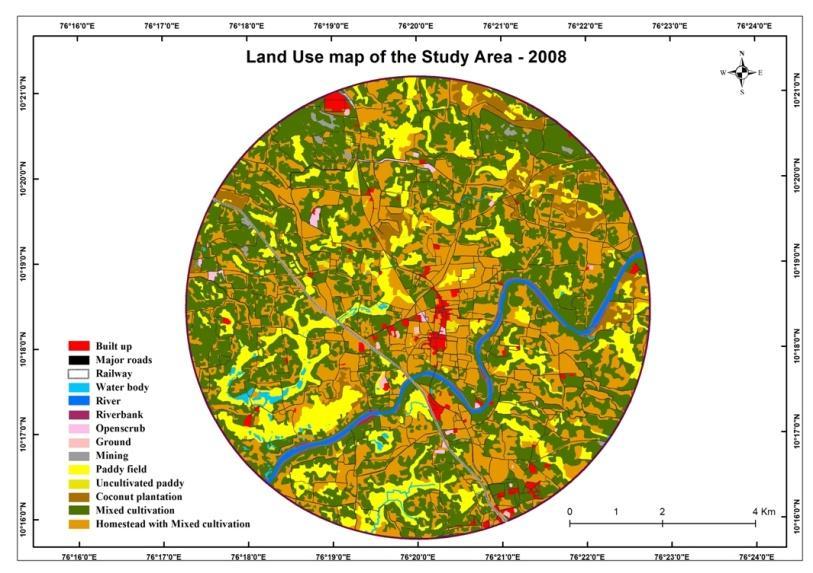
Using ArcGIS, the buffer zone of radius 5Km from Chalakudytownwasmarked.TheSurveyofIndiatopsheet 58b71at1:50,000scaleisusedtoprepareabasemap.QGIS isusedforextractingthelanduse/landcoverlayers,ofthe years2008and2018fromsatelliteimageries.
Inthepresentstudy,TIRbands10and11wereusedto estimatebrightnesstemperature,andbands4and5were usedtogenerateNDVIofthestudyarea.Satellitedataover theChalakudyregionofMarchyears2016,2017,2018,and 2019 have been used in this study. Landsat 8 provides metadataofthebandssuchasthermalconstant,rescaling factorvalue,etc.,whichcanbeusedforCalculationslikeLST.
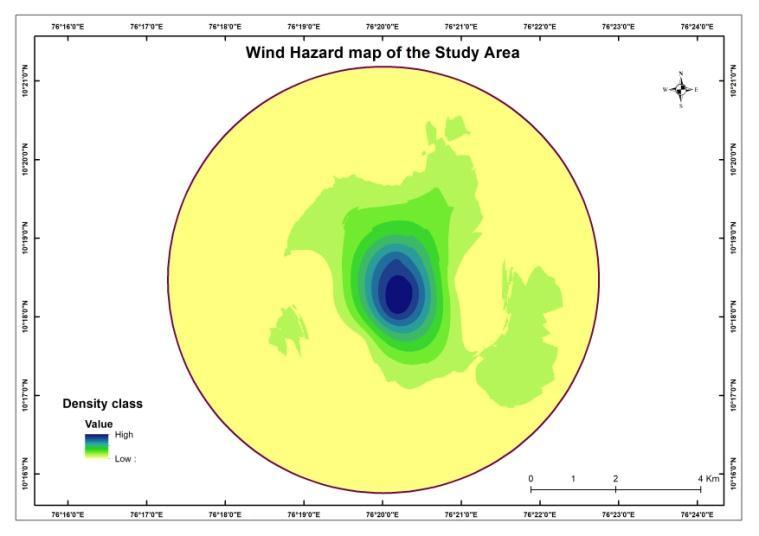
TheGPSlocationsoftheaffectedareaswerecollected during the field survey. The affected regions were categorizedintoclasseshavingdescendingvaluesoutof10 according to wind intensity. The highly affected regions comeunderthevalue10.
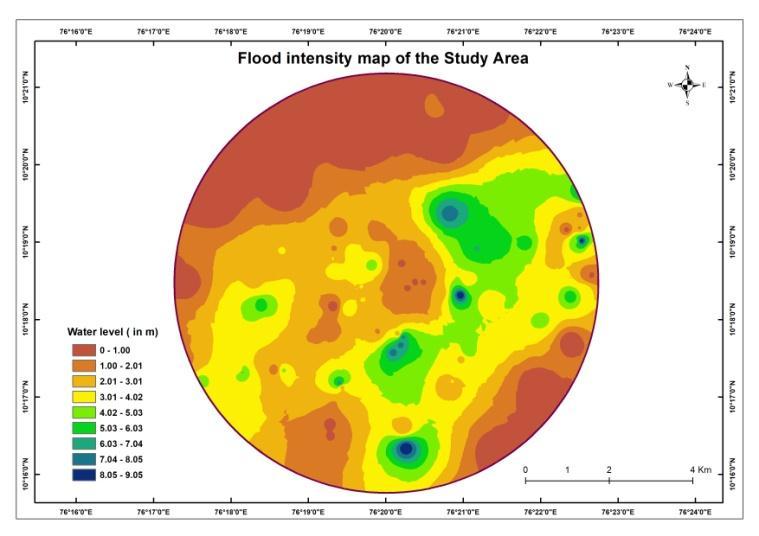
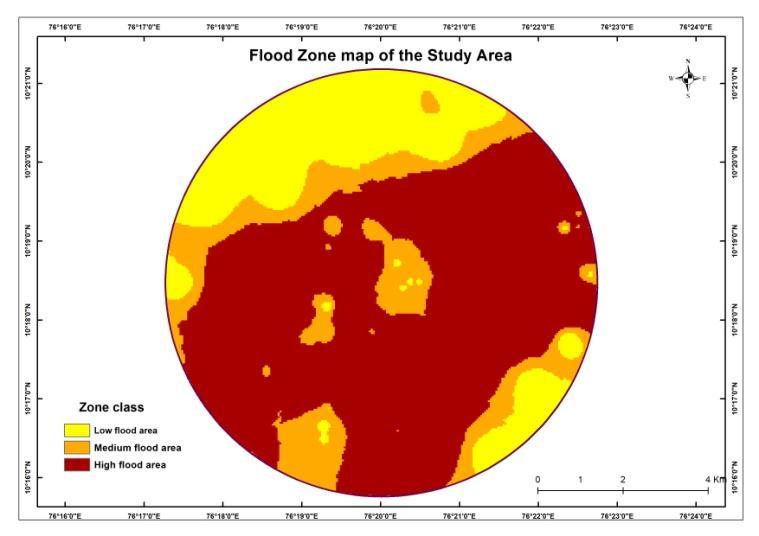
Asurveyofthefloodwasconductedtocollectthewater levels.Afloodintensitymap waspreparedusingthisdata and according to flood intensity, the study area was classifiedintothreezones,i.e.highfloodzone,mediumflood zone,andlowfloodzone.
2.1 Land Use Land Cover Change Analysis 2008 to 2018.
Whenitcomesto2018,themajorchangeshaveoccurredin the classes of mixed cultivation, homestead with mixed cultivation,paddyfield,majorroads,andbuilt.Thechange thatsoccurredinthemixedcultivationandpaddyfieldsis noticeable.In2008theareacoveringmixedcultivationwas about3122.3hawhichthendeclinedto1852.68hain2018. Paddy fields covered 1132.7ha of the total area in 2008 whileitisonly848.16hain2018.Thisdeclineisassociated withtheconversionofpaddyfieldsintococonutplantations andmixedcultivation.Theincreasedpopulationtriggered theconstructionofhomesteadsinvegetatedareas.Thereisa remarkableincreaseinthecontributionofhomesteadswith mixed cultivation in 2018. HMC covered 2604.7ha of the total area in 2008 which then increased to 3828.77ha in 2018. In 2008 the contribution of built-ups was only 117.89hawhichis1.50%ofthetotalareawhileitisabout 338.42ha(4.31%)in2018. Thesebuilt-upsareconcentrated in Chalakudy town In 2008 the area used by roads was 274.75ha(3.46%)whichincreasedto455.34ha(5.80%)in 2018.Anothernoticeablechangeisseeninthe number of water bodies. The 83.38ha of water bodies reduced to 52.33hain2018.
International Research Journal of Engineering and Technology (IRJET) e-ISSN: 2395-0056
Volume: 09 Issue: 10 | Oct 2022 www.irjet.net p-ISSN: 2395-0072
Table -1: Land use land cover during 2008
Sl.No Category
Area (Ha.) Percentage of total area
1 Builtup 117.89 1.50 2 Major roads 274.75 3.46 3 Railway 10.64 0.18 4 Waterbody 83.38 1.06 5 River Waterbody 1.54 6 Riverbank 39.63 0.50 7 Openscrub 34.68 0.44 8 Ground 11.56 0.15 9 Mining 26.98 0.27 10 Paddyfield 1132.7 14.43 11 Uncultivatedpaddy 29.14 0.37 12 Coconutplantation 242.7 3.09 13 Mixedcultivation 3122.3 39.76 14 HomesteadwithMixed cultivation 2604.7 33.25 Total 7852.26 100.00
9 Mining 27.96 0.36 10 Paddyfield 848.16 10.80 11 Uncultivatedpaddy 121.39 1.55 12 Coconutplantation 118.65 1.51 13 Mixedcultivation 1852.68 23.59 14 HomesteadwithMixed cultivation 3828.77 48.76 Total 7852.26 100.00
Table -3: LST temperature ranges and areas for the month of March 2016
Sl.No Temperature (°C) Area (Ha) Percentage (%)
1 23.42-25 165.66 2.11 2 25-30 1405.66 17.90 3 30-35 6257.17 79.69 4 35-38.43 23.77 0.30 Total 7852.26 100
Table 2 : Land use land cover during 2018
Sl.No Category
Area (Ha.) Percentage of total area
1 Builtup 338.42 4.31 2 Major roads 455.34 5.80 3 Railway 10.64 0.14 4 Waterbody 52.33 0.67 5 River 128.62 1.64 6 Riverbank 24.3 0.31 7 Openscrub 32.5 0.41 8 Ground 12.5 0.16
LST temperature ranges and areas for the month of March. 2016
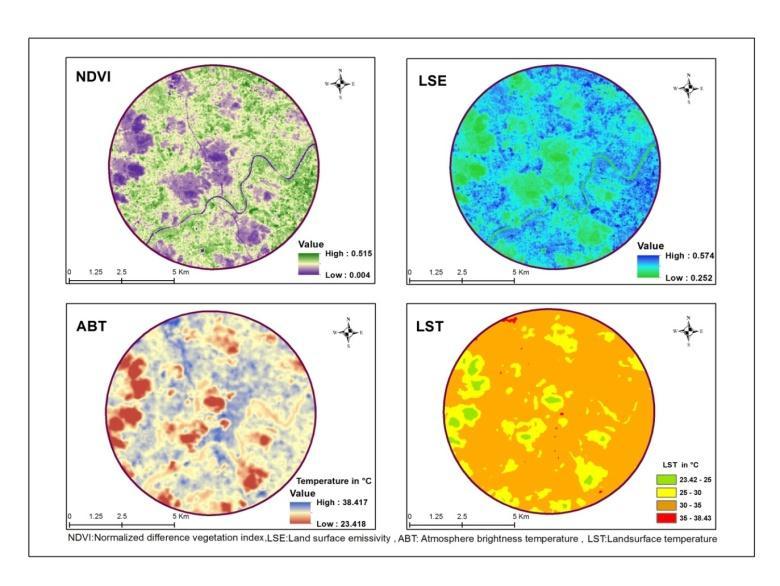
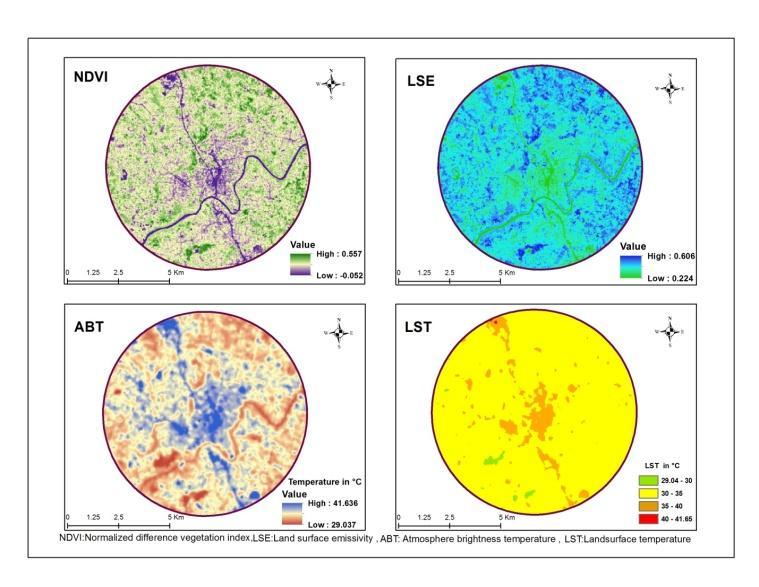
Table -4: LST temperature ranges and areas for the month of March 2017
Sl.No Temperature (°C) Area (Ha) Percentage (%)
1 25.57-30 1023.69 13.04 2 30-35 6540.91 83.30 3 35-40.21 587.66 3.66
Total 7852.26 100
International Research Journal of Engineering and Technology (IRJET) e-ISSN: 2395-0056
Volume: 09 Issue: 10 | Oct 2022 www.irjet.net p-ISSN: 2395-0072
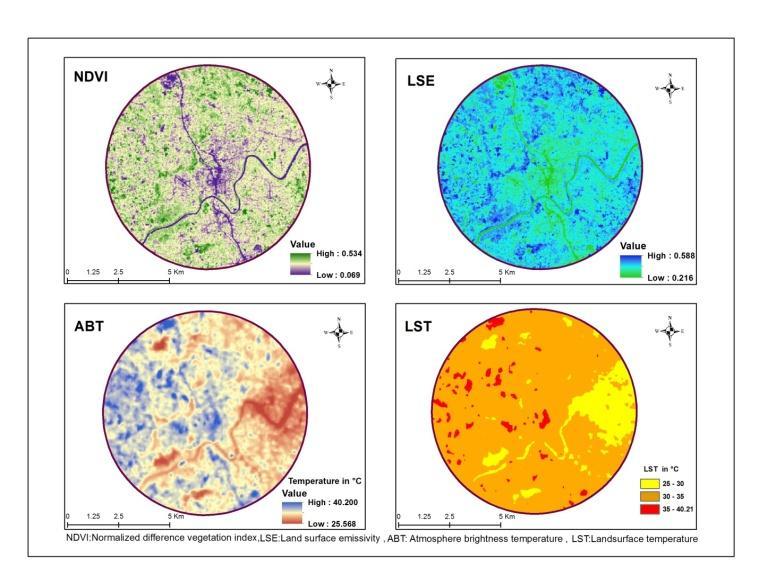
Table -6: LST temperature ranges and areas for the month of March 2019
Sl.No Temperature (°C) Area (Ha) Percentage (%)
1 29.04-30 51.18 0.65
2 30-35 7209.39 91.81
3 35-40 583.54 7.43
4 40-41.65 8.15 0.10
Total 7852.26 100
LST temperature ranges and areas for the month of March 2017.
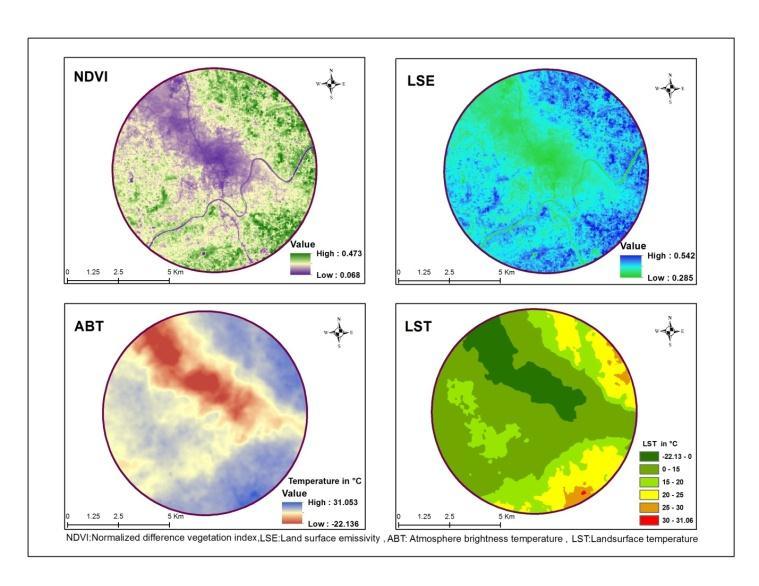
Table -5: LST temperature ranges and areas for the month of March 2018
Sl.No Temperature (°C) Area (Ha) Percentage (%)
1 -22.13-0 1036.98 13.21
2 0-15 3857.09 49.12 3 15-20 1614.69 20.56
4 20-25 1178.04 15.00 5 25-30 161.87 2.06
6 30-31 3.59 0.05
Total 7852.26 100
LST temperature ranges and areas for the month of March 2019.
Table -7: LST analysis of the past 4 years.
Sl N o Year Temperat ure 25˚C-30˚C
Temperatur e 30˚C-35˚C
Temperatu re 35˚C40˚C
1 2016 1405.66 6257.17 23.77 -
2 2017 1023.69 6540.91 587.66 -
3 2018 161.87 3.59 - -
Tempe rature above 40˚C
LST temperature ranges and areas for the month of March 2018.
4 2019 51.18 7209.39 583.54 8.15
TheLULCanalysisshowsthattherehasbeenanincreasein urban areas from 117.89 ha to 338.42 ha during the last decade.Theselandcoverchangeshavealsoinfluencedthe localclimate.Theareashavingtemperaturesbetwee C d C rei cre si g veryears.In2016itwas6257.17ha but in 2019 it is about 7209.39 ha area. Along with this change, the areas coming under the temperature between C d C redecre si g I theareacomingunder thisclasswas1405.66ha.In2019areadecreasedto51.18 ha.
International Research Journal of Engineering and Technology (IRJET) e-ISSN: 2395-0056
Volume: 09 Issue: 10 | Oct 2022 www.irjet.net p-ISSN: 2395-0072
Graphs of LST analysis of past 4 years.
Apartfromallotheryears,2019showsanewclassofareas h vi g temper ture b ve C I cre sedLSTi cert i urbanpocketsincomparisontotheirsurroundingsduetothe increaseinpavedsurfacesisknownastheurbanheatisland (UHI) phenomenon. A landscape of concrete, asphalt, and denselypackedbuildingscanenhanceheat.
Citiescontributetoanumberofseveralthatmightleadto morethunderstormbirthsorstormenhancement.
The urban heat-island effect: A landscape of concrete, asphalt,anddenselypackedbuildingscanenhanceheat.Lowpressureformsatoptheurbanareawithhigherpressurein surroundingruralareas.Thescenariomightcauselow-level atmospheric convergence; which forces air up into thunderstorms. Localized areas of upward moving air resulting from increased surface roughness. A cityscape modifies wind direction and speed, which might lead to enhancedconvergenceandthunderstormformation.
In 2008, 117.89 ha of the total study area was covered by built-ups.In2018built-upscover338.4coveredofthetotal area.Itisanoticeablechangeanditmaybethereasonforthe unpredictablecyclonethatoccurredinChalakudytown.
On August 15 and 16, there was heavy flooding in Chalakudy River as the dams in Tamil Nadu were opened releasingahugeamountofwatertotheriverleadingtothe overflow of Peringalkuthu Dam upstream Athirappally Waterfalls.ThewaterflowsintothePeringalkuthureservoir inKeralafromtheParambikulamandTamilNaduSholayar dams resultingintheChalakudyriveroverflowingandthe townflooding.TheFullReservoirLeveloftheParambikulam dam was 1,825 feet. As the inflow to Parambikulam and TamilNaduSholayardamsincreased,thewaterwasreleased into the Peringalkuthu reservoir and onto the Chalakudy river. 35,000 cusecs of water were released from the Parambikulamdamand30,000cusecsfromtheTamilNadu SholayardamwhichflowedintotheChalakudyriver.
Thetotalstudyareaiscategorizedintothreezones,low flood, medium flood, and high flood according to flood intensity.4868.33Ha,whichis62%ofthetotalstudyarea washighlyaffected.Thefloodcovereda3to4kmdistance fromtheChalakudyRiver.Thewaterlevelreachedapeakof 9.05metersfromgroundlevel.Themostaffectedareasare thoseclosetotheriver.Thefloodedareaswithawaterlevel ofabout1to2.01comeundermediumfloodandit covers 1282.23haofthetotalarea,whichis16.33%.Thelowflood zonecovers 1701.70ha (21.67%) ofthestudyarea witha waterlevelof0.69to1meter.
Causes of floods are due to natural factors such as heavy rainfall,highfloods,hightides,etc.,andhumanfactorssuch asblockingofchannelsoraggravationofdrainagechannels, damfailuresimproperlanduse,deforestationinheadwater regions, etc. Floods result in losses of life and damage to properties.Populationincreaseresultsinmoreurbanization, moreimperviousareasandlessinfiltration,andgreaterflood peakandrunoff.
International Research Journal of Engineering and Technology (IRJET) e-ISSN: 2395-0056
Table -8: Flood zone area.
Sl.No Zone Class Range of Water level (In m) Area (Ha.)
Percentage of total arethe a
1 Lowflood 0.69-1.00 1701.70 21.67
2 Mediumflood 1.00-2.01 1282.23 16.33
3 Highflood 2.01-9.05 4868.33 62.00
Total 7852.26 100
Thetotalstudyareaiscategorizedintothreezones,low flood, medium flood, and high flood according to flood intensity.4868.33Ha,whichis62%ofthetotalstudyarea washighlyaffected.Thefloodcovereda3to4kmdistance fromtheChalakudyRiver.Thewaterlevelreachedapeakof 9.05metersfromgroundlevel.Themostaffectedareasare thoseclosetotheriver.Thefloodedareaswithawaterlevel ofabout1to2.01comeundermediumfloodandit covers 1282.23haofthetotalarea,whichis16.33%.Thelowflood zone covers 1701.70 ha(21.67%) of the study area with a waterlevelof0.69to1meter.
Causes of floods are due to natural factors such as heavy rainfall,highfloods,hightides,etc.,andhumanfactorssuch asblockingofchannelsoraggravationofdrainagechannels, damfailuresimproperlanduse,deforestationinheadwater regions, etc. Floods result in losses of life and damage to properties.Populationincreaseresultsinmoreurbanization, moreimperviousareasandlessinfiltration,andgreaterflood peakandrunoff.
Quarriespresentinthevicinitiesofepicentersincrease theriskofearthquakes.Quarriesarelocatedatadistanceof 5.4 km and 2.9 km from the epicenters. The removal of material from the earth can cause instability, leading to suddencollapsesthattriggerearthquakes.
Theincreasedbuilt-updensityisoneoftheprobablereasons forearthquakes.In2008,117.89haofthetotalstudyarea wascoveredbybuilt-ups.Whenitcomesto2018,built-ups cover338.42haofthetotalarea. Therewasanearthquakein 2007 which means that the study area is vulnerable to earthquakes. Theunplannedexpansionanddevelopmentin disaster-proneareasarethereasonfortheincreasedimpacts ofdisasters.
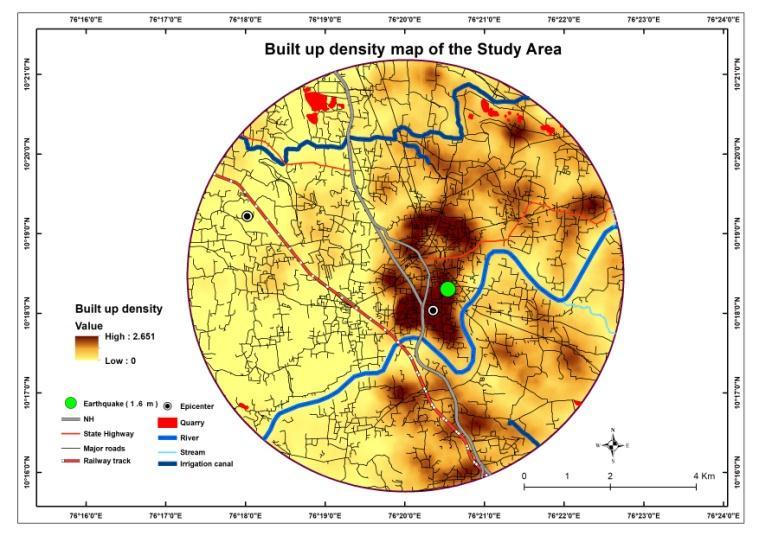
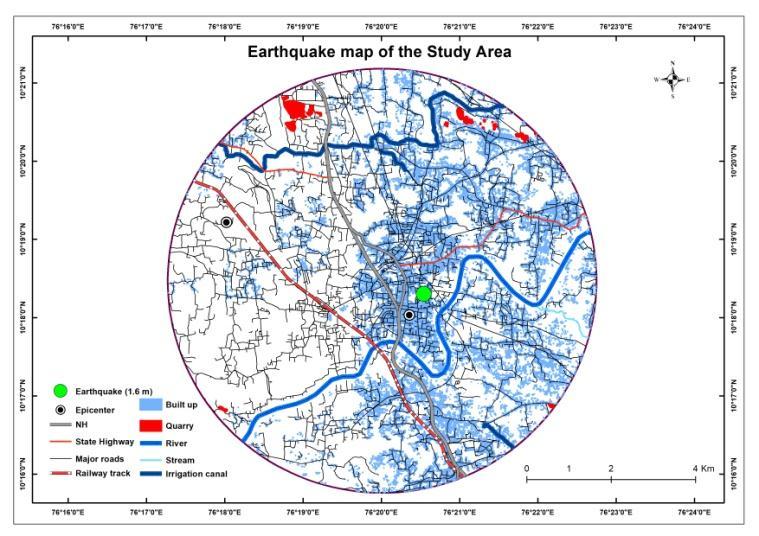
On 18 September 2007 at latitude 10.30 and longitude 76.34, there was an earthquake of magnitude 1.6. The distancesfrom epicenterstothespotare6kmand4.8km. According to the Richter scale, 1.6 comes under micro earthquake.Therearetwoepicentersinthestudyarea.
Chalakudy has become a disaster-prone area becauseofclimaticeventsthathappenedinthepastyears. Thepeoplelivinginthisareahavefacedfloods,destructive wind, and high temperatures. According to the present study, LULC changes play a major role. The decreased amounts of wetlands increased the impact of floods Nowadaysflashfloodsareveryoftenduetopoordrainage systems.Inthecaseoftheappearanceofstrongwind,the increasingamountsofhuman-madeinfrastructuresplaya
Volume: 09 Issue: 10 | Oct 2022 www.irjet.net p-ISSN: 2395-0072 © 2022, IRJET | Impact Factor value: 7.529 | ISO 9001:2008 Certified Journal | Page304
International Research Journal of Engineering and Technology (IRJET) e-ISSN: 2395-0056
Volume: 09 Issue: 10 | Oct 2022 www.irjet.net p-ISSN: 2395-0072
majorrole. Anthropogenicmaterialssuchasconcrete,glass, etc. have high heat capacity. The urban heat island effect forms a low pressure atop the urban area with higher pressure in surrounding rural areas. The scenario might causelow-levelatmosphericconvergence;whichforcesair upintothunderstorms.
The study area was included in the high-impact zone of cyclone Gaja in November 2018. It was dissipated but it coulddamagetheentirearea.
In 2019 there were low flooding and strong wind in the studyarea whichmeantheseeventsarebecomingpart of our life. They may get worse if we do not make decisions aboutglobalwarmingandclimatechange.
OveralltheseclimaticeventsaresomehowrelatedtoLULC changes.Nowitistimetopayforwhatwedidwhichmade all these happen. We must do things to retain the carbon balanceandreducetheimpacts.
[1] Ambika P. Gautam, Edward L. Webb and ApisitEiumnoh(2002). GIS Assessment of Land Use/LandCoverChangesAssociatedWithCommunity Forestry Implementation in the Middle Hills of Nepal MountainResearchandDevelopment.22(1):63–69
[2] C.P. Rajendran, Biju John, K. Sreekumariand KusalaRajendran.(2009).ReassessingtheEarthquake Hazard in Kerala Based on the Historical and Current Seismicity.JournalGeologicalSocietyofIndia.73:785802
[3] G. Sreenivasulua1, N. Jayarajub, K. Kishorec and T. Lakshmi prasadd.(2014). Landuse and landcover analysisusingremotesensingandgis:acaseStudyin andaroundrajampet,kadapa district,andhrapradesh, India. IndianJ.Sci.Res.8(1):123-129.ISSN:0976
[4] H.S.Sudhira,T.V.RamachandraandK.S.Jagadish.(2004). Urbansprawl:metrics,dynamicsandmodellingusing GIS.InternationalJournalofAppliedEarthObservation andGeoinformation.5:29–39
[5] John Rogana and DongMeiChenb.(2004). Remote sensingtechnologyformappingand monitoringlandcover and land-use change. Progress in Planning 61:301–325
[6] N. C. Anil, G.JaiSankar, M. JagannadhaRao and U.Sailaja.(2011).StudiesonLandUse/LandCoverand change detection from parts of South West Godavari District, A.P – Using Remote Sensing and GIS Techniques.15:187-194
[7] PandianMangan.(2014). Land use and land cover changedetectionusingremotesensingandgisinparts ofCoimbatoreandTiruppurdistricts,TamilNadu,India.
[8] Ramachandra T. V., Bharath H. Aithal and DurgappaSanna D. (2012).Land Surface Temperature Analysis in an Urbanising Landscape through MultiResolutionData.Research&Reviews:JournalofSpace Science&Technology.1(1):1-10
Factor value: 7.529