International Research Journal of Engineering and Technology (IRJET) e-ISSN:2395-0056

Volume:09Issue:10|Oct2022 www.irjet.net p-ISSN:2395-0072
International Research Journal of Engineering and Technology (IRJET) e-ISSN:2395-0056
Volume:09Issue:10|Oct2022 www.irjet.net p-ISSN:2395-0072
Dept. of Electrical and Electronics Engineering, JNTU College of Engineering, Hyderabad, India ***
Abstract The blockage of traffic in urban cities is one of the major issues in the cities with the population growth and increase in automobiles. In the present-day Traffic system, wastage of fuel consumption in non-peak hours, as the ongoing traffic signal gives green light for longer duration, even there are few vehicleson theroad, and insome cases, the user must wait as for signal to turn green while there are no other vehicles in the junction's other lanes, which adds to the driver's delay, increases fuel consumption, and raises transportation expenses, and increase air pollution. Regulating traffic flow in peak hours for vehicles to pass is the crucial factor. The ongoing traffic management systems that are in place are generally static, means that they do not adjust according to needs of the traffic flow. The suggested solution aims to provide a computer vision-based traffic controller that can adjust to the flow of traffic. By identifying the passing vehicles at the signal and adjusting green signal period accordingly, it employs a live feed from CCTV footage at traffic intersections to evaluate the traffic density in realtime. The automobiles are categorized as cars, motorbike, bus, truck, or tricycle to determine the green signal time with greater accuracy. For detecting the objects, techniques like YOLO algorithm are used and also counts number of automobiles for each direction. The timers of these traffic signals are set according to density of vehicle in each lane and hence the system becomes adaptive. This helps for clearing the traffic and optimizing the signal as green at a faster rate compared to present system, thus reduces the unnecessary delays, blockage, and waiting time This reduces consumption of fuel and pollution. Pygameisusedfordevelopingsimulation.
Keywords Traffic management, Artificial Intelligence, Object detection with YOLO algorithm, Computer Vision.
With an increase in traffic, many road networks in urban areas experience issues with road capacity and associated service levels. Numerous traffic-related problems arise at the intersection control systems as a resultofconstantsignal timers. They continue with the exact phase sequence as well as its duration. The need
forcutting-edgecontrolsolutionswillbeidentifiedinthe fieldofsmarttransportationsystemsastheneedforroad capacityrises.
From the analysis of Traffic in Hyderabad from “The Times of India” The problem, according to officials of the police department andRoad Transport Authority(RTA), has been triggered by a huge jump in private vehicular populationinthecityduringthepandemic
An estimated 10 lakh new vehicles were registered within the city, including just 4.5 lakh vehicles in the Cyberabad limits alone, resulting in an explosion within the population of vehicles which together with the present ones are criss-crossing the town, as per RTA authorities
There are conventional techniques for control that are gettingusedcurrently:
1)Controlling with static timers at traffic signals: In these fixed timers are loaded into the program. Even when there's no traffic on the lane the green signal is going to bepresentsupportedthetimersetwithintheprogram.
Thiscausesdelayforpeoplewaitingatjunction,andalso increases fuel consumption, transportation cost and increasepollution.
2)Controlling with Manpower: They are managed by a TrafficPolicestandingatjunctioncontrollingthevehicles byhandgestures.
This method requires lot of manpower, when traffic is heavyandincreasingdaybyday
3)Detecting the Traffic with air-sensors: These devices detect the presence of pollution in environment. If pollution reaches particular level, depending on the extent of pollution, traffic density is detected using a sensor.
Since the vehicles on opposite lane also produces pollution, this is drawback for calculating the traffic density.
4)Sensors on the road: Adding some loop detectors or proximity sensors to the road is another advanced technique. This sensor transmits data on the movement oftraffic.Collectedsensordataisusedtomanagevarious trafficsignals.
International Research Journal of Engineering and Technology (IRJET) e-ISSN:2395-0056
Volume:09Issue:10|Oct2022 www.irjet.net p-ISSN:2395-0072
This contains a drawback of precision and scope of high-quality information i.e., usually supported highcost technologies; hence a tightbudget will cut back on thenumberoffacilities.Additionally,alotofsensorsare typically needed to provide complete coverage across a facilitynetworkduetothelimitedoptimalrangeforthe mostsensors.
Proposed system: The suggested system in this paper is meant to detect the volume of traffic and timers are setforeverylanebasedonthetrafficdensitycalculated, this density may easily be adapted to current state of the traffic. Here, calculating traffic density can be done by taking live video at the junction, and by identifying the number of automobiles for individual lane approaching the junction and adjusting the duration of the green light. To determine a precise estimation of a green traffic time, the automobiles are identified as being a car, motorbike, bus, truck, or tricycle. It uses YOLO,soastoidentifythenumberofvehiclesandsoset thetimerofparticularlightinstepwithvehicleamount withintheappropriatedirection
This reduces unneeded delays, overcrowding, and waitingtimes,whichsuccessivelyreducestheamountof fuel used and pollutants produced. Additionally, traffic is moved much more quickly than it would be under a staticsystem.
A traffic management system supported image processing utilizing MATLAB code that modifies the timing of the green, yellow,red light depending on the volume of traffic. One Arduino UNO is used to control the green and yellowlights, and the other is used to controltheredlightandthisisoftenendlessprocess[6]
Anadaptivestoplightcontrollersupportedsymbolic rationale for enhancing traffic flow at a remote crossroads. Using the data gathered from traffic detectors, a set of fuzzy rules has been created (queue length, arrival flow, and exit flow), evaluates the time for the lane. Two components make up the suggested fuzzy system: one with the primary driveway (which willreceivethenextvolumeofvehicles),andoneforthe second driveway (with a lower volume of vehicles). Differentscenarioswithvariedtrafficdemandsareused to compareproposed controller to a set signal programmed in order to verify the performance of the proposeddecisionrules[9]
Before being submitted to the databases, the live video feedis edited. A C++-based algorithms is then used to generate the results. The techniques of hard coding and dynamic coding are contrasted, and the dynamic approach demonstrated a 35% improvement forcontrollingthesignaltimers.[3]
PIC microcontroller that implements dynamic time slots with various levels and measures traffic volume using Infrared sensor. Additionally, conveyable controller is designed to resolvetraffic density and set thetimersforovercrowdedroads.[4]
Acamerainstalledwithlightaccustomedcapturesthe live road images. Then the acquired pictures are loaded intodigitalimageprocessortoseekoutthetrafficdensity on the road then the traffic lights are managed. By avoidingtimelostonemptyroads,thesuggestedstrategy makesoptimaluseoftimeandfuelresources.[5]
Using image and video processing, actual traffic volume may be calculated using live video stream from the webcams at traffic intersections It also works upon that algorithm for adjusting traffic signals in accordance with traffic volume on the road, intending to lessen congestion on roads that can reduce the number of accidents and fuel consumption will be reduced over time. Additionally, it'll still offer important information thatcansupportanalysisandplanningforupcomingroad projects. To further reduce traffic snarls and improve traffic flow, moreover signal lights are frequently synced withoneanother.[6]
Photos are captured by the camera using a Microcontroller based system, which then processes the photographs in MATLAB. Vehicle density is determined after the images are converted to criterion images by reducing saturation and colors Through the USB and preconfigured simulation packages, MATLAB and Arduino are coupled. The Arduino determines the length of each lane's green light based on traffic volume and density. But there is a problem with this approach. The vehiclesfrequentlycollideoneanotherandit'sdifficultto induce correct number of vehicles on the road. Additionally, since diverse things were also turned to whiteandblack,theyinterferedwithdetectionandisnot possible to distinguish between common things like poles,trees,andbillboardswithvehicles.[7]
Algorithm for vector machines together using image processing techniques. in real-time video, the method is usedbecauseimagesinshortframesarerecorded.
Prior to using SVM, OpenCV is used to complete the image processing and convert the images to grayscale. Using this technique, red light violations and traffic densityarebothdetected[8]
A traffic density- and image-processing-based adaptive light timing control. This method uses a highresolution image sensor, MATLAB, an Arduino signal timing, and transmission based on UART principles. But, neither the permitted ambulances nor accidents at the intersectionareprioritizedbythissystem[9]
International Research Journal of Engineering and Technology (IRJET) e-ISSN:2395-0056
Volume:09Issue:10|Oct2022 www.irjet.net p-ISSN:2395-0072
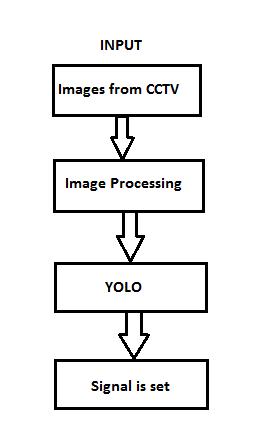
InProposedsystemlivevideoistakenattraffic intersection as a source for current traffic density calculation. Here, density calculation utilizes image processing with python object detection is carried out utilizing YOLO Algorithm. This image is given to the vehicle identification system, which employs YOLO, as seen in Fig. 1. The YOLO method counts the number of each sort of vehicle, including cars, bicycles, buses, and trucks,toevaluatethetrafficdensity.Thisdensity,along with a few other variables, is used by the signal changing algorithm to fix the signal timeas green for eachlane.Accordingly,thesignalasredaremodified.In order to prevent a particular lane from going without traffic, the green signal timeris limited to a minimumand maximumvalue. Additionally, simulation iscreatedtoshowtheprecisionandcontrastitwiththe currentstaticsystem.
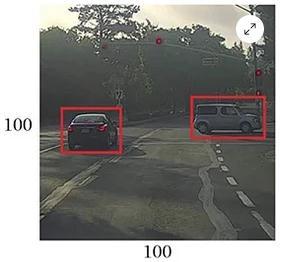
The suggested system leverages "You Only LookOnce"(YOLO)forobjectclassification,whichoffers the requisite precision and processing speed. Vehicle detection was taught utilizing a customized YOLO model, which can identify a number of vehicles including automobiles, bikes, large vehicles (such as trucksandbuses),andmotorbikes
The YOLOv3 algorithm first separates a picture into a grid. a grid cell each predicts some number of boundary boxes(sometimesstatedasanchorboxes)aroundobjects that score highly with the aforementioned predefined classes.
Yolotakesaninputimageinitially:
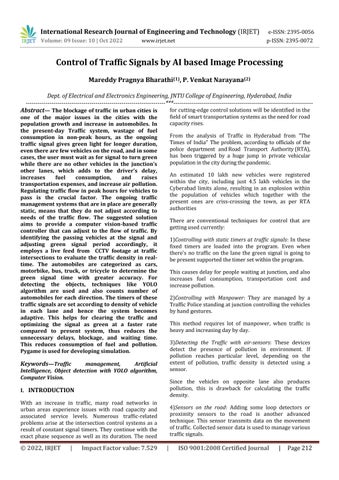
Theframeworkcreatesgridsfrominputimage(saya3X 3grid):

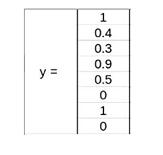
Each grid employs image localization and classification. The object's bounding boxes and the associatedclassprobabilitiesarethenpredictedbyYOLO. Supposewe'vegotdividedtheimageintoa3x3gridand have created a total of three categories into which we want the object to be categorised. Consider that the categories are, respectively, Motorcycle, Car, and Pedestrian.So,foreverygrid,thelabelyisgoingtobean eight-dimensionalvector:
Here,
pcdetermineswhetherornotanobjectisincludedin thegrid(itistheprobability)
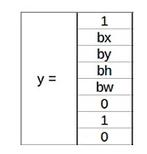
by, bx, bw, and bh specifies the bounding box if any objectispresent
International Research Journal of Engineering and Technology (IRJET) e-ISSN:2395-0056
Volume:09Issue:10|Oct2022 www.irjet.net p-ISSN:2395-0072
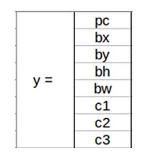
c1, c2, and c3 stand in for the classes. In the event that the object is an automobile, then c2 will be 1 andbothc1,c3willbe0,andtheprocesscontinues
Suppose we choose a first grid as from example above:
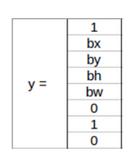
Because this grid is empty, pc will be 0 and the label y ofgridbe:
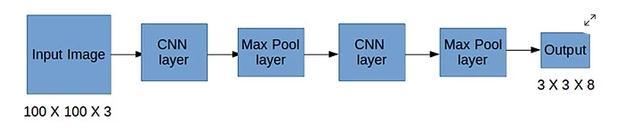
Sincewehaveanobjectinthisgrid,pcisenoughto 1. thenby, bx, bw, and bhwill be calculated in relation to the specific grid cell that we are working with. Cars being of the second class, c2 = 1 & c3and c1= 0, respectively. We will therefore obtain an eight dimensionoutputvectorfor eachoftheninegrids.The outputwillbethreebythreebyeightinsize.Sonowwe haveatargetvectorandaninputimage.Ourmodelwill betrainedusingtheexampleabove(inputimage:100X 100X3,output:3X3X8):
The grid is empty, therefore the bx, by, bh, bw, c1, c2, andc3contain.Takeanothergridwhereanautomobile ispresent(c2=1)
Inrelationtothegridcell thatweareworking with, theby,bx,bw,andbharecalculated.Takealookatthe right-centergrid,whichhasanautomobileinit:
YOLO determines whether an actual object is present within the grid. If there are two objects (two automobiles) in the image YOLO takesmidpoint among thosetwoitemsandassignthoseobjectstothegridthat containsthecentroidofthoseobjects.Thencar'scenterleftgrid'sylabelreads
International Research Journal of Engineering and Technology (IRJET) e-ISSN:2395-0056
Volume:09Issue:10|Oct2022 www.irjet.net p-ISSN:2395-0072
Therefore, just this grid will be used to calculate by, bx,bw,andbh.Thisgrid's labelywillbe:
Step-1:Requiredlibrariesareimported
Step-2: Create a method to filter individual boxes dependingontheircriteriaandchances
Step-3: Develop an algorithm to determine the IOU amongtwoboxes
Step-4:ImplementaNon-MaxReductionfunction
Step-5:Estimatetheboundingboxcoordinatesafter creatingarandomvolumewiththesize(19,19,5,85).
pc=1Sinceacarispresentinthisgridandthere'san
Step-6: Finally, we will build a function that will accept the CNN outputs as input and producethe suppressedboxes.
Step-7: Make a prediction for a random space using theyoloevalutility
Step-8:TestapreviouslytrainedYOLOalgorithmon recentphotos.
Step-9: Create a method to anticipate the bounding boxes,thensavethephotoswiththem.
object, soc2 = 1. The coordinates for any or all of the grids(by,bx,bw,andbh)inYOLOare:
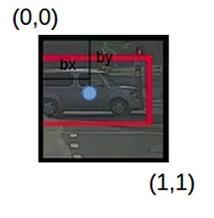
The by, bx are the x and y coordinates of the midpointofthearticlewithrelevancythisgrid.during thiscase:
Theratiooftheheightoftheboundingbox(theredbox in the example above) to the height of the associated grid cell is known as bh, and in our case, it is approximately0.9.So,bh=0.9.BWistheproportionof thebounding box's widthto thewidthofa gridcell.So, bw=0.5(approximately).Thisgrid'sylabelwillbe:
The midpoint will always be inside the grid, hence the byand bxwill always fall between 0 and 1. While bh & bw are frequently equal to 1, just in instance the bounding box's dimensions are equal to the grid's dimensions
Step-10: Using the estimate function, read a picture andestimation
Step-11:Plottheestimations
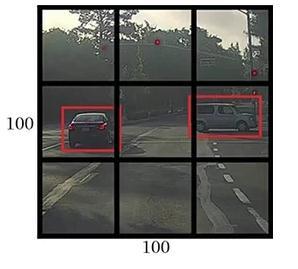
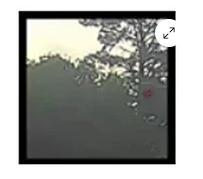
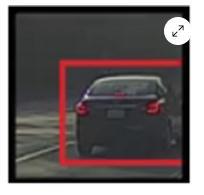
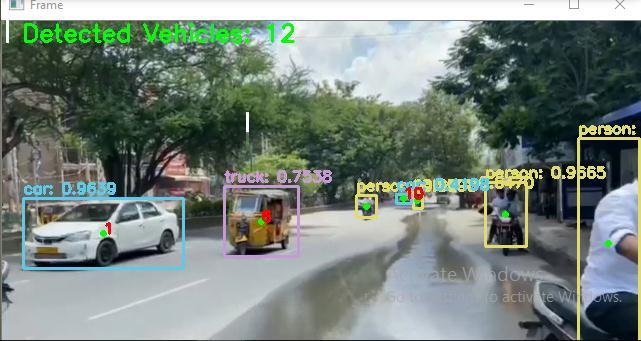
Herevideosof4lanesatajunctionaretakenand detectedvehiclesfor5seceachoneachsideofthelane for calculation of vehicle density This is a picture of detectedvehiclesinthelane'srightside
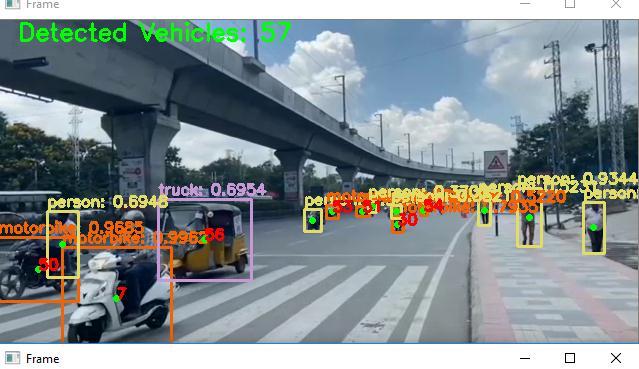
Detectedvehiclesonrightlane=57
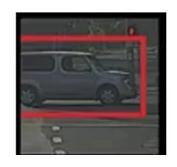
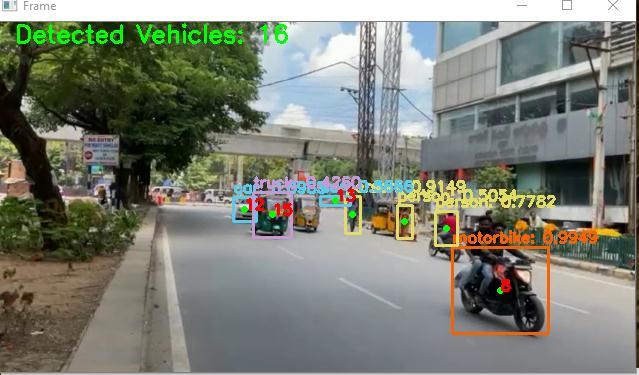
Similarly,frontlanedetectedvehicles=16
International Research Journal of Engineering and Technology (IRJET) e-ISSN:2395-0056
Volume:09Issue:10|Oct2022 www.irjet.net p-ISSN:2395-0072
n = no. vehicles passing in t seconds t = time for passing vehicles (s)
2)
: K=(n*1000)/l Where, k = vehicles per km n = no. of vehicles occupying a length l on the road l = the length of road occupied by vehicles (m)
Considering traffic density calculated, the timer will be determinedbythedensityontheroad.
The vehicle detecting module's traffic density data is used by the Signal switching algorithm to set green trafficsignal timer and updatered trafficsignal timersofallothersignals.Additionally,itcyclesbackand forthamongthesignalsinaccordancewithtimers.
The detection module's vehicle detection information,asdescribedintheprecedingsection,serves as the algorithm's input. This one is frequently in JSON format, also with accuracy and dimensions as the values and the label of the object detected as the key. After this data has been analyzed, the total number of automobiles ineachclassisdetermined.
Following that, the signal's green time is estimated and assigned,andalsothesignal’sredtimeofallothersignals arealteredcorrespondingly.Themethodcanbeadjusted for any multiple of signals at a junction, either up or down.
The following elements are taken into account when creatingthealgorithm:
a) The time interval of algorithm to estimate traffic density and the length of green signal light, this gives informationofimagetobeacquiredatparticulartime
b)Countoflanes
Thevehicletrafficflowonaroadcanbe expressedq=n*3600/t
where, q = vehicle flow (no. vehicles per hour)
c) Total number of each type of vehicle, including automobiles,trucks,motorbikes,etc.,
d) Using the aforementioned variables, traffic density wasdetermined
e) Each car has lag at startup, and also the non-linear rise in lag faced by the vehicles in the rear results in additionaltime.
International Research Journal of Engineering and Technology (IRJET) e-ISSN:2395-0056
Volume:09Issue:10|Oct2022 www.irjet.net p-ISSN:2395-0072
f) The avgspeed of every class of car whenever the green light turns on, or the average amount of time eachtypeofvehicleneedstocrosstheintersection.
g) The maximum and minimum cut-off time for the durationofagreensignal,tostopblockageoftraffic
The standard time for the principal signal of an initial cycleis ready when the algorithm is run for thefirst time, and as a result, the algorithm sets the times for all other indicators of the initial cycleand all subsequent signals. Every direction's vehicle detection is handled by a different thread, while the signal's timer is handled by the main thread. The detecting threads take a picture of the following direction whenever the green traffic timer of the present signal (orthered-lighttimerofthenextgreenlight)reaches5 seconds. The timer for the succeeding green signal is then set when the result has been parsed All of this occurs within background as the majority of threads continue to count down the remaining seconds on the greensignaltimer.Thismakesitpossibleforthetimer to be assigned seamlessly, avoiding any latency. The succeeding signal turns green for number of seconds set by the algorithm whenever the green timer of this signalreacheszero.
Whenthesignalthatwillturnintogreennextis 5 seconds away, the picture is taken. This gives the system a full 10 seconds to analyze the image, count the number of vehicles in every class that are visible there, determine the green traffic time, and set the durationof thissignal aswell asthered signal period ofthenextsignalcorrespondingly.Thenormalspeeds ofcarsatstartandtheiraccelerationtimeshavebeen used,basedonwhichanestimationofthetypicaltime each class of vehicle takes to cross a junction was established, to get the ideal green signal time supported the number of vehicles of each class at a signal.Then,thegreentraffictimeisdeterminedusing (1)
Here:
•GSTmeansGreenSignalTime
•NoofVehiclesofClassmeansnumberofcarsofeach vehicleclassonthesignaldetectedbythemoduleof vehicledetection.
•AverageTimeofClassmeansaveragetimeforvehicles ofthatclasstocrosstheintersection.
•NoofLanesmeansNumberoflanesinthejunction.
Theaverage-timeittakesforeachclassofvehiclesto cross an intersection is set according to the placement. i.e., By region, by city, by site, or perhaps by intersection-wise, assisted by the property of the intersection to facilitate traffic management. For this purpose, data from each transport company are often evaluated.
Insteadofalwayspointinginthedirectionclosestto the start, the signal periodically changes. This frequently occurs when the present system is coordinated, so people don't have to reroute or cause confusionandtrafficlightsturngreenoneatatimeina setpattern.Additionally,becauseoftheexistingsystem, traffic lights are in the same order and yellow traffic lightsareregardedthesameway.
Orderofsignal:RedtoGreentoYellowtoRed
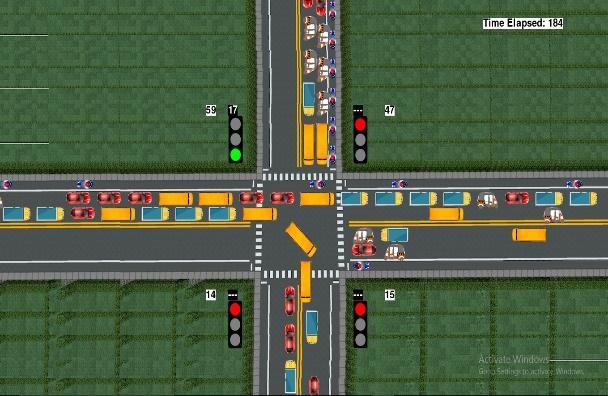
To model actual traffic, Pygame was used to create simulation from scratch. It helps with system visualisation and contrast with the current static system.A 4-wayjunction with4trafficlightsis present there. Each signal has a timer on itstopthat indicates howlongitwilltakeforthelighttochangefromgreen-yellow, red--green, or from yellow--red. The number of vehicles that have passed through the intersection is also shown next to each light. Automobiles, bicycles, buses, lorries, and rickshaws are all readily available. A few of the automobiles in the rightmost lane communicatecross thejunctiontomakethesimulation seem more realistic. When a vehicle is generated, the ability to rotate or not is set up using random data. It also has a timer that shows how much time has passed since the simulation started. A snapshot of the simulation'sfinalresultisshowninFig.2. Fig
International Research Journal of Engineering and Technology (IRJET) e-ISSN:2395-0056
Volume:09Issue:10|Oct2022 www.irjet.net p-ISSN:2395-0072
Lane3:26
Lane4:27
Totalvehiclespassed: 250
Totaltimepassed: 300
No. of automobiles passed per unit time: 0.833333334
A Python module set called Pygame is cross-platform and made for creating video games. This provides music and graphics libraries created specificallyfor use with Pythonartificial language. On top ofthe superbSDL library, Pygame adds capabilities.This enables Python programmers to develop multimedia applications and fully functional games Pygame could also beused on almostanyplatformandpackageandisfairlyportable
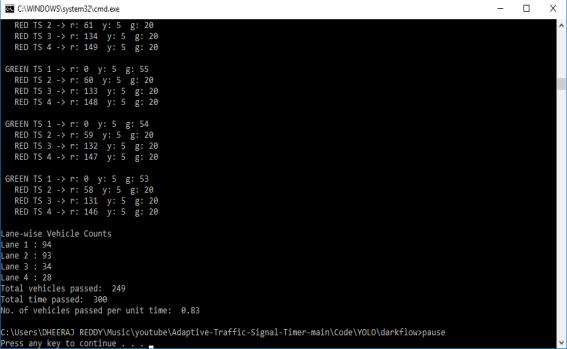
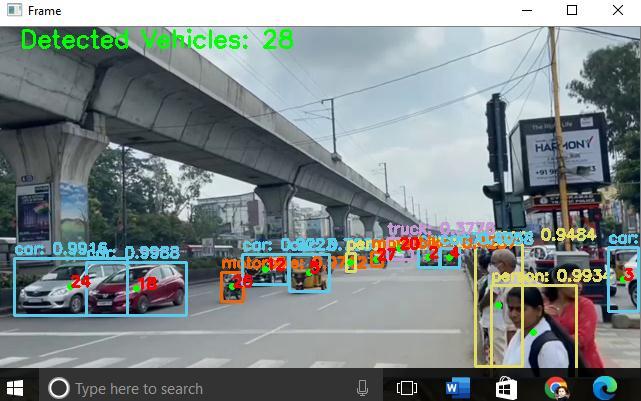
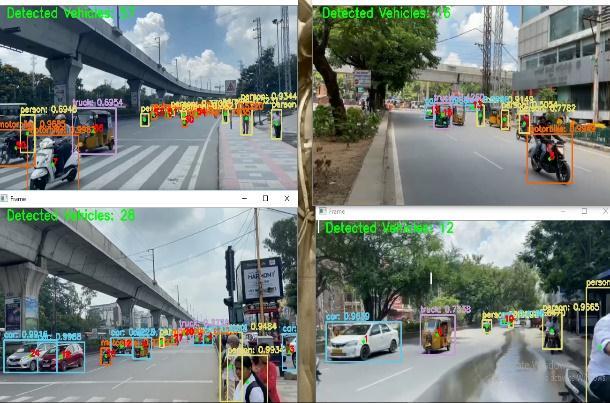
In the below image 4 sides of the junction is taken andvehicle detectionisdonein eachlane, according to the vehicle detection count, timer is set green for more time on the side of lane with more vehicles than the othersidewithlessvehicles. Figure3:4lanesoutput Lane-wiseVehicleCounts
Lane1:57
Lane2:16
Lane3:28
Lane4:12
Applying various test photos comprising varied numbers of cars, the vehicle detection-module was put to the test, and as a result, it was determined that between75% and80%of time, detectionaccuracywas accurate.InaboveFig.4,testresultisdisplayed.Thisis frequently acceptable but not ideal. The absence of an accurate dataset is the primary cause of low accuracy. To build on this, model is frequently trained using actual traffic camera footage, increasing the system's accuracy
No matter of distribution, the suggested system always outperforms the static system. The improveinefficiencyisbasedonhowunevenlytrafficis distributedamongthelanes.Theperformanceimproves asthetrafficdistributionbecomesmoreskewed.
The suggested approach only marginally outperforms the current system when traffic is evenly or near to evenly distributed throughout the 4 lanes. Here, performancehasimprovedbyaround9%.
The suggested system outperforms current method by a large margin when the traffic distribution is considerably skewed. Here, performance has improved by roughly 22%. This is often the nature of trafficdispersionthatoccursinreal-worldsettings.
The suggested system offers a vast performance gain thantheexsistingsystemwhenthedispersionoftraffic was significantly skewed. where the red and mete are separated by an excessive space and the line descends quickly. Here, performance has improved by roughly 36%.
The simulations are conducted for 5 min for every distribution under identical simulation conditions, including the dispersion of traffic, vehicle
International Research Journal of Engineering and Technology (IRJET) e-ISSN:2395-0056
Volume:09Issue:10|Oct2022 www.irjet.net p-ISSN:2395-0072
speeds, that vehicles would turn, the distance between vehicles, etc. It was identifiably demonstrated that the suggestedsystemperformed23%betteronaveragethan the existing system with set times. This also suggests a decrease in the length of time that green light stays idle becauseofthevehicles'waitingperiod
In conclude, the suggested system provides the signal as green for the lanewith more trafficfor a extended periodoftimethanthe lanewithlesstrafficby setting the green signal time adaptive with the traffic density at the junction. This can lessen unneeded delays, traffic, and waiting times, which will ultimately result in lessfuelusageandpollution.
In terms of the quantity of vehicles passing the junction, the system appears to perform around 23% better than the current method, which might be a considerable improvement. This method will be enhanced to achieve even greater results with further calibration utilizing real-world CCTV data for the model training.
[1] M. M. Gandhi, D. S. Solanki, R. S. Daptardar and N. S. Baloorkar, "Smart Control of Traffic Light Using Artificial Intelligence," 2020 5th IEEE International Conference on Recent Advances and Innovations in Engineering (ICRAIE), 2020, pp. 1-6, doi: 10.1109/ICRAIE51050.2020.9358334.
[2] https://www.analyticsvidhya.com/blog/2018/12/pr actical-guide-object-detection-yolo-frameworpython/
[3] https://www.researchgate.net/publication/2241066 88_Design_of_Intelligent_Traffic_Light_Controller_Usi ng_Embedded_System
[4] A. Vogel, I. Oremović, R. Šimić and E. Ivanjko, "Improving Traffic Light Control by Means of Fuzzy Logic,"2018InternationalSymposium ELMAR,2018, pp.51-56,doi:10.23919/ELMAR.2018.8534692.
[5] J.Hosur,R.RashmiandM.Dakshayini,"SmartTraffic light control in the junction using Raspberry PI," 2019 3rd International Conference on Computing Methodologies and Communication (ICCMC), 2019, pp.153-156,doi:10.1109/ICCMC.2019.8819695.
[6] Khushi, "Smart Control of Traffic Light System using ImageProcessing,"2017InternationalConferenceon Current Trends in Computer, Electrical, Electronics andCommunication(CTCEEC),2017,pp.99-103,doi: 10.1109/CTCEEC.2017.8454966.
[7] .https://timesofindia.indiatimes.com/city/hyderab ad/only-40-tech-firms-open-yet-traffic-jamsplague-itcorridor/articleshow/92760259
[8] A. A. Zaid, Y. Suhweil and M. A. Yaman, "Smart controlling for trafficlight time," 2017 IEEE Jordan Conference on Applied Electrical Engineering and ComputingTechnologies(AEECT), Aqaba,2017,pp. 1-5,doi:10.1109/AEECT.2017.8257768.
[9] Renjith Soman "Traffic Light Control and Violation Detection Using ImageProcessing”.”IOSRJournalof Engineering(IOSRJEN),vol.08, no. 4, 2018, pp. 2327
[10] Siddharth Srivastava, Subhadeep Chakraborty, Raj Kamal, Rahil, Minocha, “Adaptive traffic light timer controller”,IITKANPUR,NERDMAGAZINE.
[11] A. Kanungo, A. Sharma and C. Singla, "Smart traffic lightsswitchingandtrafficdensitycalculationusing video processing," 2014 Recent Advances in Engineering and Computational Sciences (RAECS), Chandigarh, 2014, pp. 1-6, doi: 10.1109/RAECS.2014.6799542.
[12] Ms. Saili Shinde, Prof. Sheetal Jagtap, Vishwakarma Institute Of Technology, Intelligent traffic managementsystem:aReview,IJIRST2016
[13] Arkatkar, Shriniwas & Mitra, Sudeshna & Mathew, Tom. “India” in Global Practices on Road Traffic SignalControl,ch.12,pp.217-242
[14] J. Hui, ‘Real-time Object Detection with YOLO, YOLOv2 and now YOLOv3’, 2018. [Online]. Available: https://medium.com/ @jonathan_hui/ real-time-object-detection-with-yolo-yolov228b1b93e2088
[15] J. Redmon, ‘Darknet: Open Source Neural Networks in C’, 2016. [Online]. Available: https://pjreddie.com/darknet/
[16] Tzutalin, ‘LabelImg Annotation Tool’, 2015. [Online]. Available: https://github.com/tzutalin/labelImg
[17] Li,Z.,Wang,B.,andZhang,J. “Comparativeanalysis ofdrivers'start‐up time of the first two vehicles at signalized intersections”, 2016 J. Adv. Transp., 50: 228–239.doi:10.1002/atr.1318
[18] ‘Pygame Library’, 2019. [Online]. Available:https://www.pygame.org/wiki/about
[19] Open Data Science, ‘Overview of the YOLO Object Detection Algorithm’, 2018. [Online]. Available: https://medium.com/@ODSC/ overview-of-theyolo-object-detection-algorithm-7b52a745d3e0